
Day Trading Blog
Strategy breakdowns, broker reviews, risk management guides, and market analysis - written by traders, for traders. No courses to sell, no hype. Just honest, practical content published regularly and free to read.
Latest Posts
461 articles· Page 1 of 16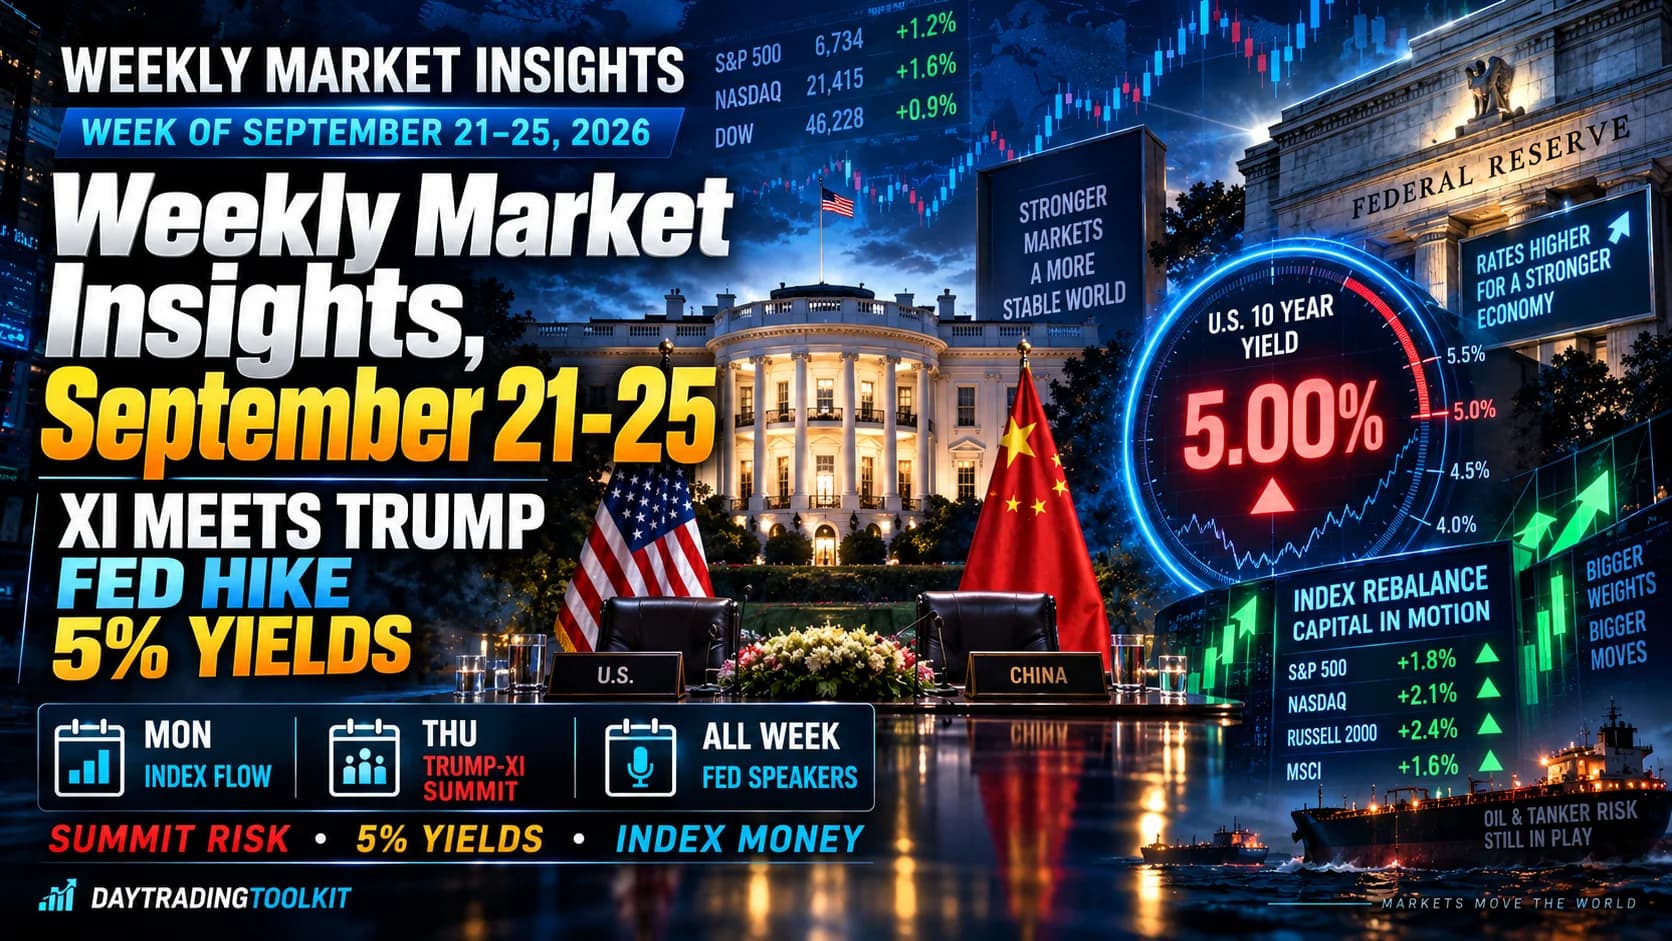
Xi Comes to Washington, the Fed's First Hike Lands, and Index Money Moves Before Monday's Open: Weekly Market Insights, September 21-25
Xi Jinping arrives at the White House Thursday for the first Chinese state visit since 2015, the Fed just hiked to 3.75-4.00 percent with more projected, the 10-year is sitting on 5 percent, and Bloom Energy and SanDisk join their new indices before Monday's open. The full catalyst map, watchlist, and scenario tree for September 21-25.
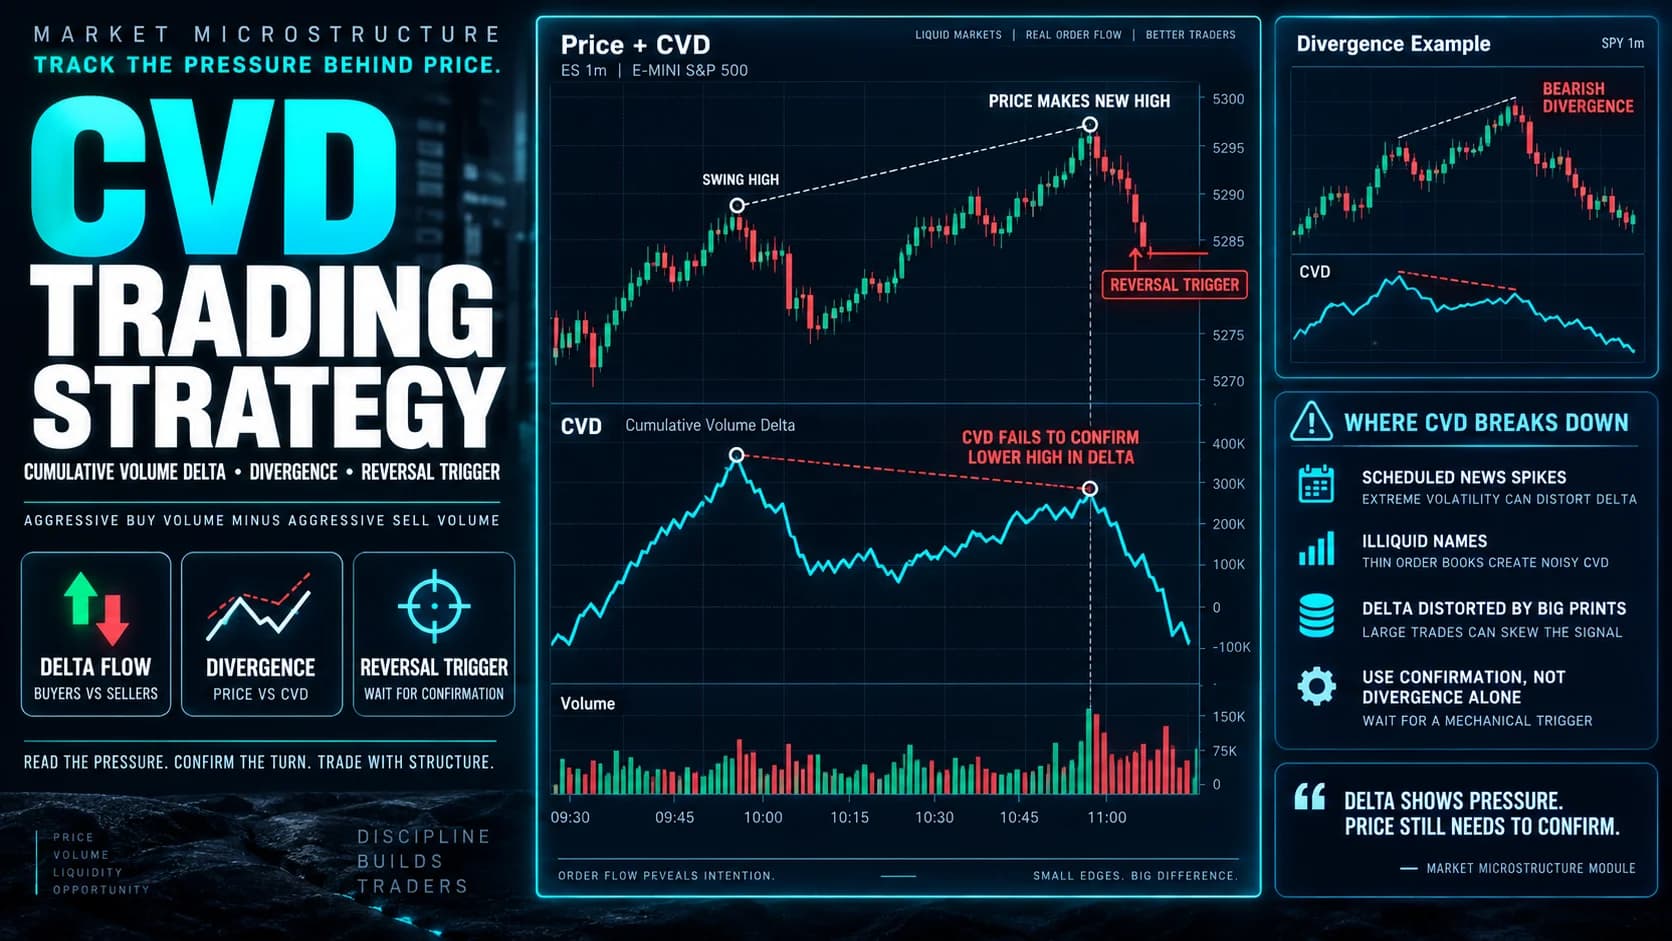
The Cumulative Volume Delta (CVD) Trading Strategy
A mechanical framework for trading cumulative volume delta divergence, including why CVD resets differently across platforms and why a divergence can run much longer than it looks like it should.
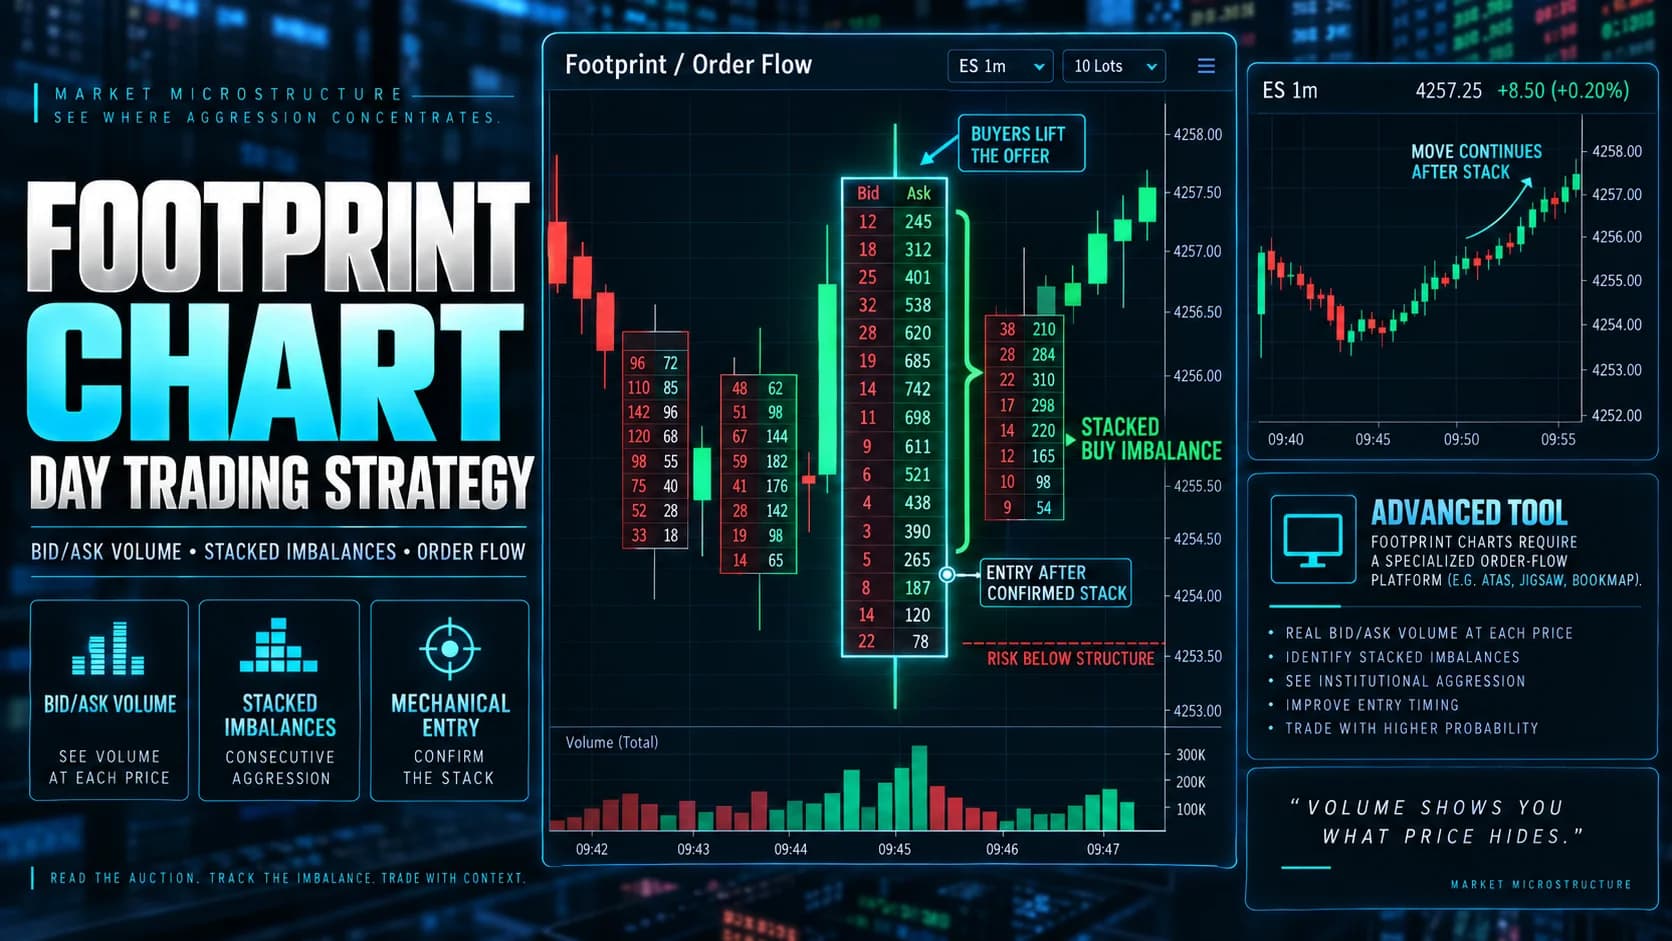
The Footprint Chart Day Trading Strategy
How footprint charts work, the stacked imbalance setup that gives them a real trading edge, and why the data quality behind a footprint chart matters more than the chart itself.
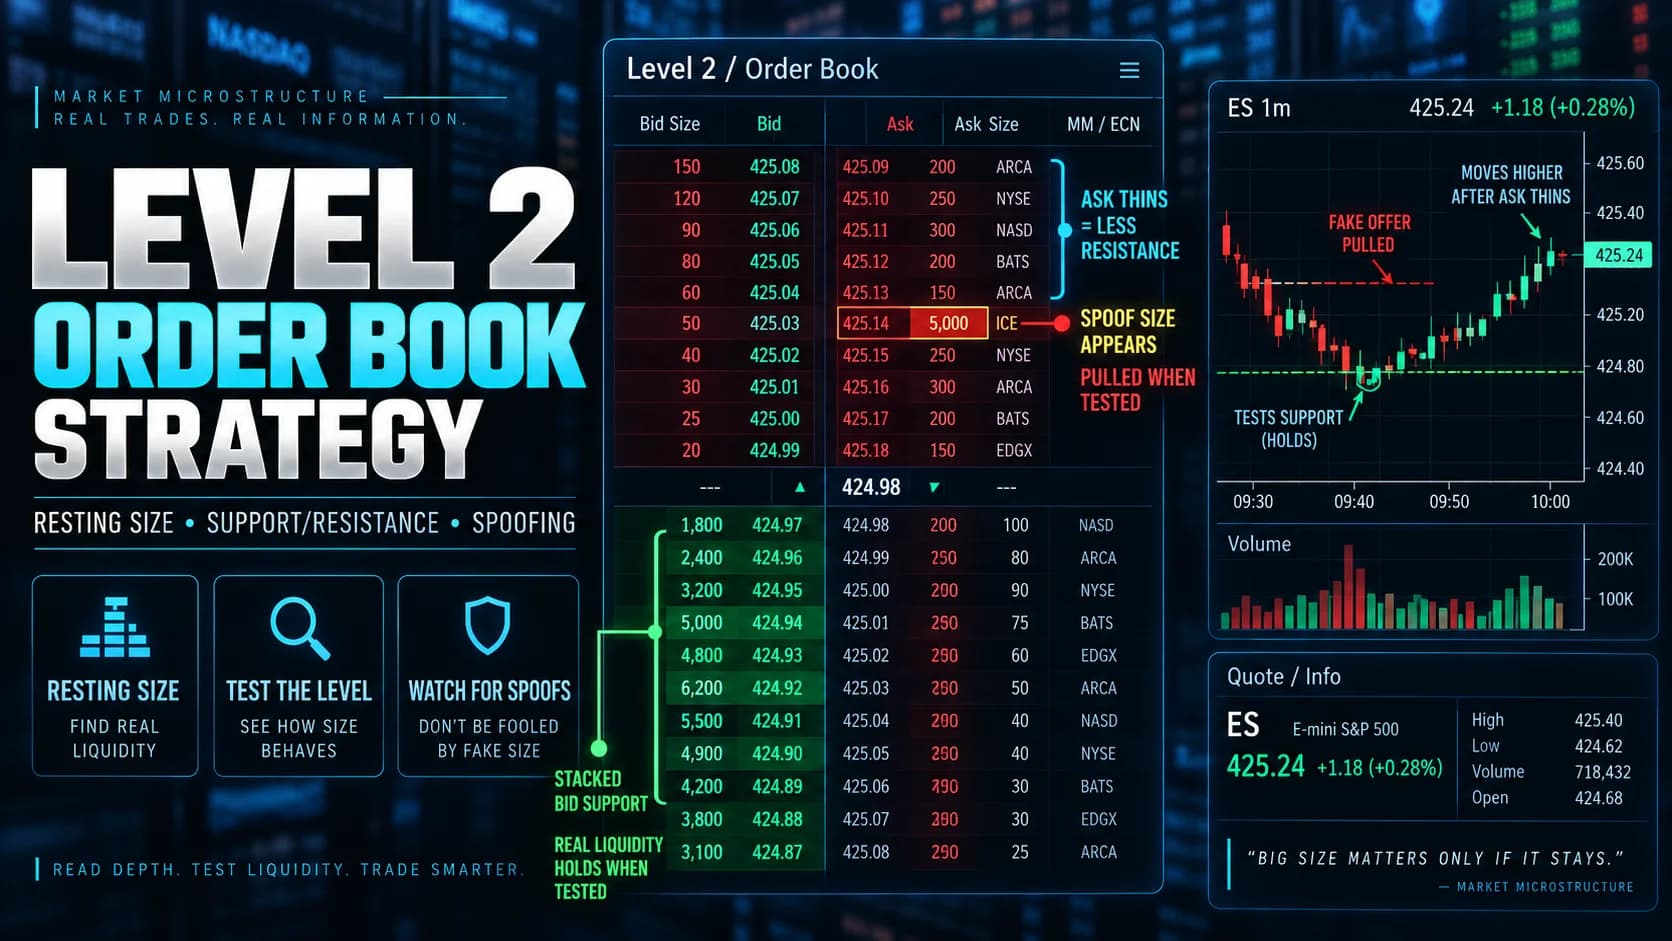
The Level 2 Trading Strategy: Reading the Order Book for Edge
How to read Level 2 depth for a real trading edge: the absorption setup, how to tell genuine resting size from spoofed orders, and why the order book lies more than most traders realize.
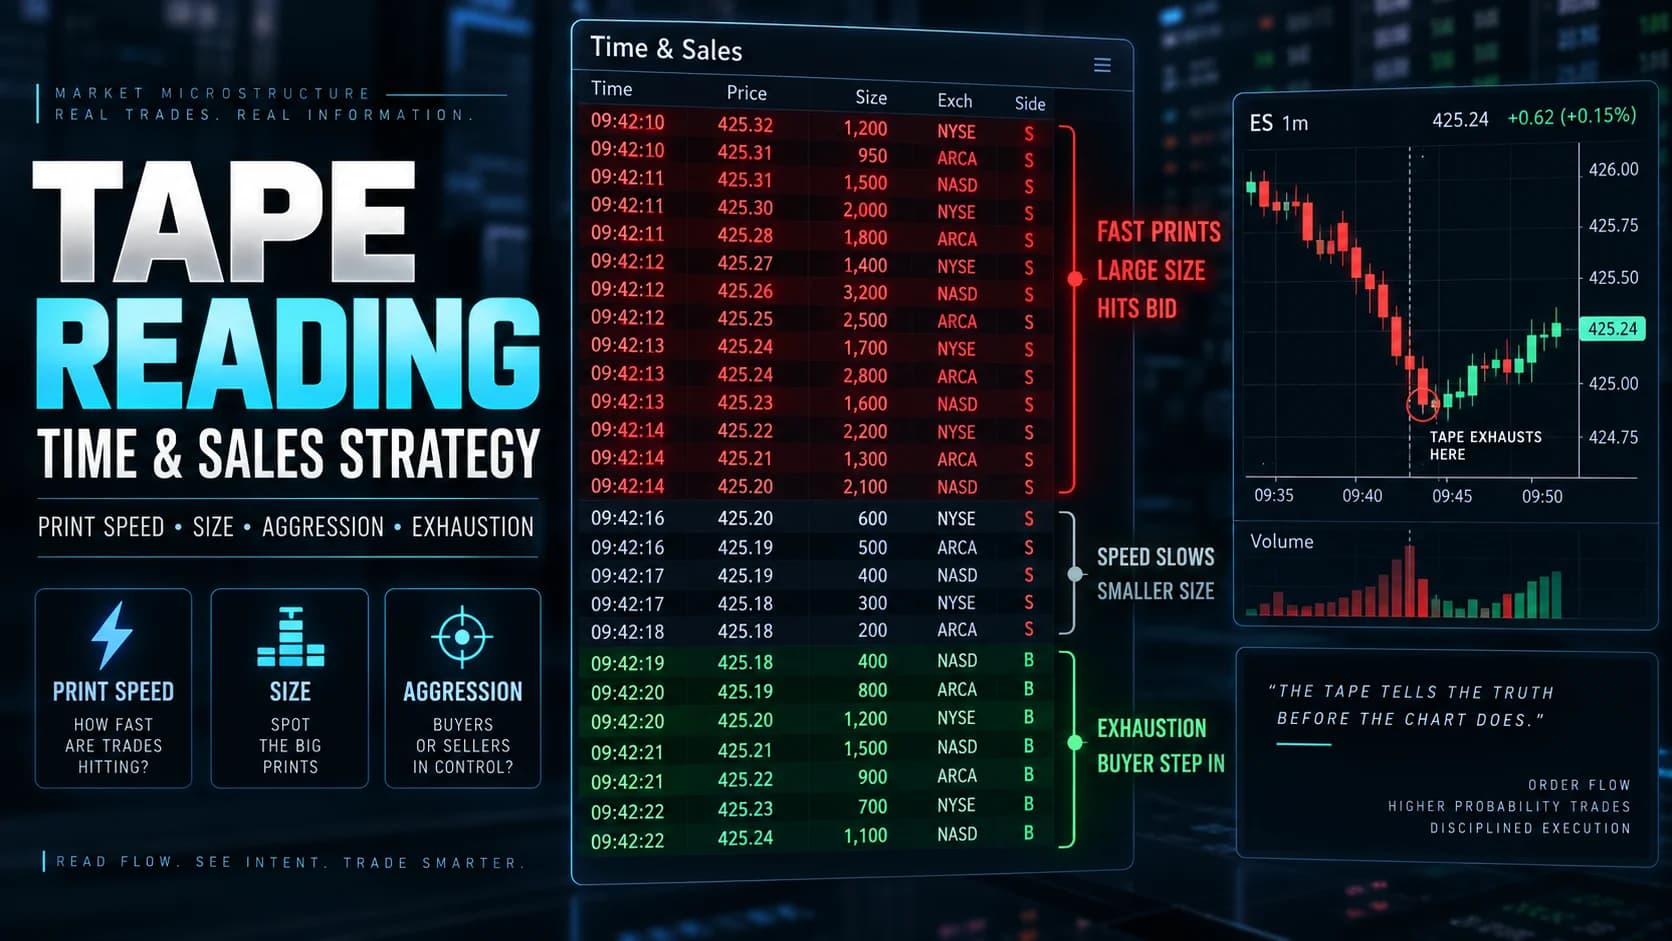
Tape Reading for Day Traders: Reading Time & Sales Like a Pro
A mechanical framework for reading Time & Sales: how to spot a genuine exhaustion print in real time, why the tape lies more often than it used to, and how to build a tradeable trigger around it.
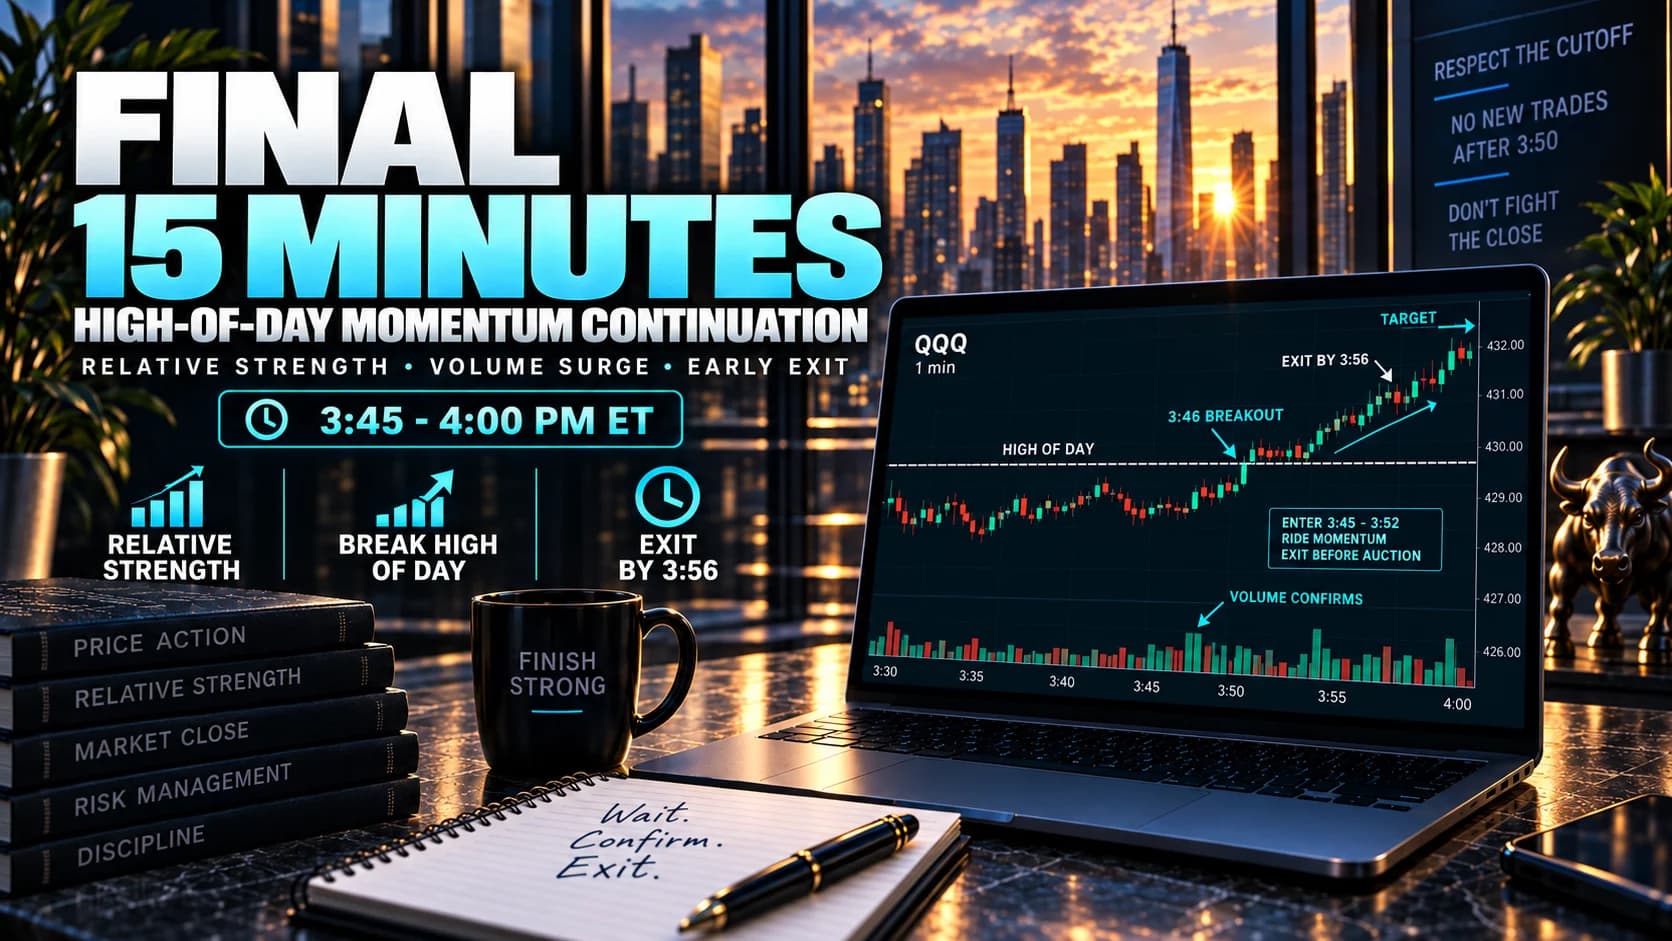
Trading the Final 15 Minutes: The 3:45 PM Setup Playbook
The last 15 minutes concentrate the day's heaviest volume as MOC orders, institutional flow, and day-trade closeouts collide. Learn the narrow momentum setup and why most traders should stop opening new trades by 3:50 PM.
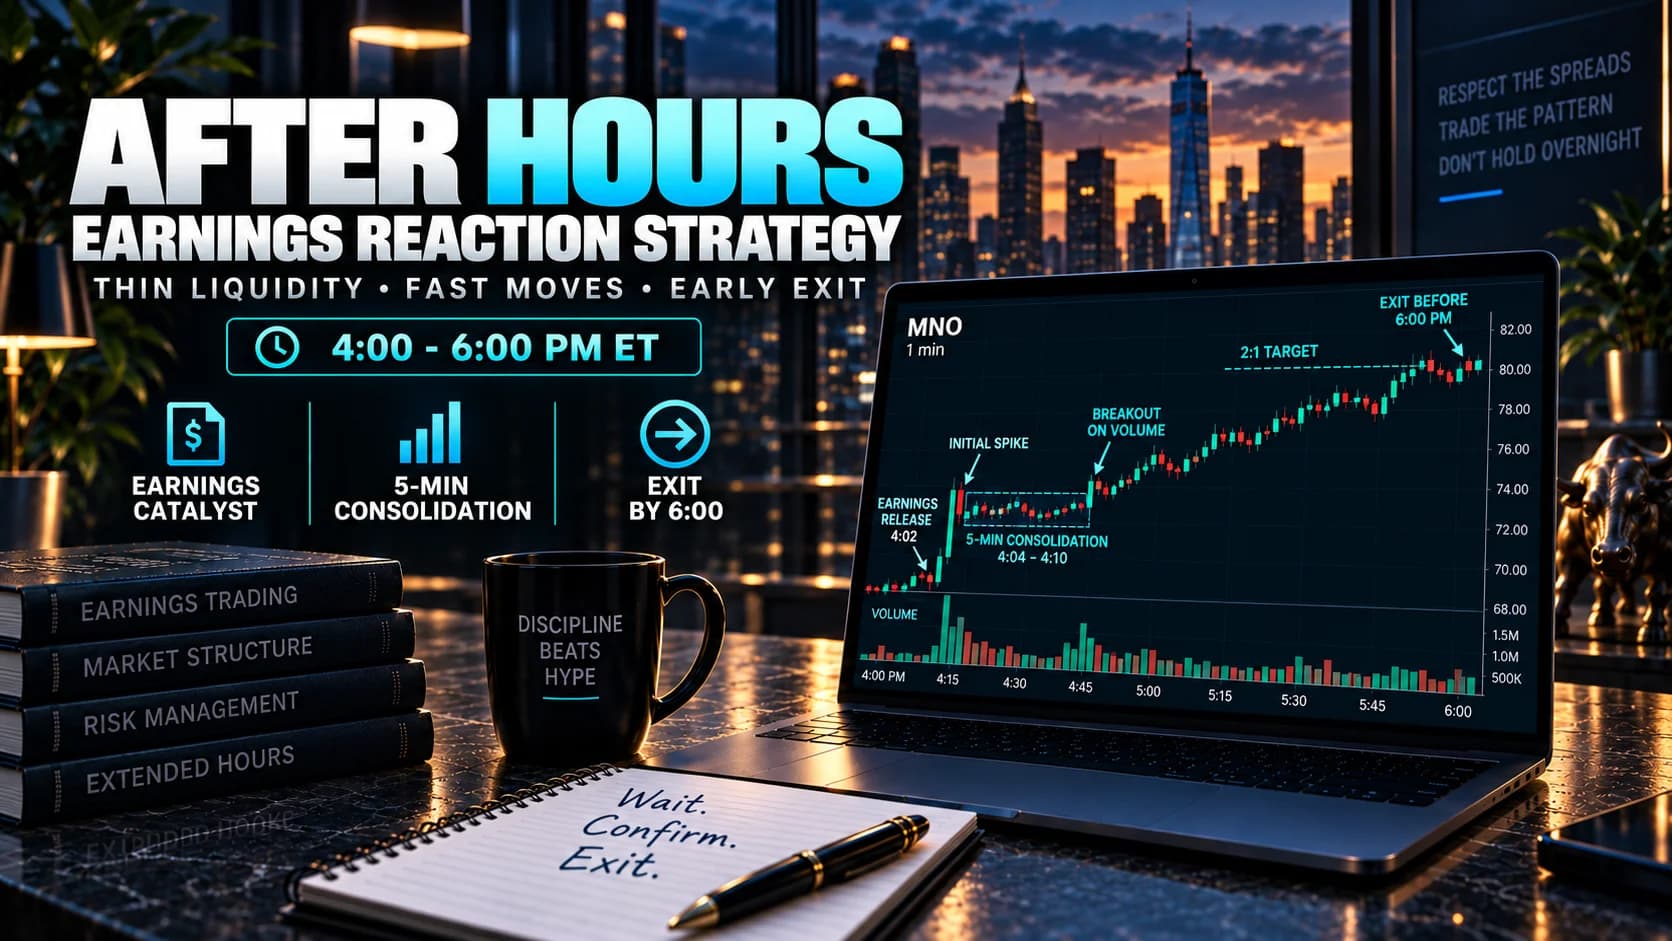
The After-Hours Trading Strategy: Risks, Setups, and When to Skip It
After-hours liquidity is even thinner than pre-market, and many earnings-driven pops fade by the next open. Learn the confirmed-breakout setup built for trading earnings reactions after the close.
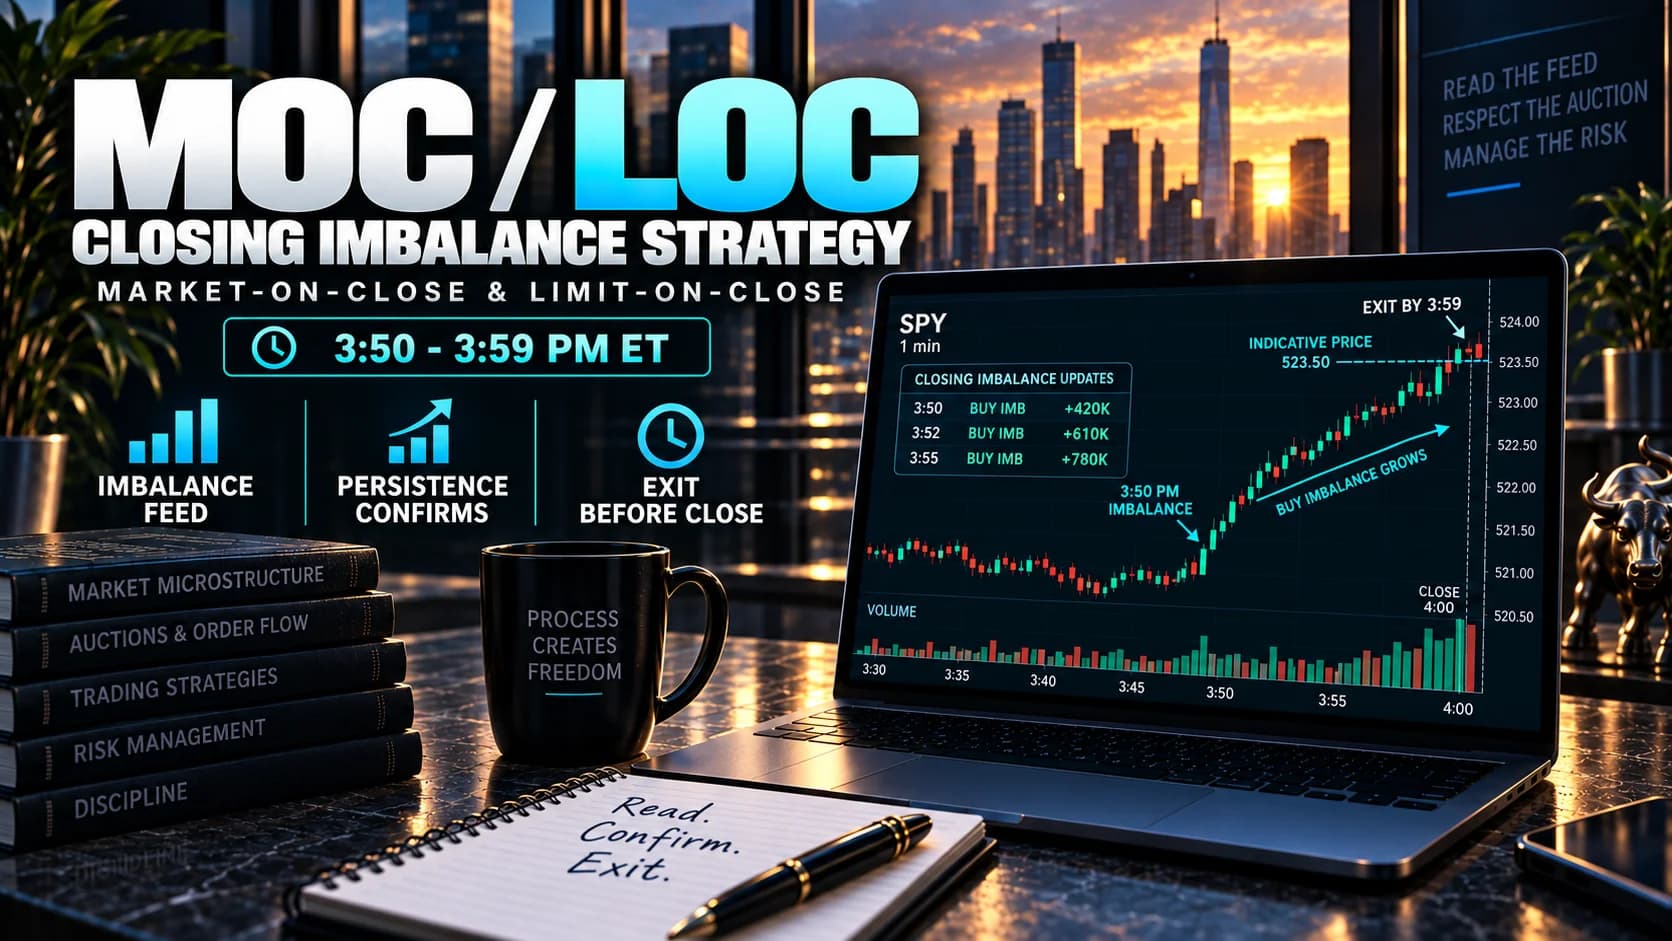
The Market-on-Close (MOC) and Limit-on-Close (LOC) Strategy
Exchanges publish live closing order imbalance data starting around 3:50 PM ET. Learn how MOC and LOC orders work, how to read the imbalance feed, and the setup built around it.
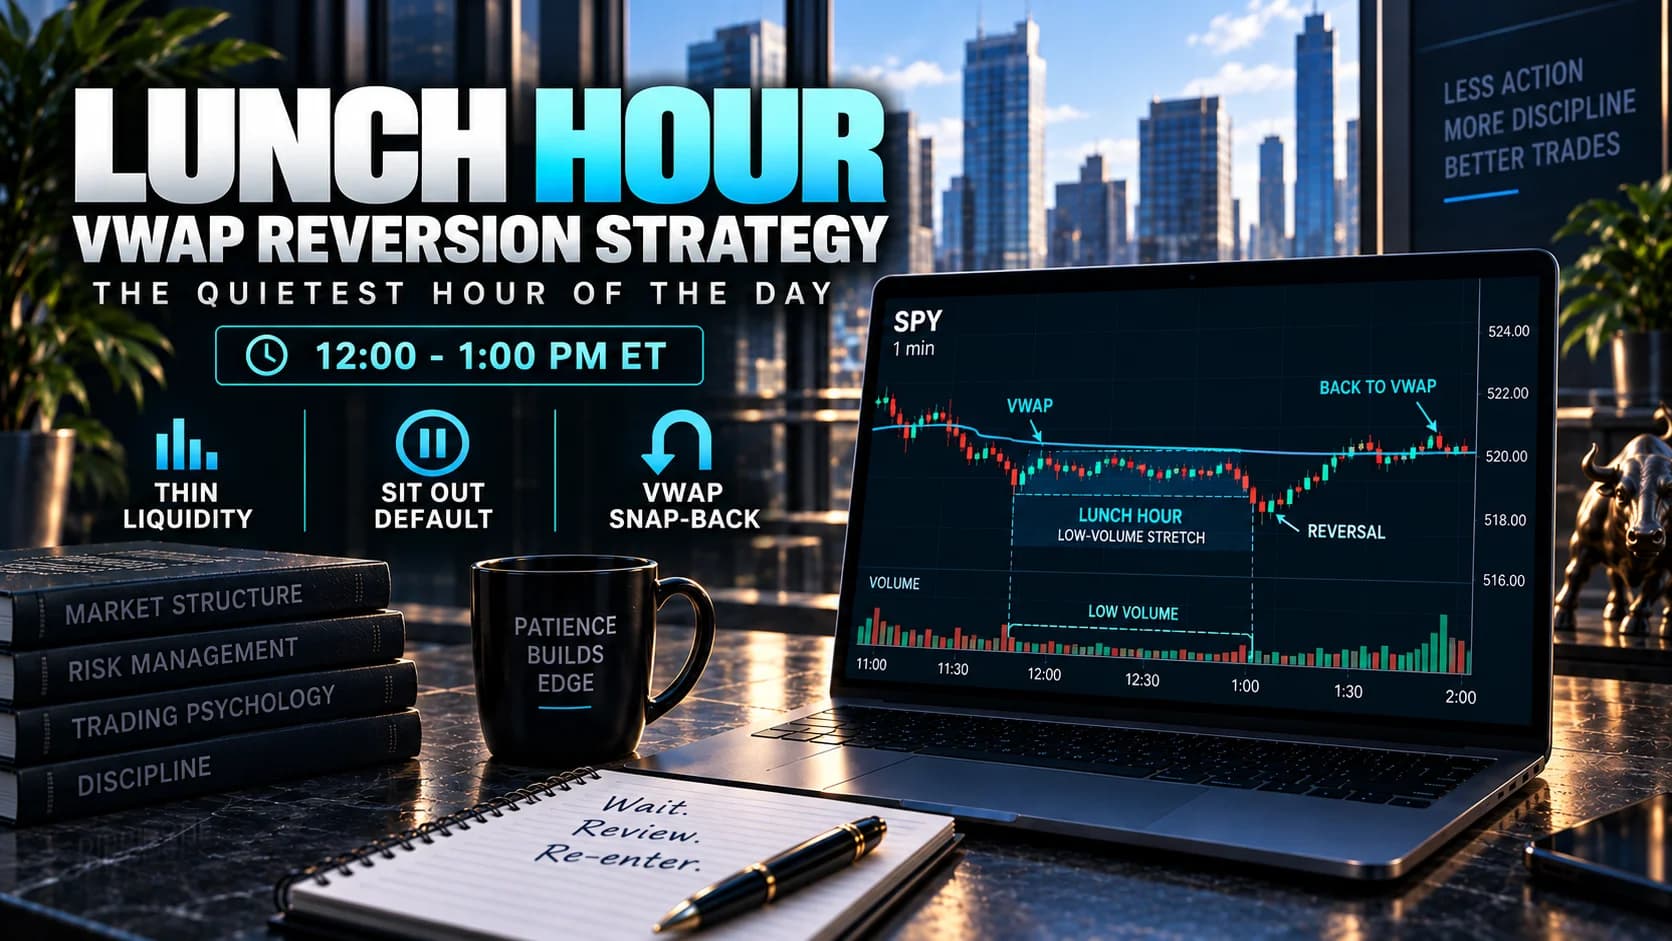
The Lunch Hour Trading Strategy: When to Sit Out (And When Not To)
Noon to 1 PM ET is the single quietest hour of the trading day. Learn why, the sit-out default that applies most days, and the narrow VWAP reversion setup for the rare exception.
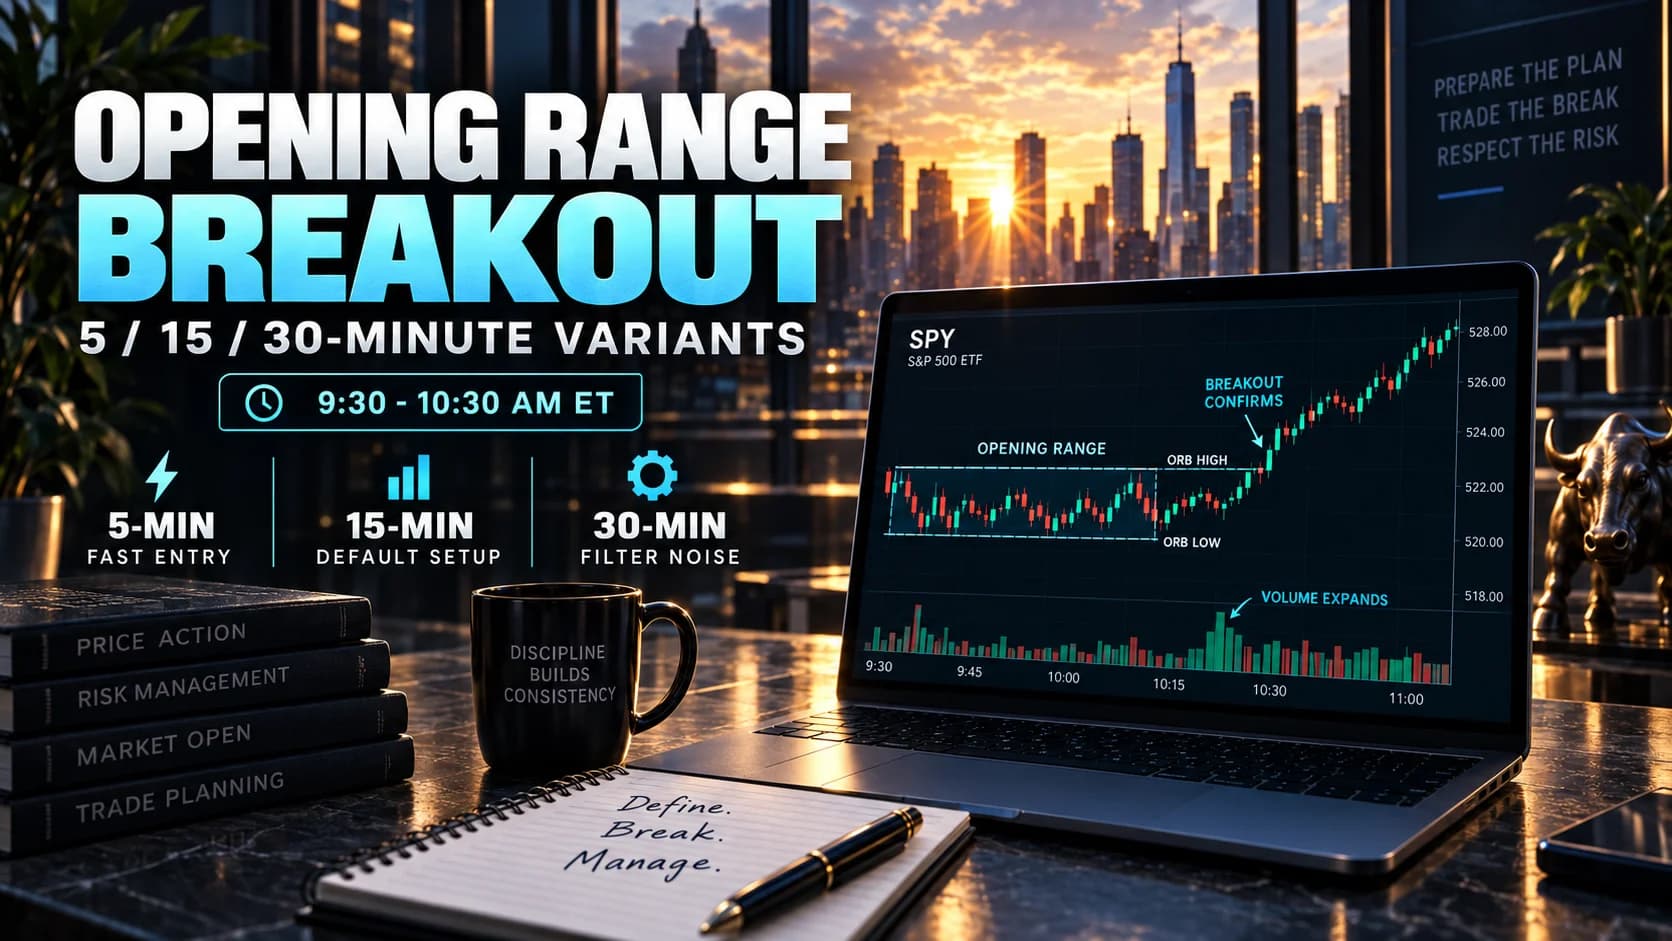
The Opening Range Breakout (ORB) Strategy: 5, 15, and 30 Minute Variants
The full breakdown of the Opening Range Breakout strategy across 5, 15, and 30-minute variants: which timeframe fits which stock, the mechanical setup specs, and where each one fails.
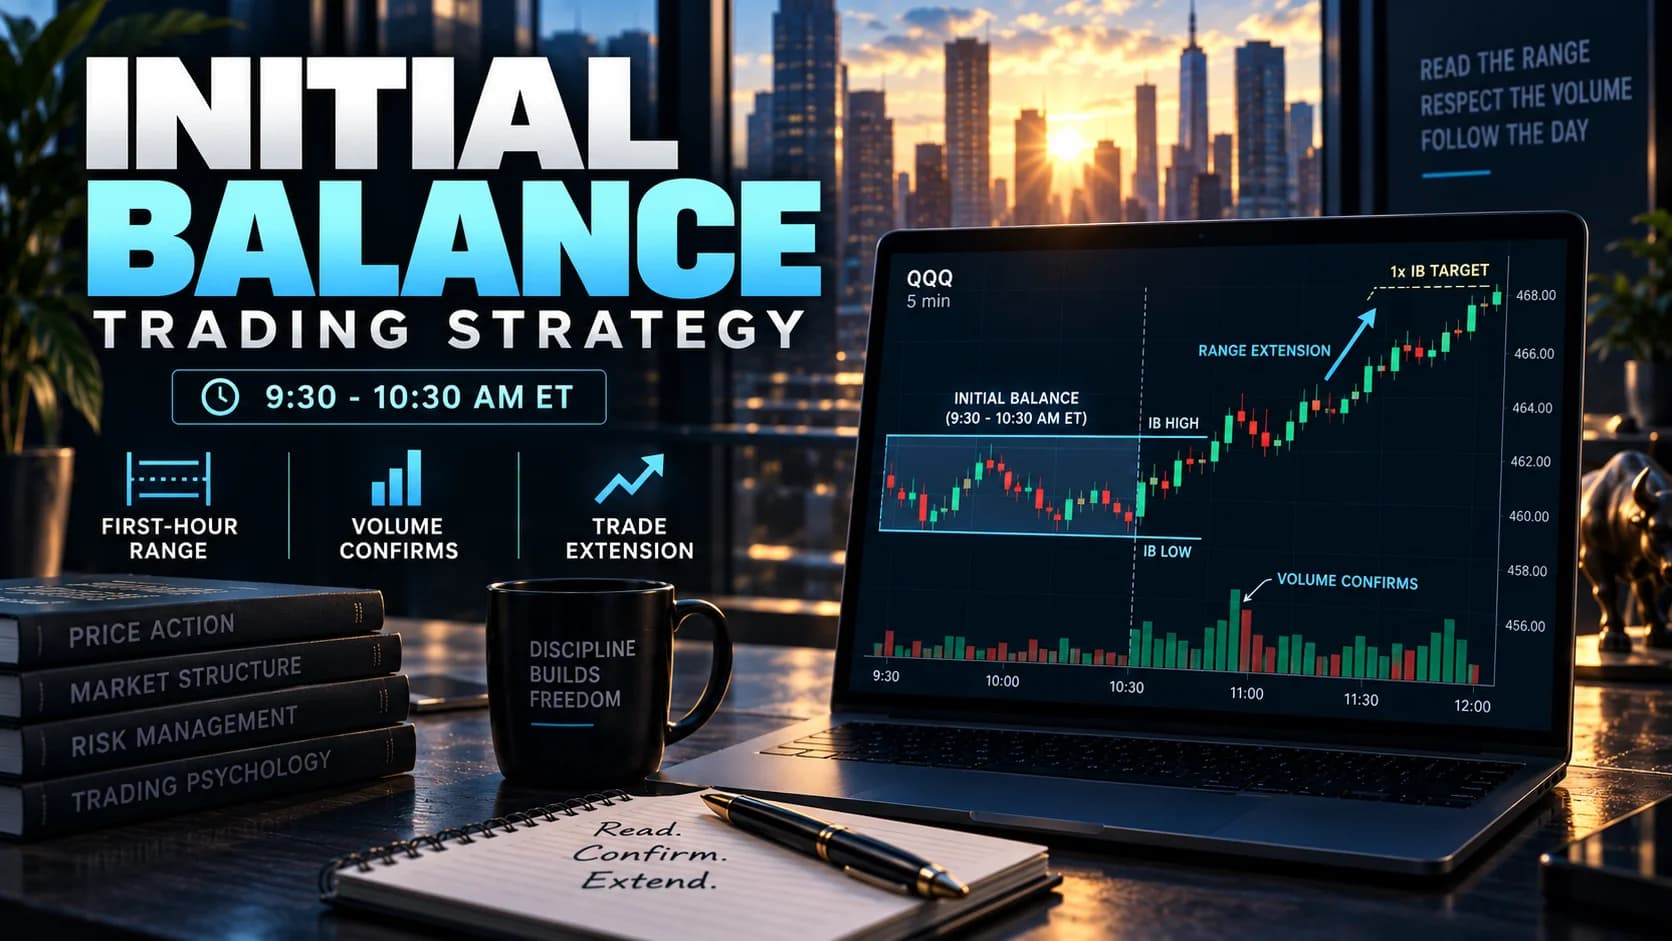
The Initial Balance (IB) Trading Strategy: First-Hour Edge
The first 60 minutes of trading set an Initial Balance that predicts the rest of the day more often than traders realize. Learn the day-type framework and the range extension setup built on it.
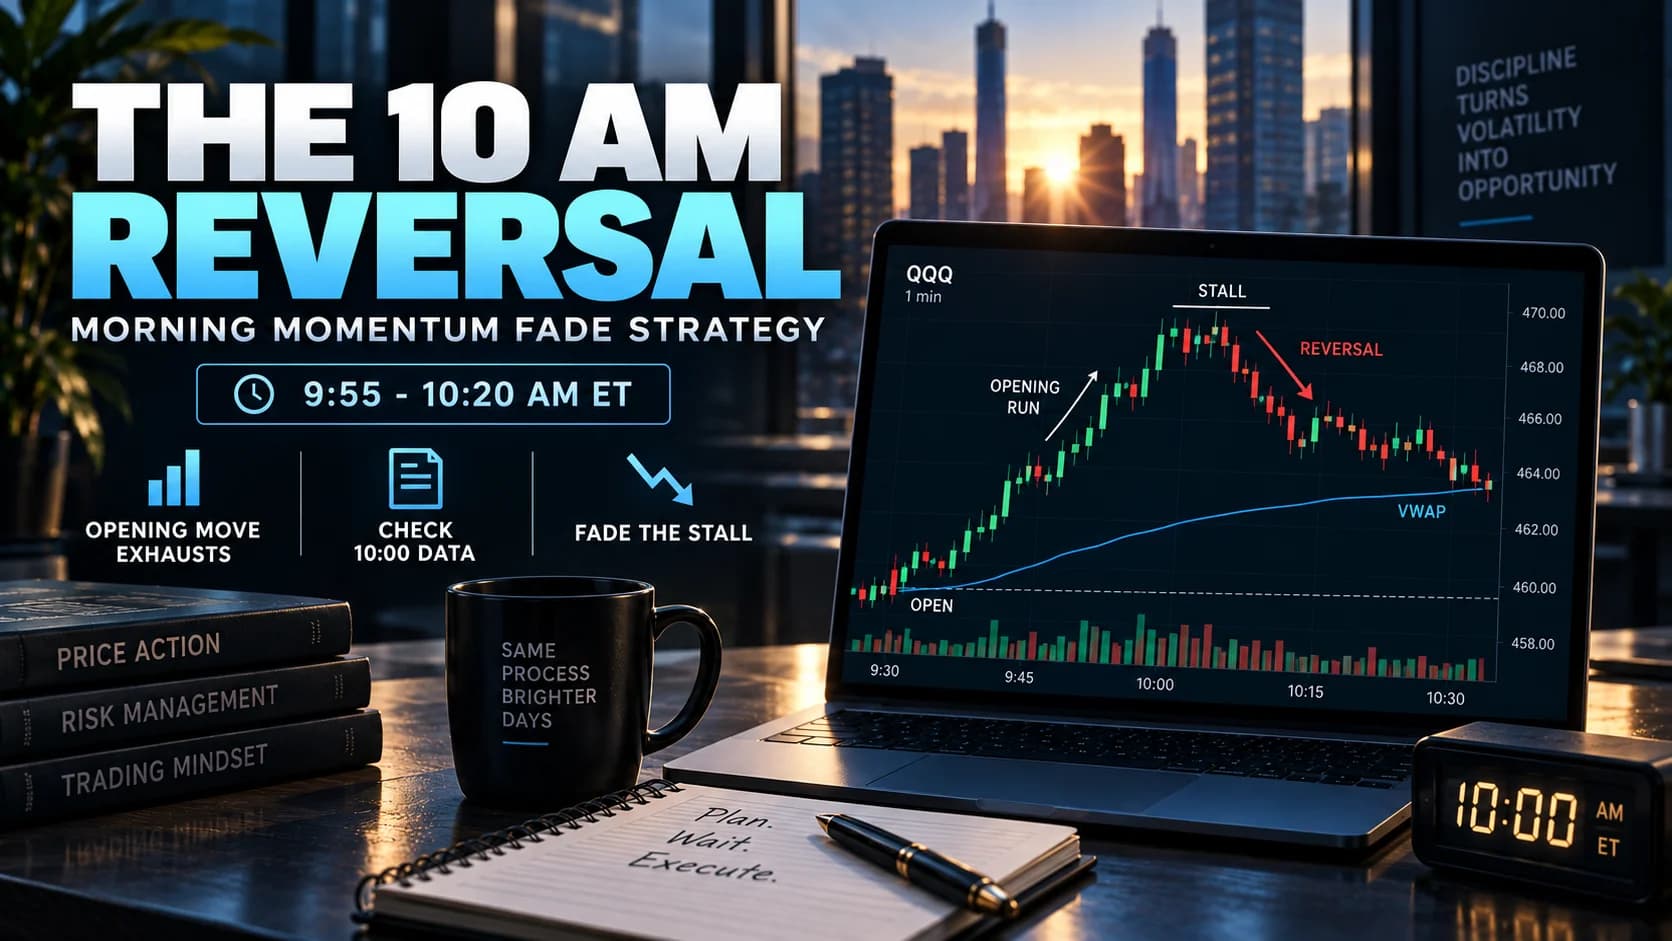
The 10 AM Reversal Strategy: Why the Hour Mark Matters
A stock's opening momentum often stalls and reverses right around 10:00 AM ET. Learn the two real forces behind it and the mechanical fade setup built to trade it.
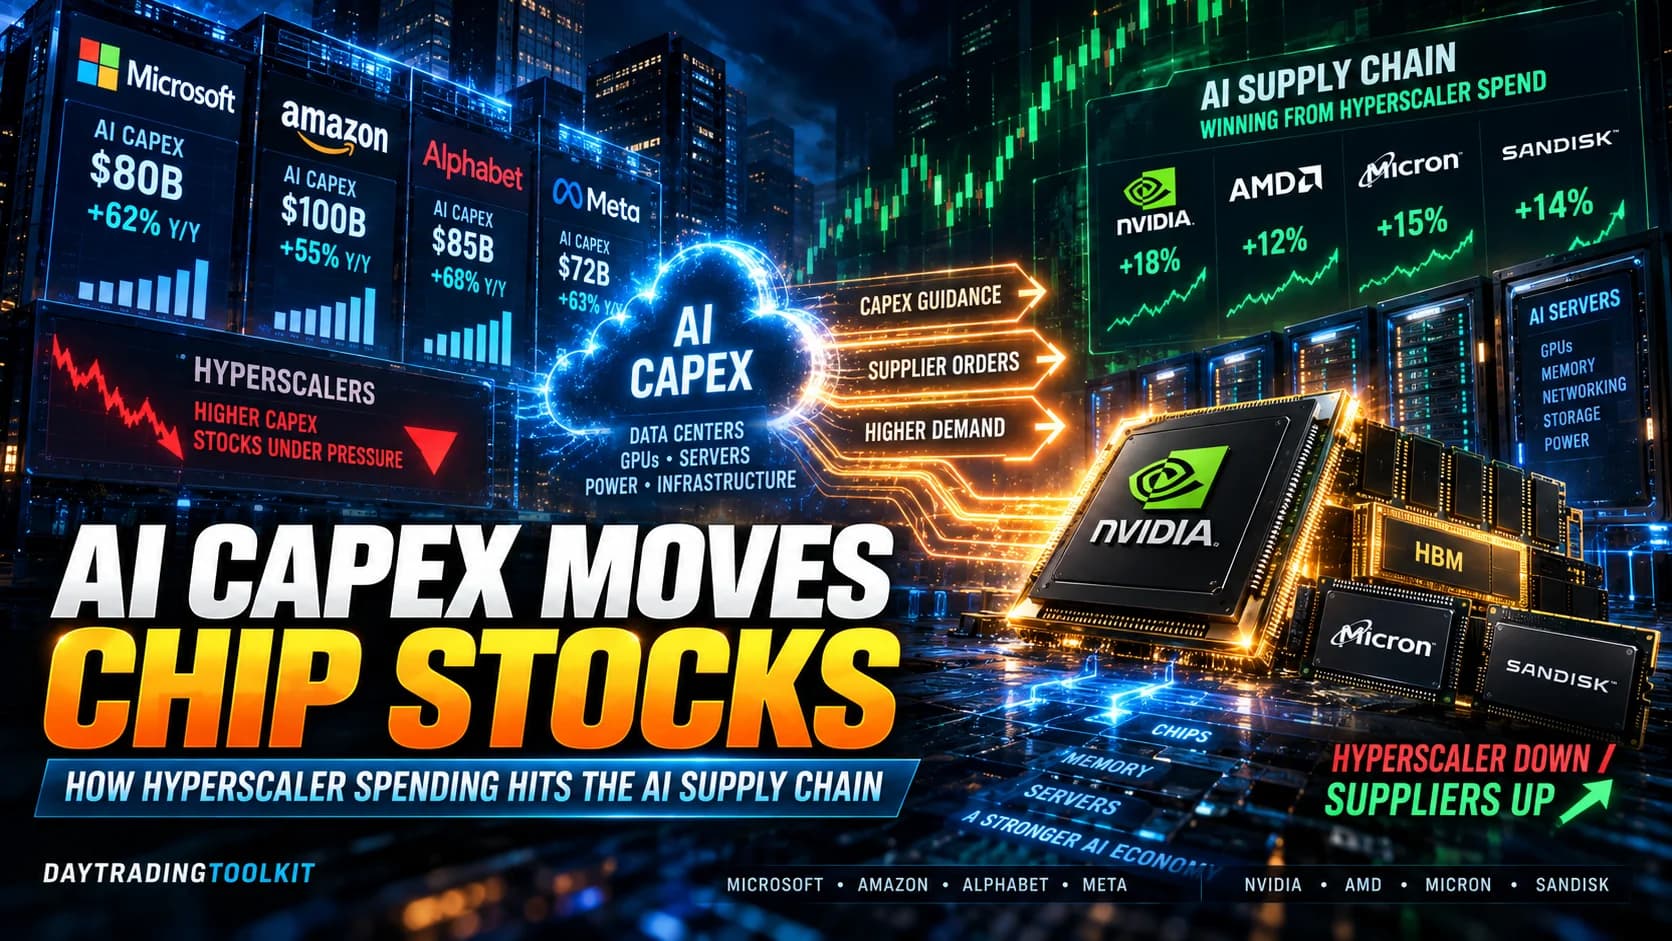
How AI Capex Disclosures Actually Move Chip and Memory Stocks
A hyperscaler's spending plan can sink its own stock and lift its suppliers on the same day. Here's the actual mechanism behind AI capex reactions, four real 2026 case studies, and how to trade the pattern.
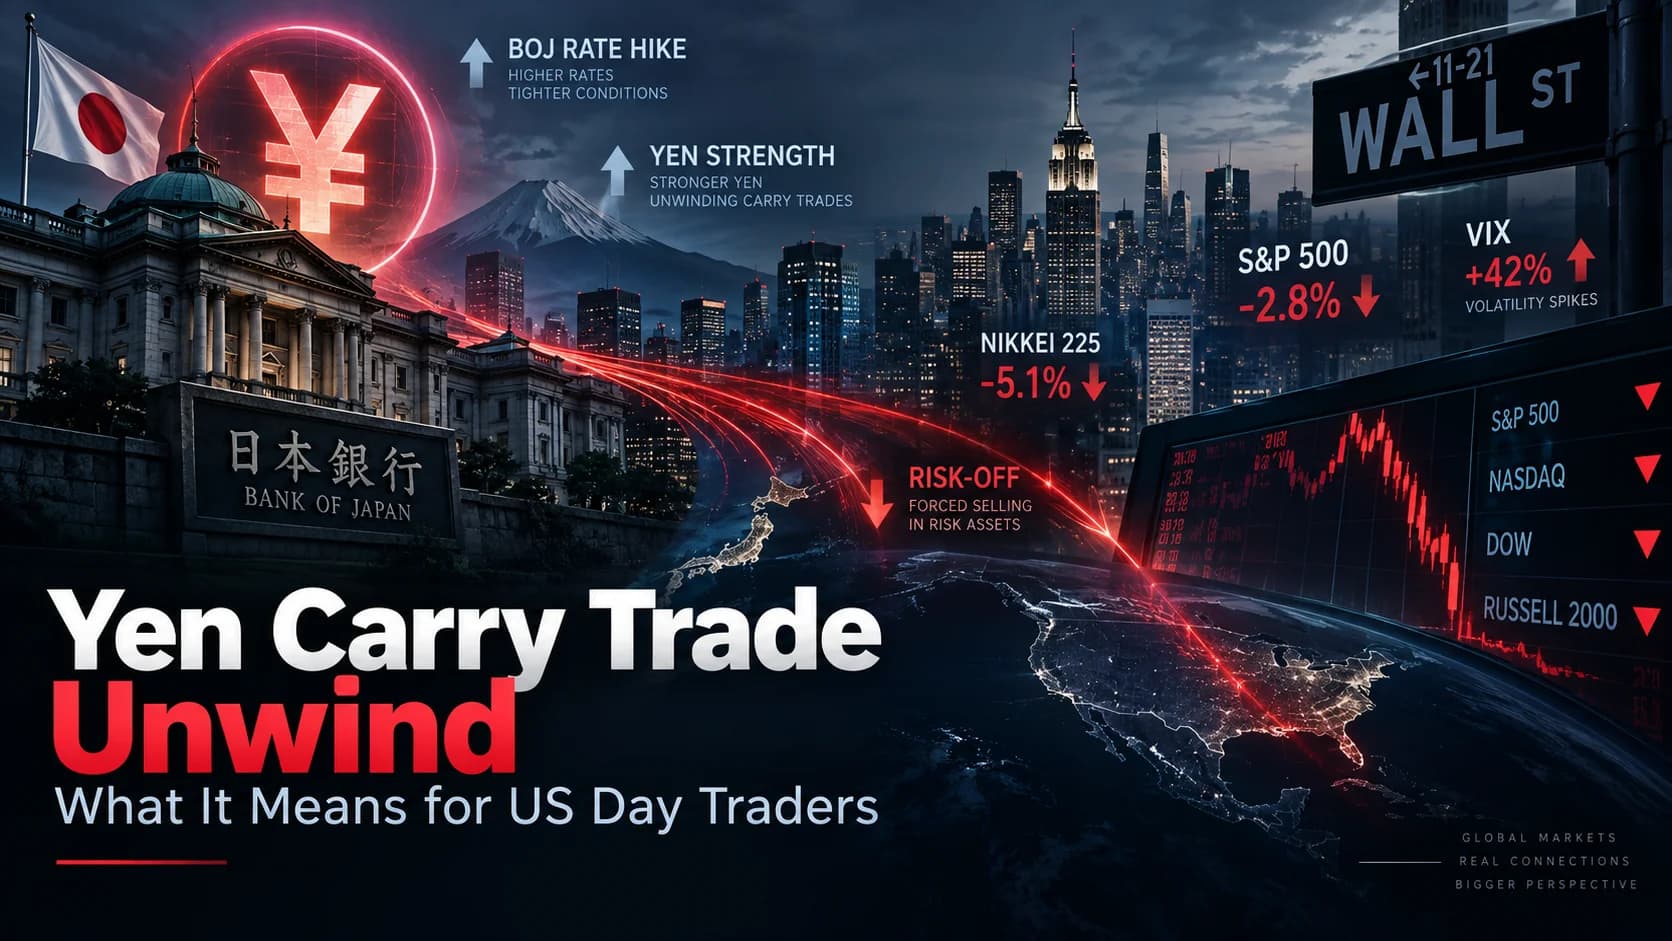
The Yen Carry Trade Unwind: What It Means for US Day Traders
A Bank of Japan rate hike smaller than a typical Fed move once dropped the S&P 500 3 percent in a day. The mechanism behind the August 2024 yen carry trade unwind, why it keeps recurring, and how to trade it.
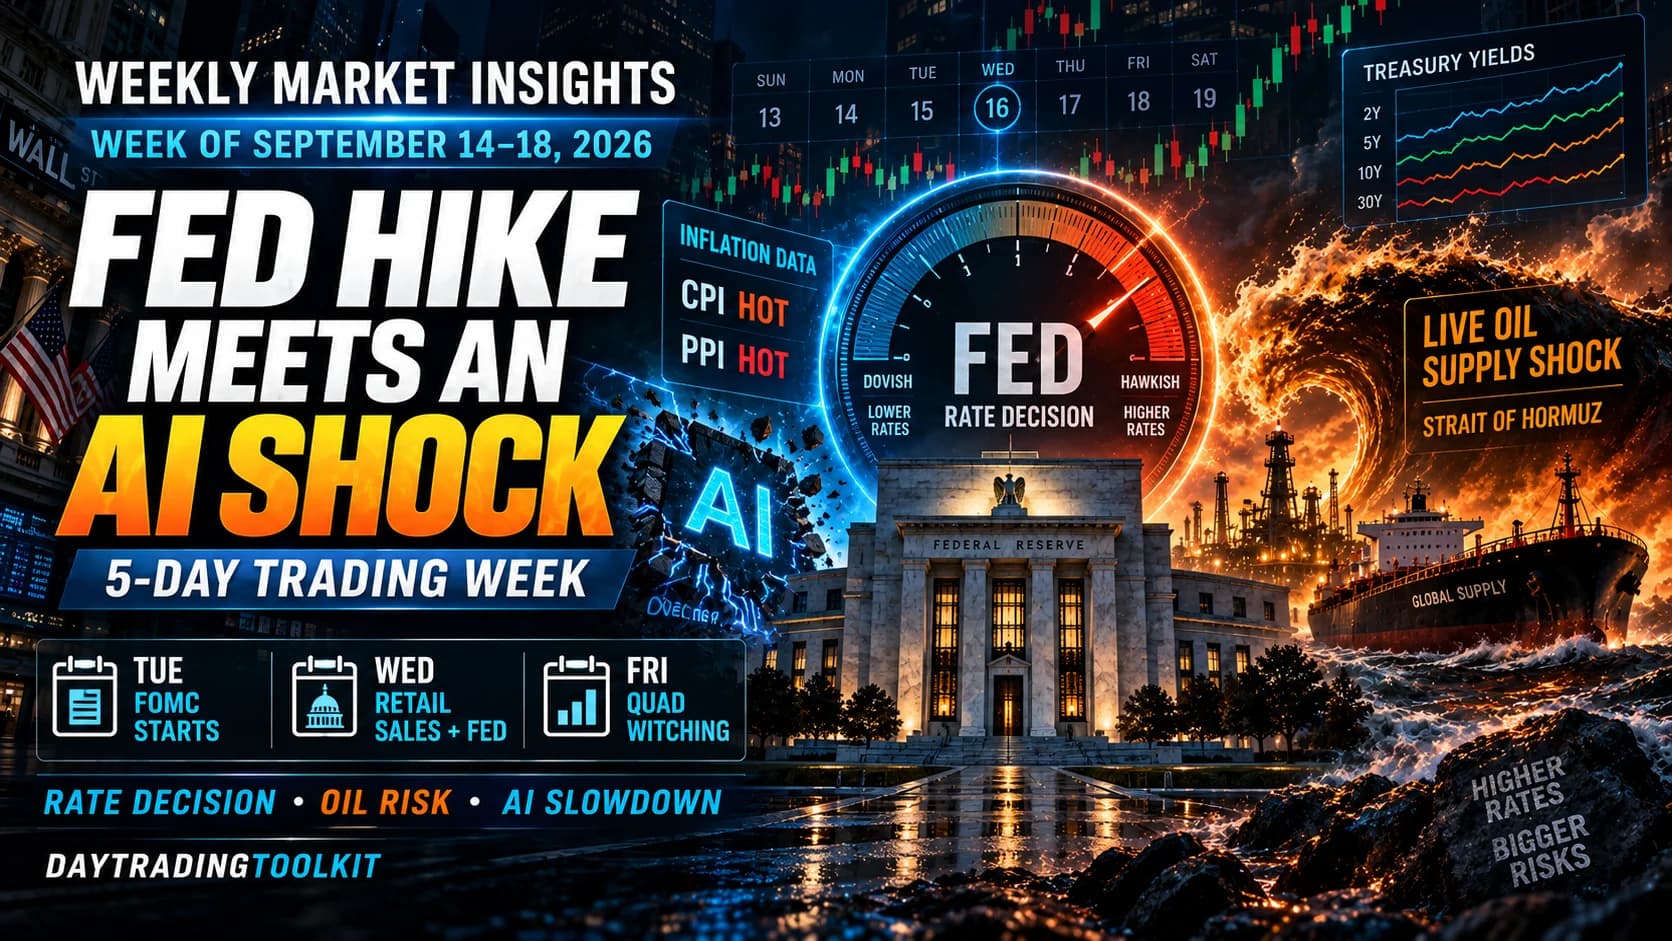
An AI Slowdown Call, a Live Fed Hike, and $108 Oil Collide in One Week: Weekly Market Insights, September 14-18
CME FedWatch has Wednesday's hike odds near 90 percent after a weekend AI slowdown call from Anthropic's CEO hit chip stocks, oil spiked past $107 on a Saudi pipeline shutdown, and Friday's quad witching sets up next Monday's S&P rebalance.

Tokenized Stocks Explained: What Day Traders Need to Know
Nasdaq, NYSE, and LSE are all building tokenized stock trading, while crypto exchanges already have live products. Here's the regulated-vs-synthetic distinction that actually matters, and what it means for your trading.

Where to Trade Tokenized Stocks Right Now (and What's Still Coming)
Crypto.com and KuCoin already have live tokenized stock products, but not for US traders. Here's exactly what's usable today, what NYSE, Nasdaq, and LSE are still building, and who each option actually fits.

Connecting Claude or ChatGPT to Your Brokerage Account (and Whether You Should)
Robinhood, Public, and eToro now let an AI agent place real trades, built on MCP, the same protocol behind Claude and ChatGPT's tool integrations. Here's how the connection actually works, what you're granting access to, and the documented security risks.

Robinhood vs. Public vs. eToro: Comparing Agentic Trading Platforms
Robinhood, Public, and eToro all let AI agents place real trades now, but the permission models are nothing alike. A feature-by-feature breakdown, plus why Interactive Brokers' approval-required approach deserves a serious look too.
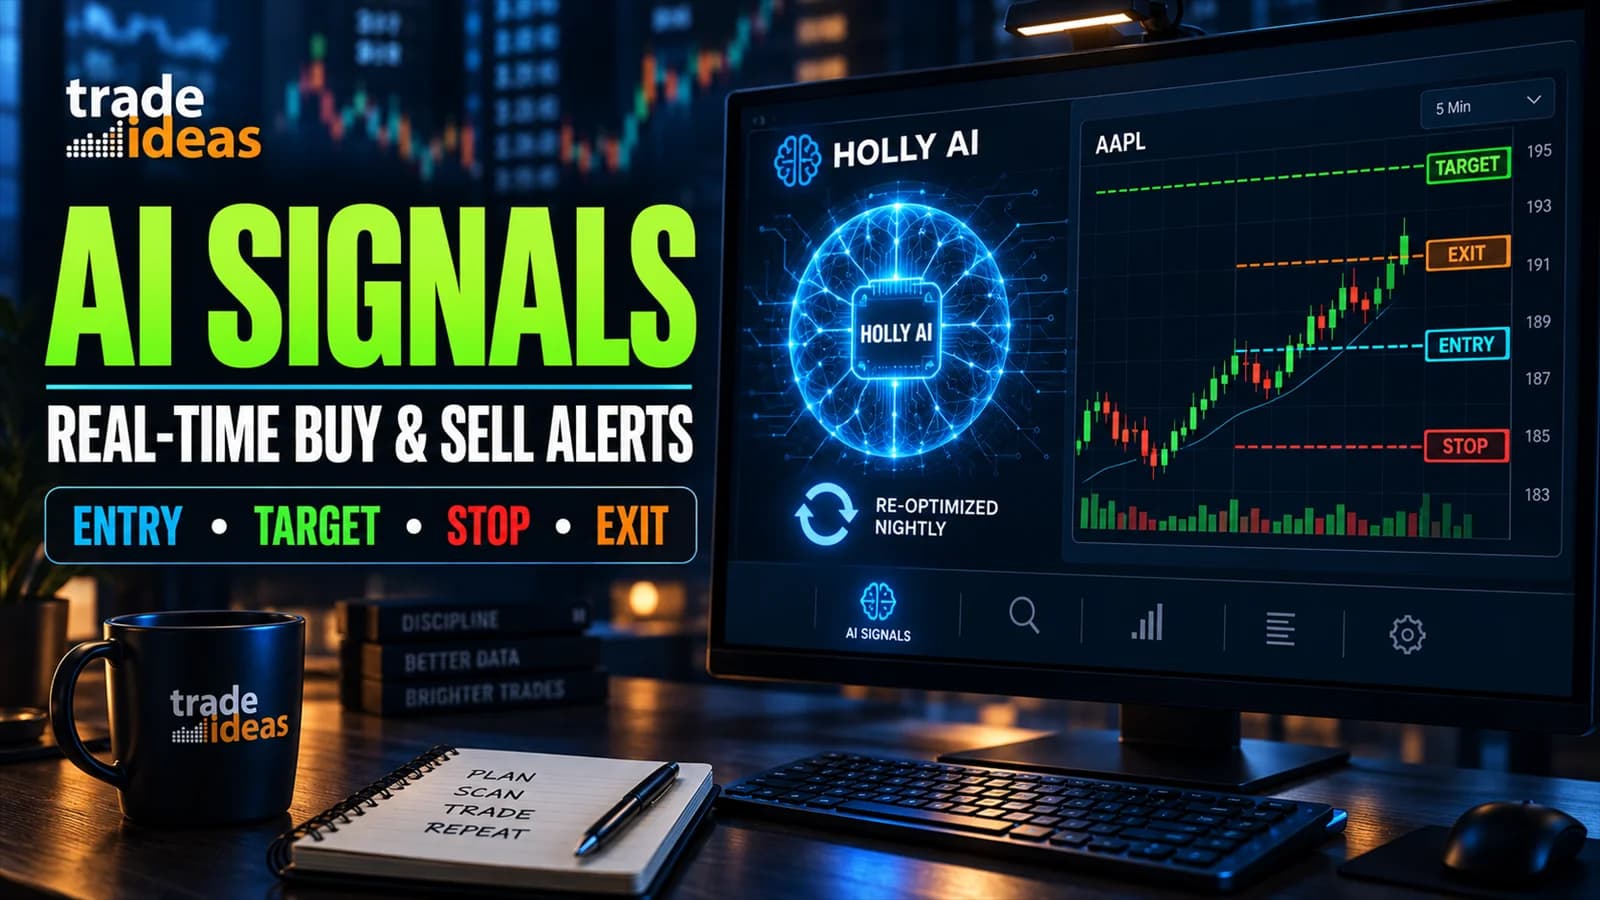
Trade Ideas AI Signals: Real-Time AI Buy & Sell Alerts
Trade Ideas AI Signals are real-time AI buy and sell alerts from the Holly engine, each with entry, exit, target, and stop guidance included. Here's what you get, which plan carries them, and how to start.
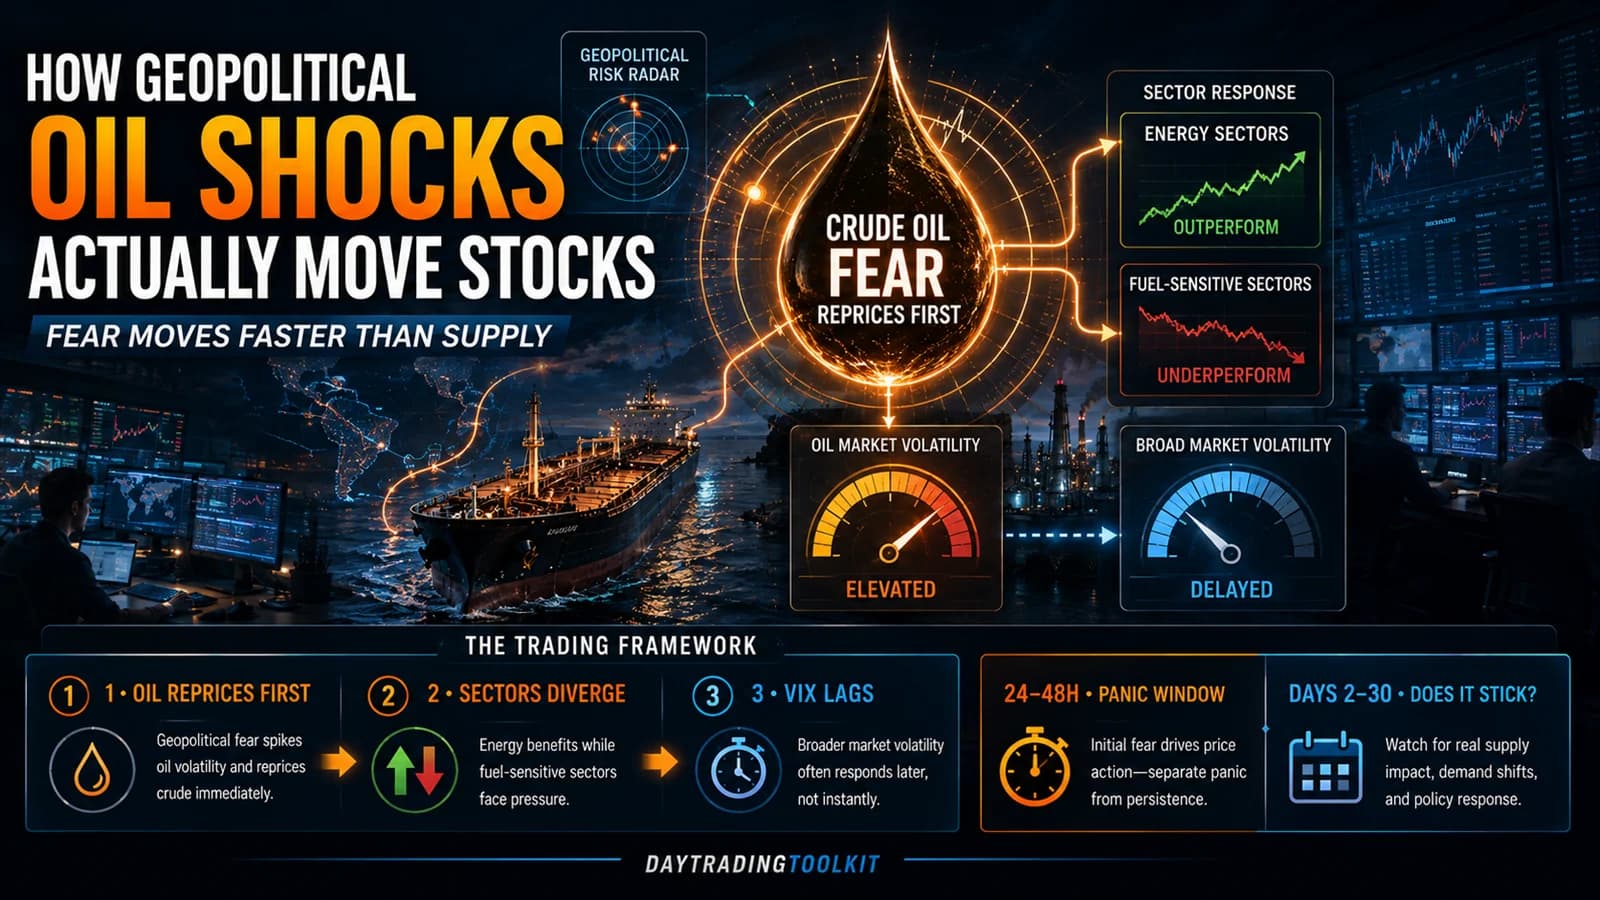
How Geopolitical Oil Shocks Actually Move Stocks
Oil spikes on fear, not fundamentals, and equities take their cues later on a different clock. Here's the actual mechanism behind a geopolitical oil shock, four historical case studies, and how to trade the pattern without guessing what happens next.
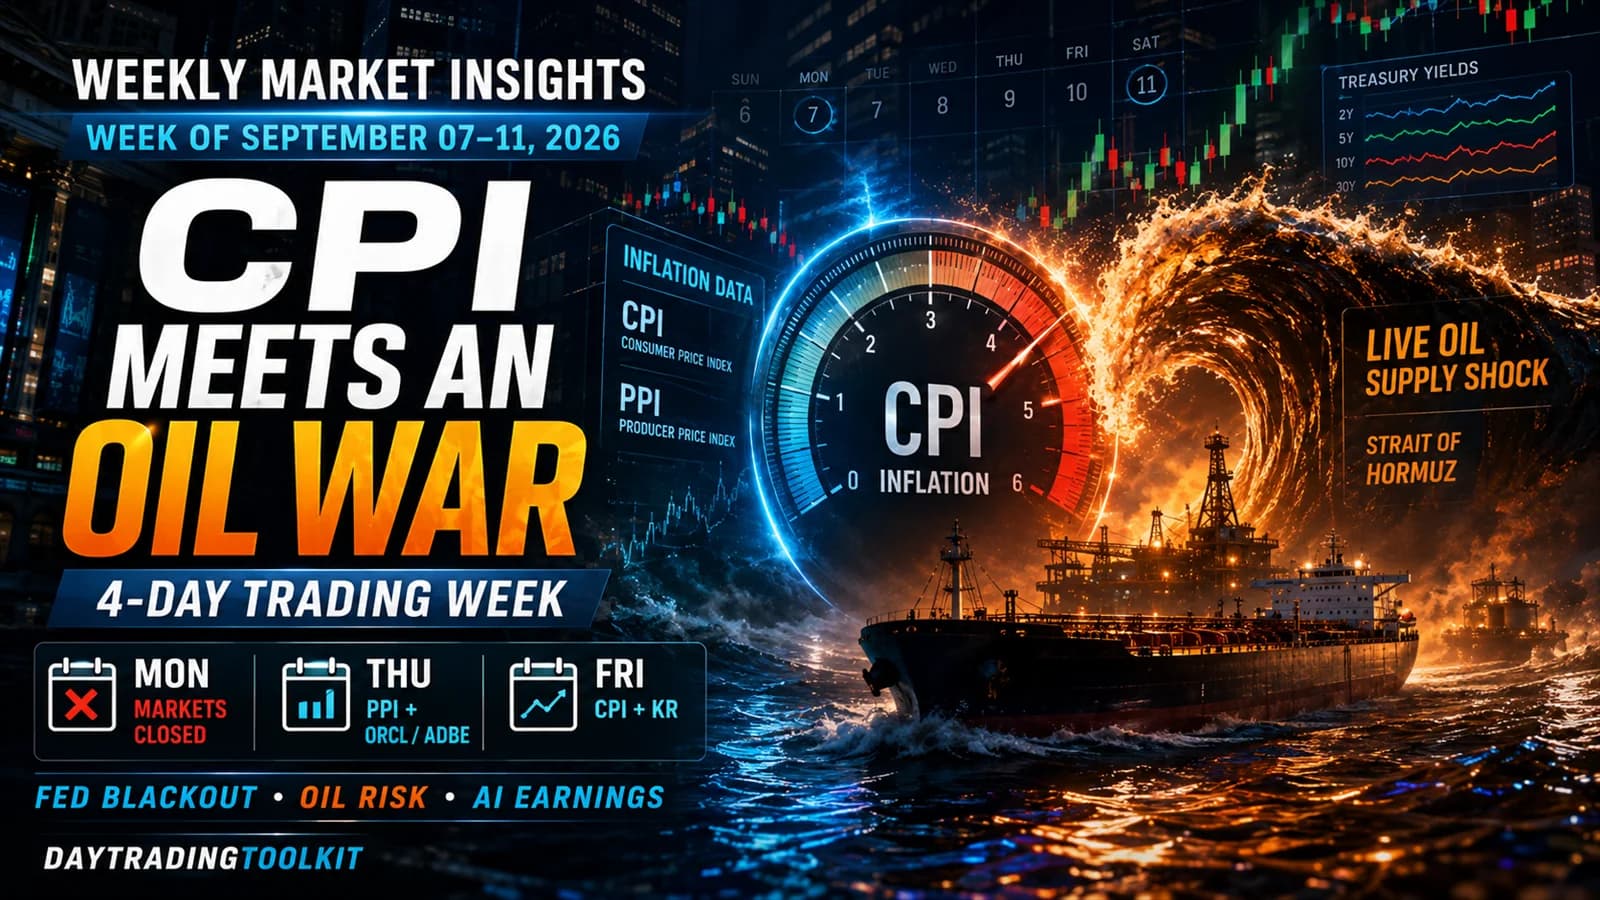
Two Wars, a Trade Fight, and CPI Still Has to Land Clean: Weekly Market Insights, September 7-11
A blowout jobs report already pushed rate-hike odds above 58%. Now a widening Middle East war and a new US-Canada trade fight collide with the last inflation data before the Fed's September 15-16 decision, while Nokia, Compass Pathways, Qualcomm, and Amgen all move on stories the calendar never saw coming.
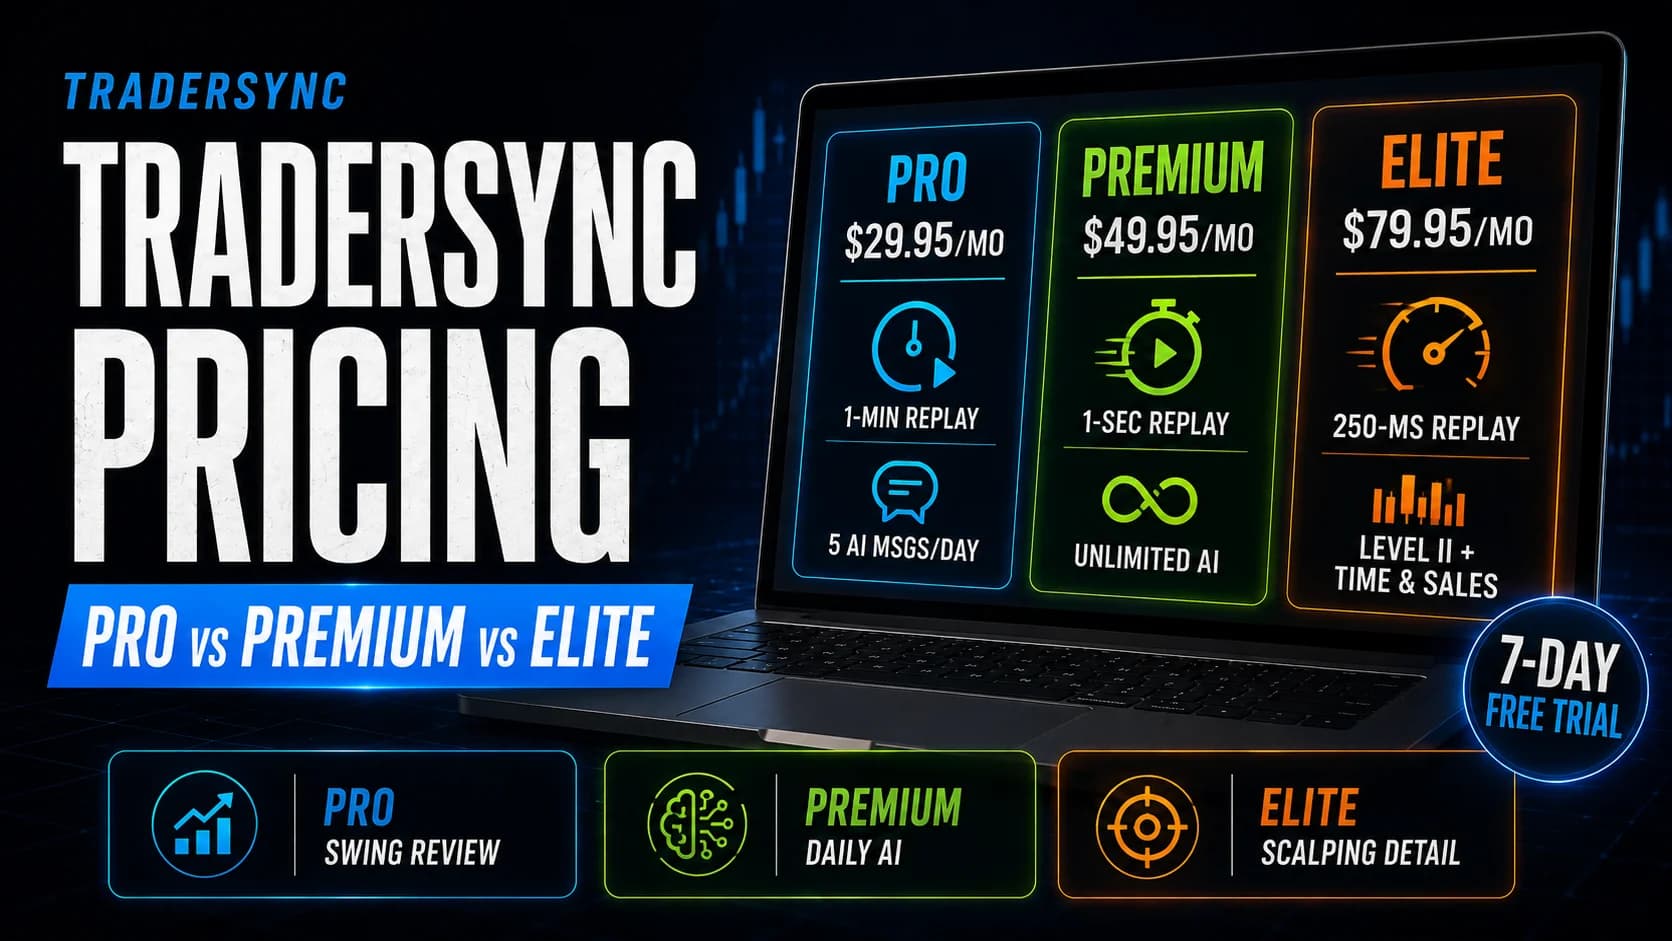
TraderSync Pricing Explained: Pro vs. Premium vs. Elite
TraderSync's three tiers look like more-of-the-same feature bumps. They're actually gated around two things, replay precision and AI access, and which side of that gate you need determines your real cost.
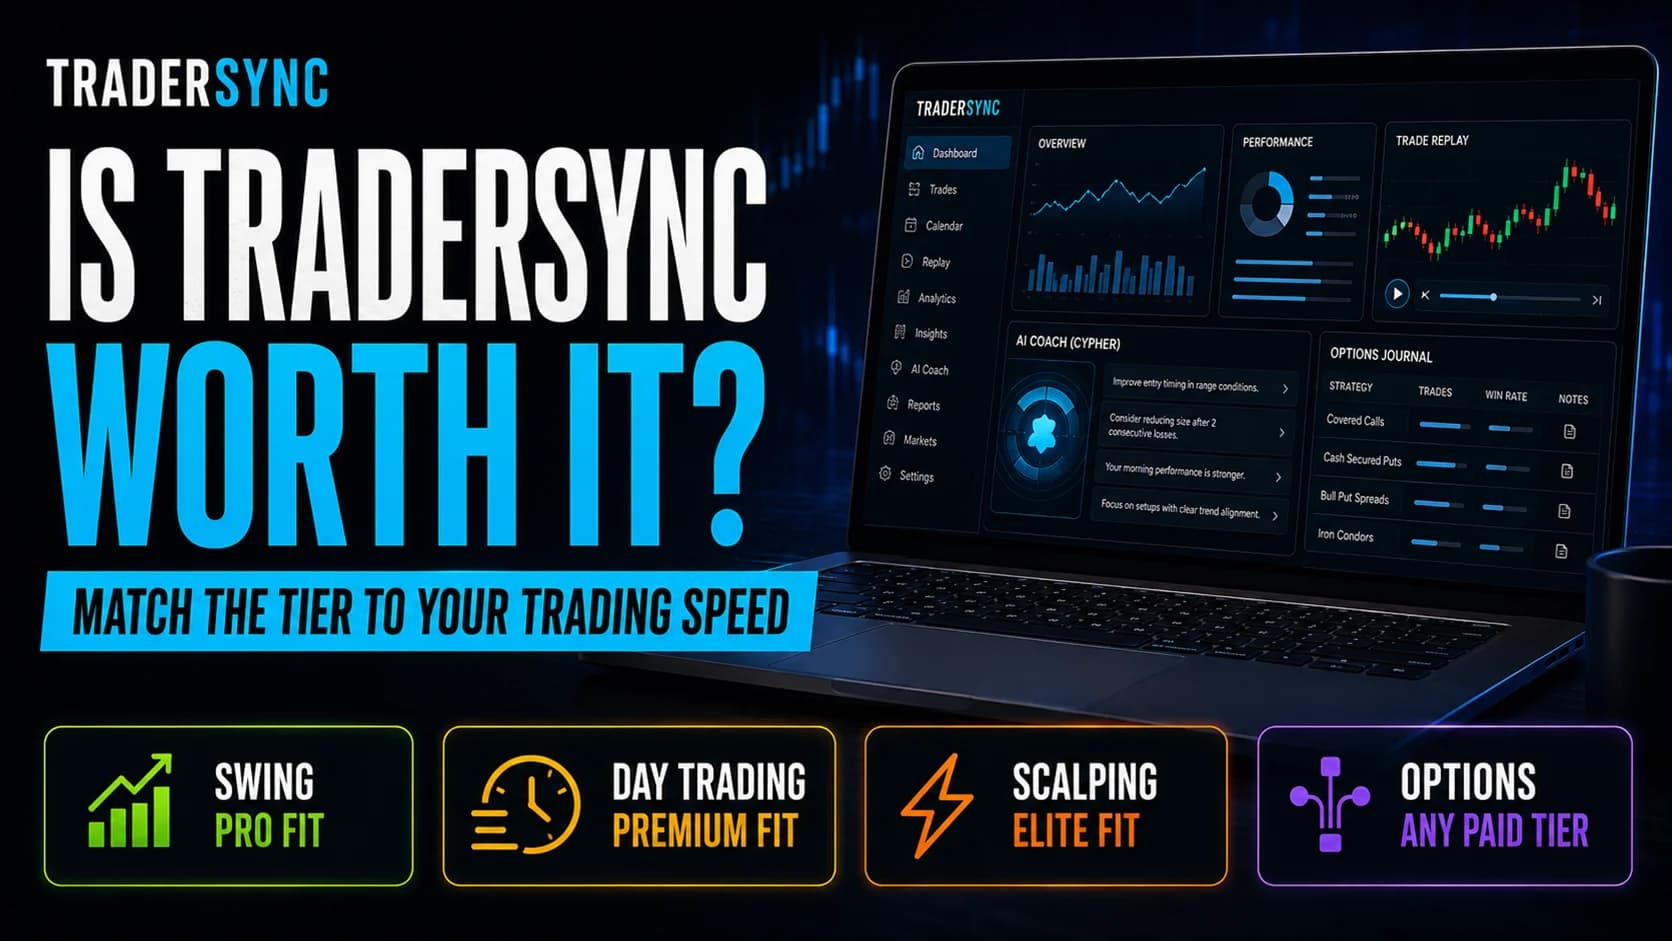
Is TraderSync Worth It for Your Trading Style?
A swing trader and a scalper are looking at the same TraderSync pricing page. One of them needs Pro. The other is underserved by anything less than Elite. Here's the breakdown by trading style, not one blanket verdict.
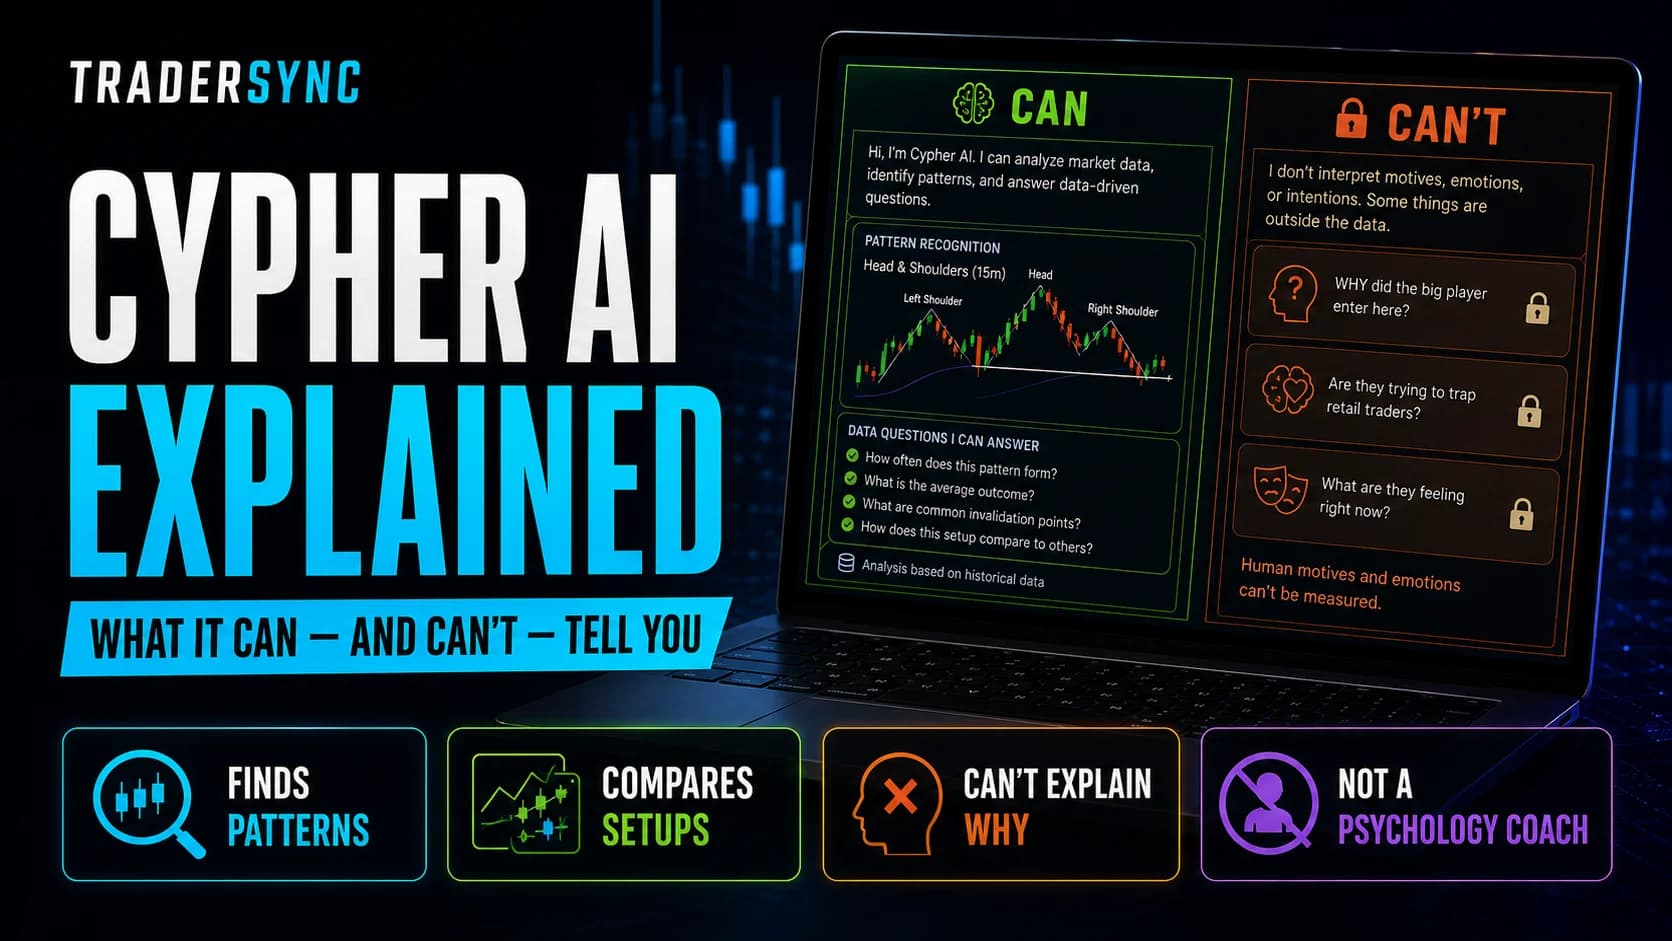
Cypher AI Explained: What TraderSync's AI Coach Can (and Can't) Tell You
Cypher AI can tell you your losing trades average a 40-minute hold. It can't tell you why you kept holding. Here's the honest line between what TraderSync's AI coach actually does and what it only sounds like it does.
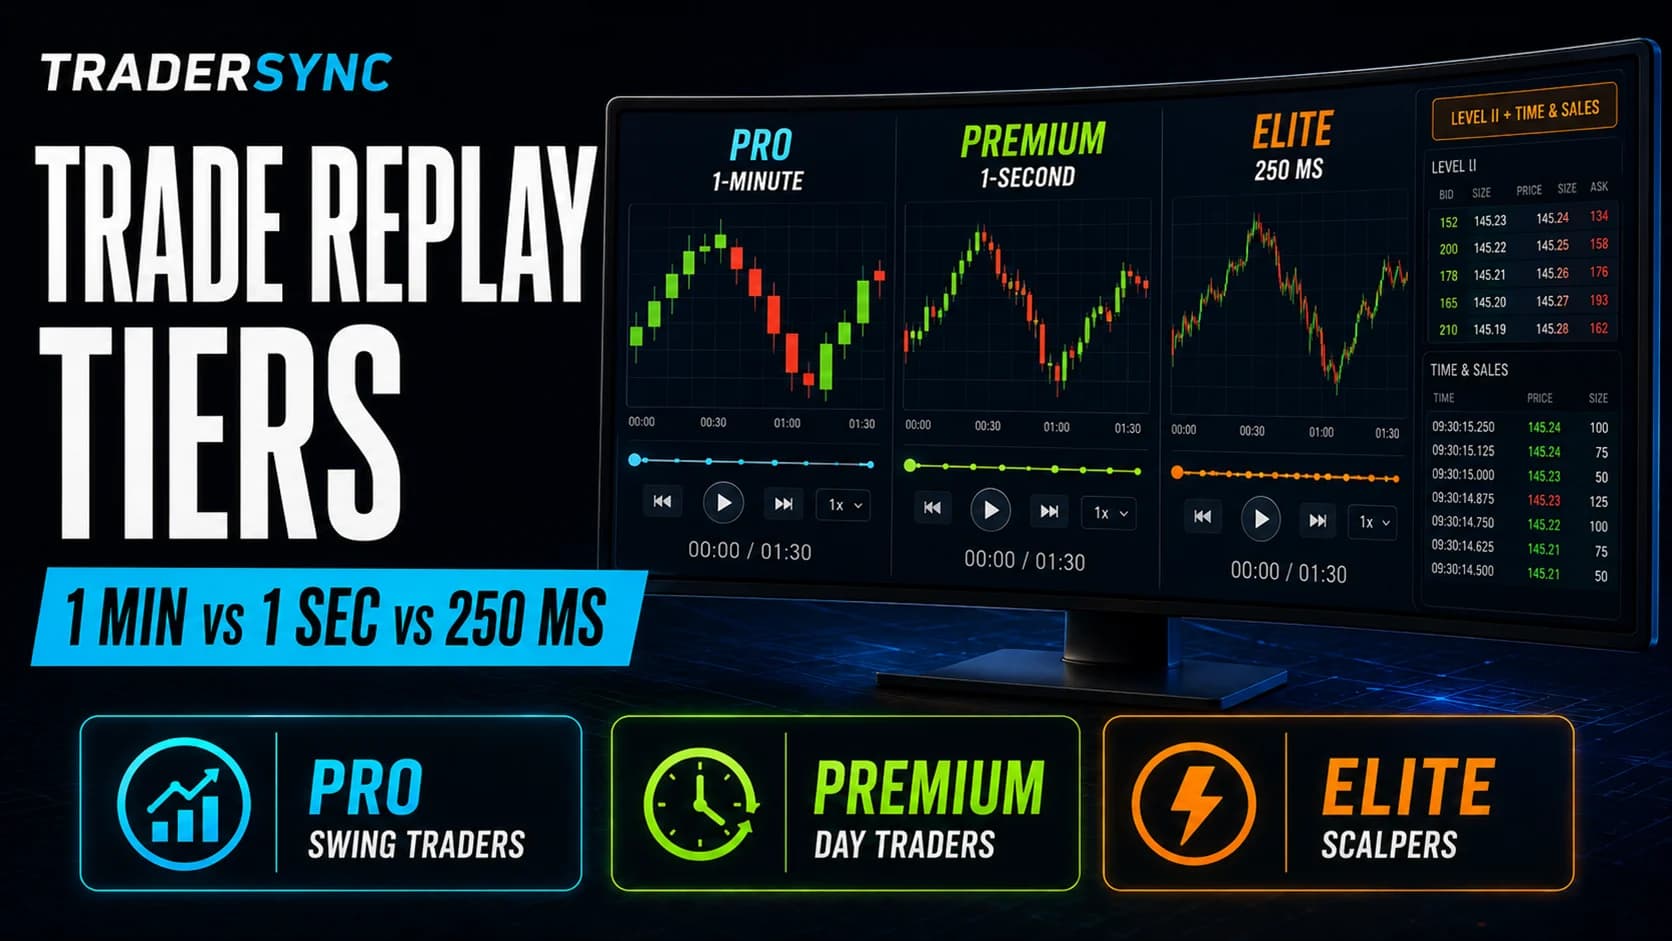
TraderSync Trade Replay: How the 250ms, 1-Second, and 1-Minute Tiers Actually Differ
A 1-minute candle and a 250-millisecond replay of the same 90 seconds show you two almost unrelated things. Here's what each of TraderSync's three replay tiers actually reveals, and which one matches your trading speed.
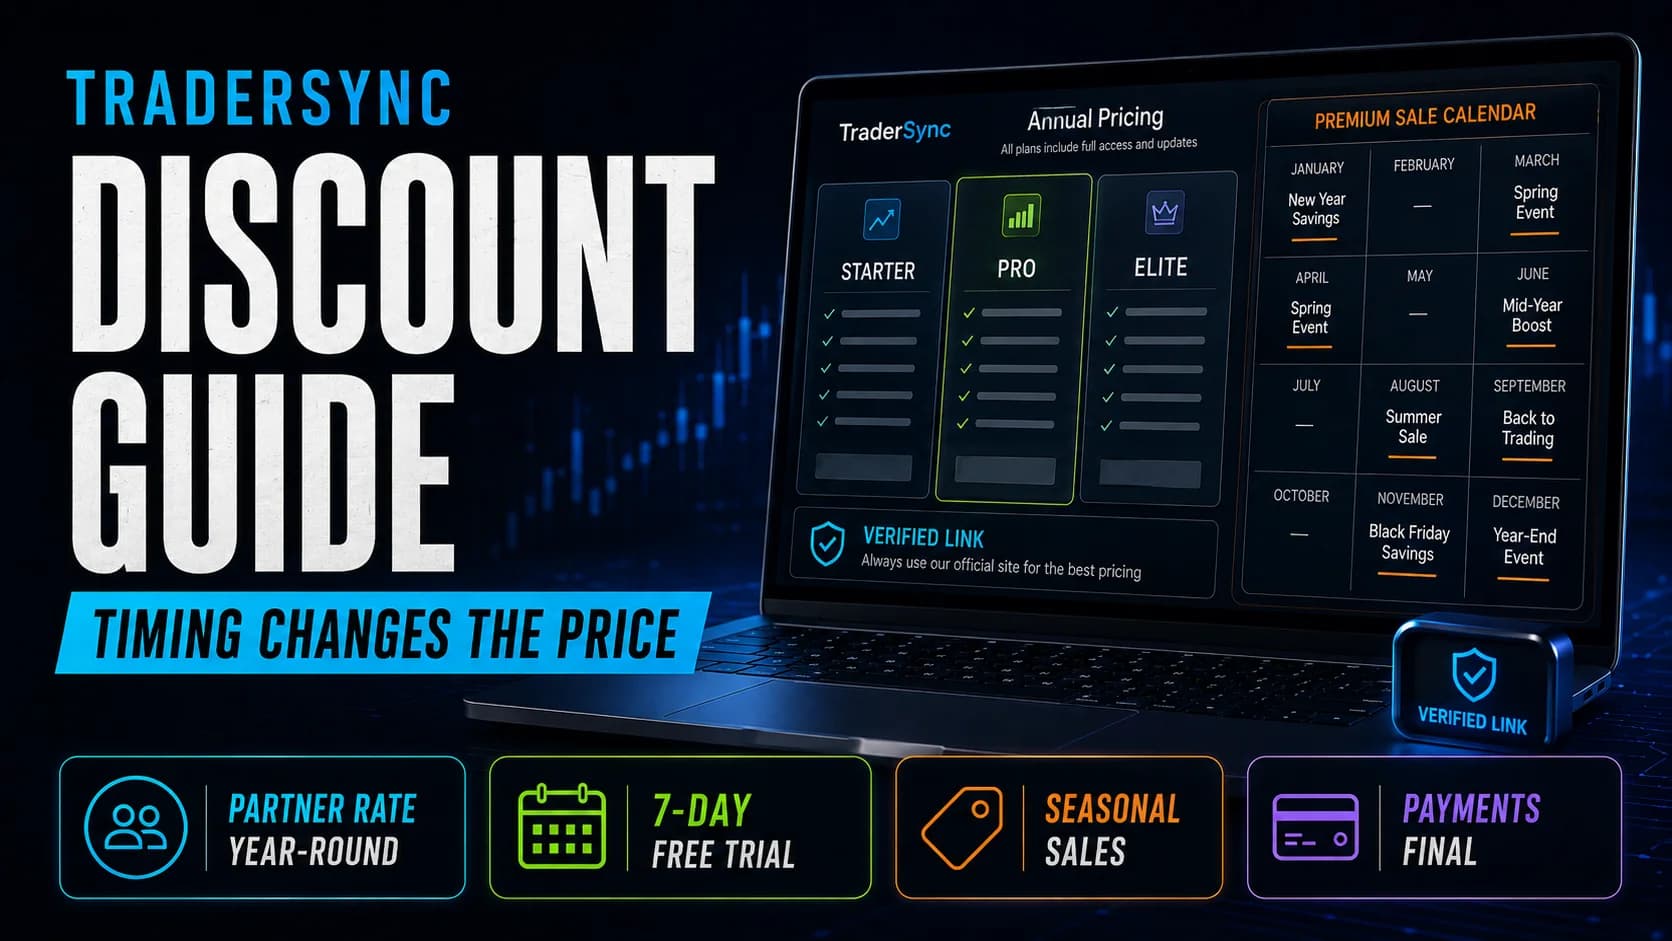
TraderSync Discount & Promo Code Guide
TraderSync's standing discount is about 15% off annual billing. Time it around Black Friday or Labor Day instead, and the same plan can drop 60% or more, especially on Elite. Here's the real sale calendar.
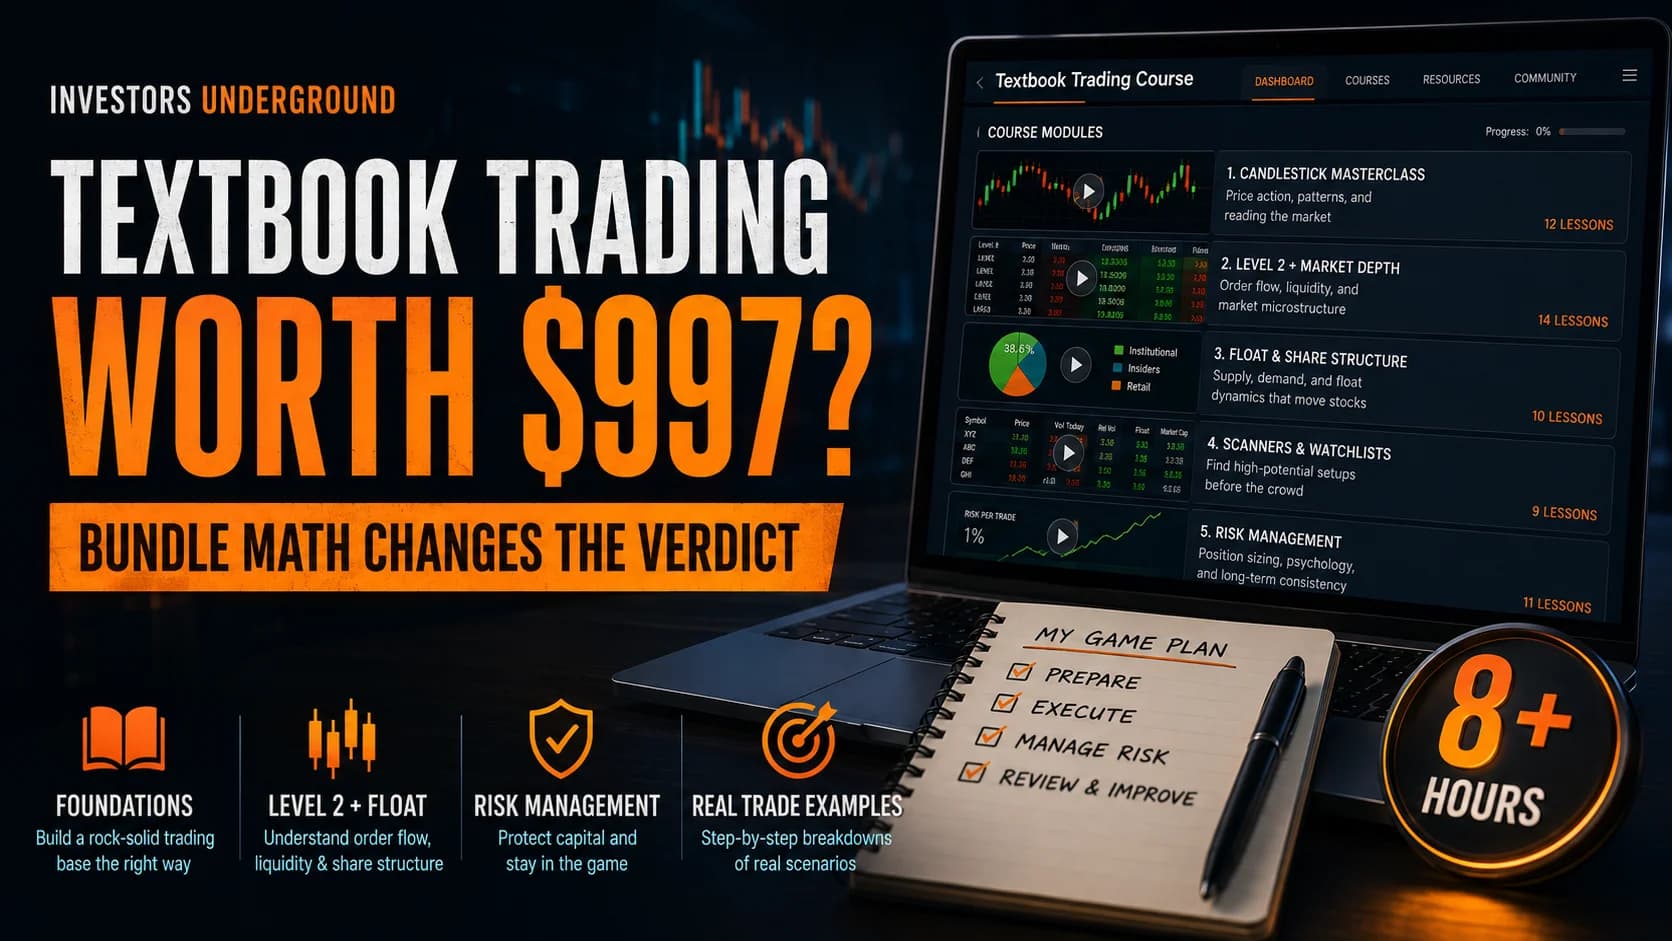
Is Investors Underground's Textbook Trading Course Worth $997?
Textbook Trading costs $997 standalone, or effectively almost nothing extra inside the course bundle. Those are two completely different purchases wearing the same course title, and the math changes which one makes sense.
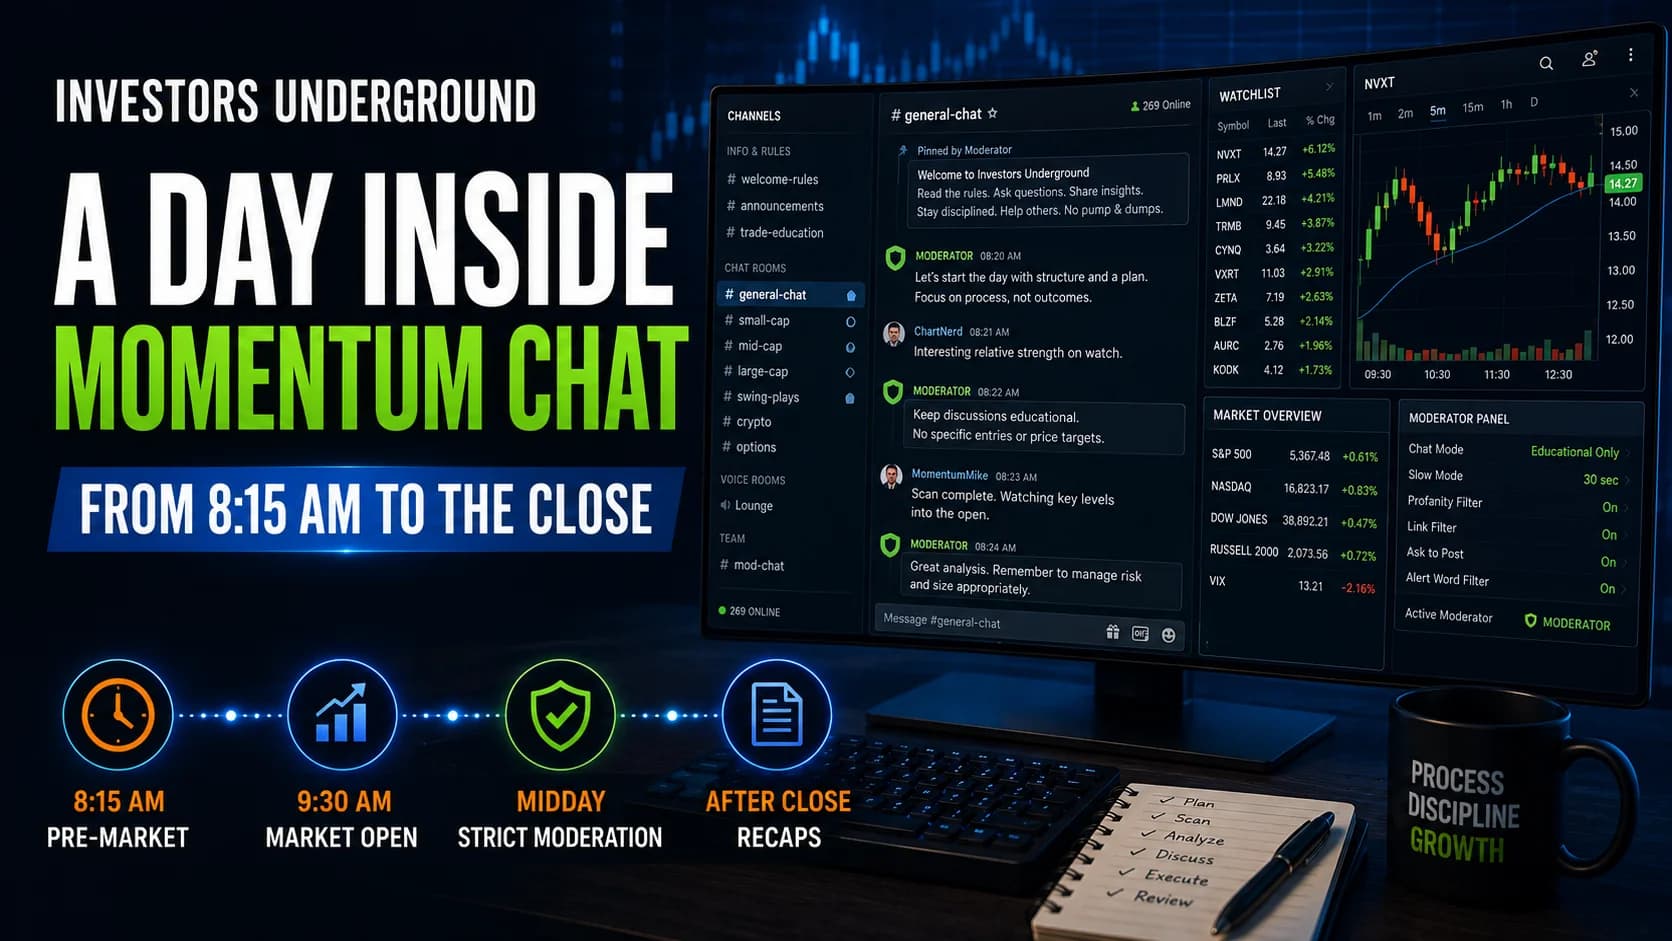
A Day in the Investors Underground Momentum Chat Room: What to Expect
Before you pay for a year of access, here's what actually happens inside Investors Underground's Momentum Chat Room on a typical day, from the pre-market broadcast to the after-close recap.
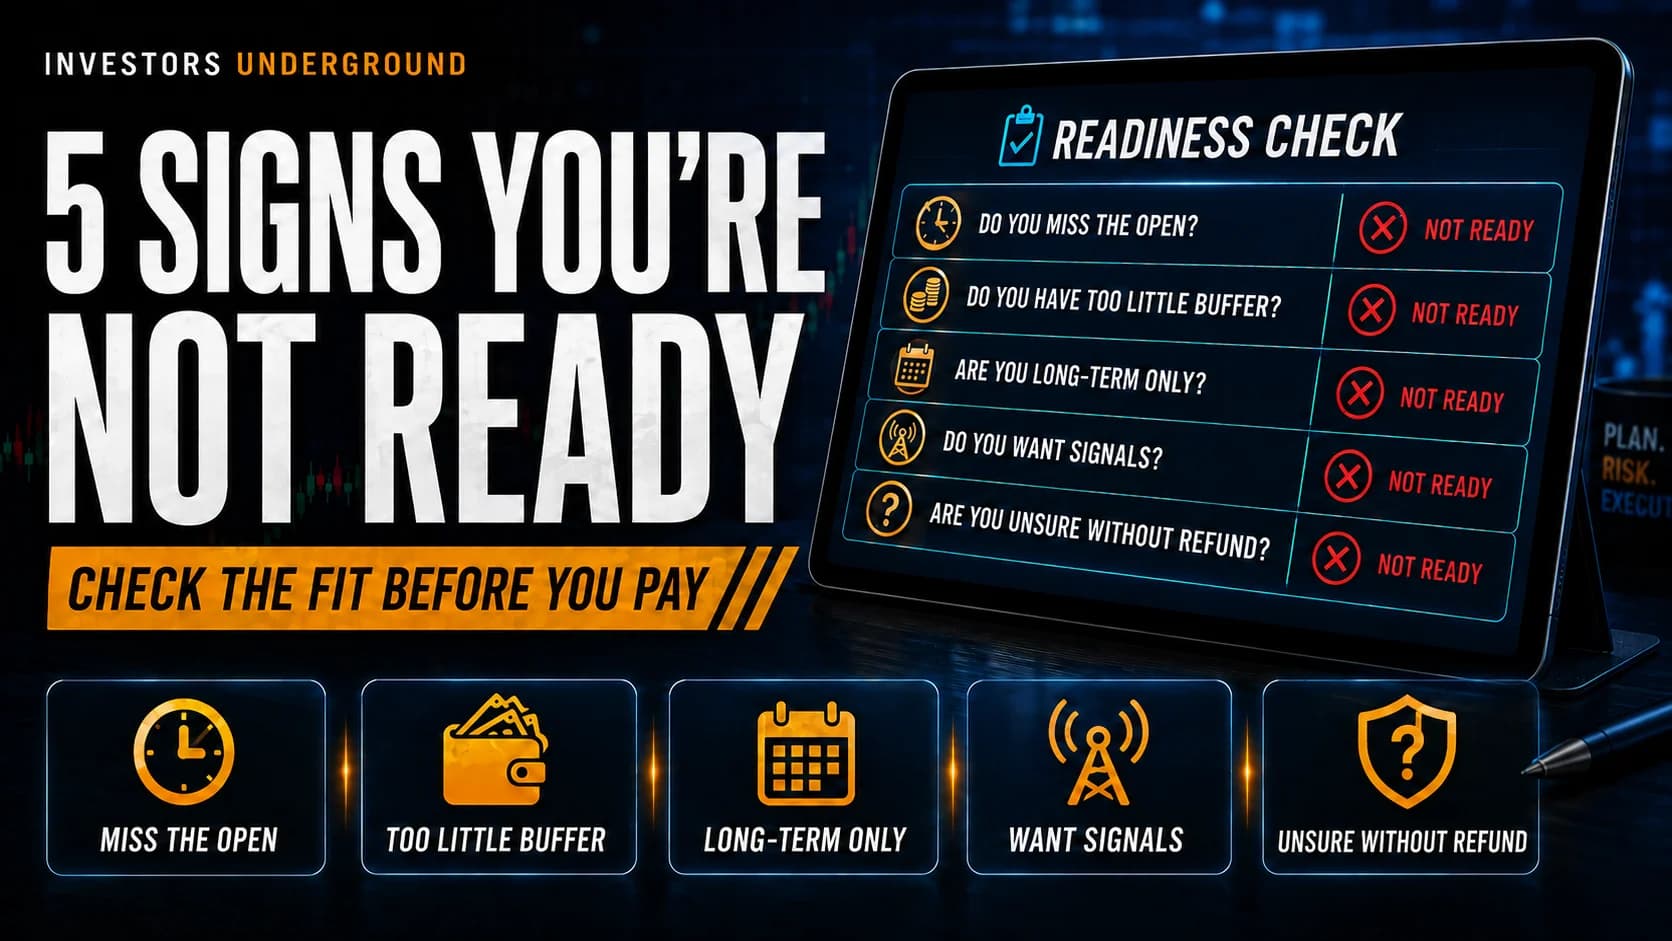
5 Signs You're Not Ready for Investors Underground
Investors Underground has no trial and no refunds on a $1,697 annual membership. Here are five honest signs the timing or fit is wrong for you right now, before that purchase becomes final.
Get the Best Articles Delivered Every Week
Join traders who get our top strategy breakdowns, tool reviews, and market insights straight to their inbox - free, no spam, unsubscribe any time.
No spam. No fluff. Just practical trading content. Unsubscribe anytime.