
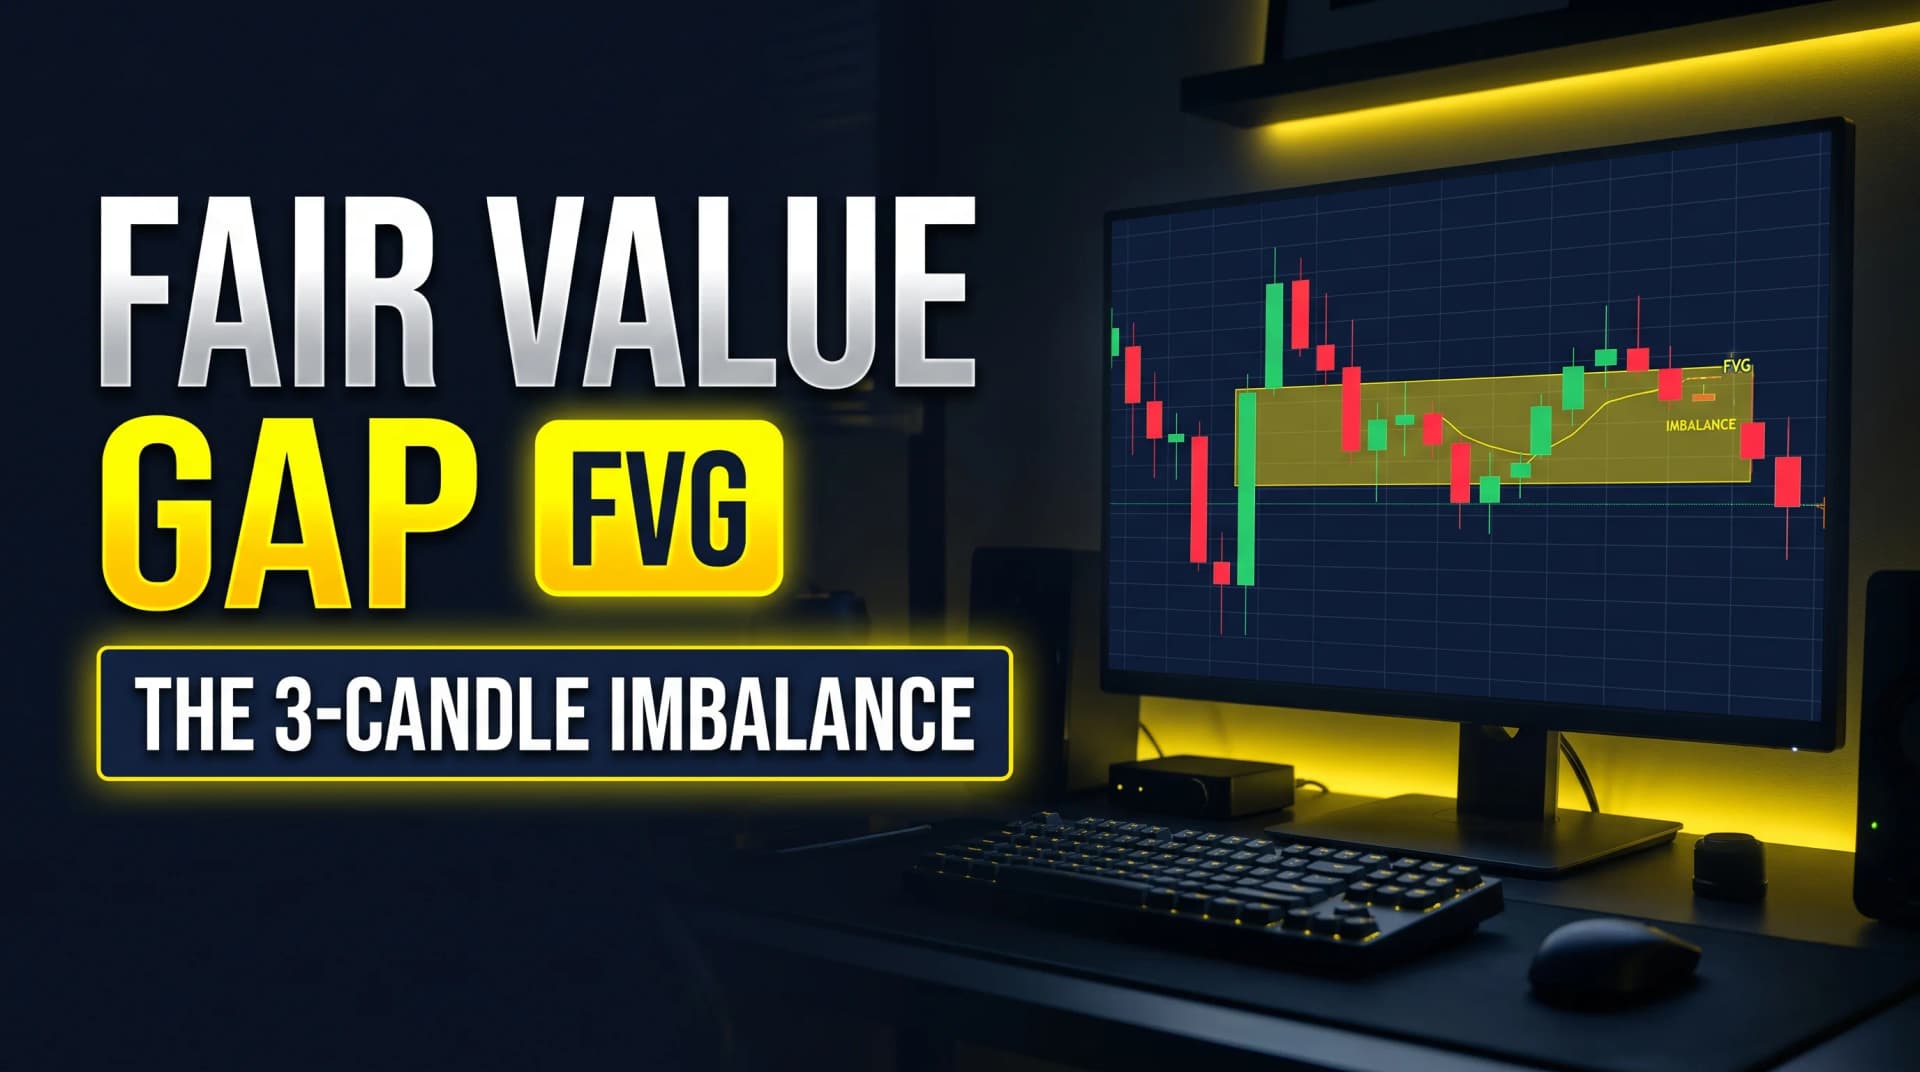
A stock rips higher on three consecutive one-minute candles. Look closely at the middle one and something's missing: the wick of the candle before it tops out at $67.40, and the wick of the candle after it starts at $67.58. Nothing traded between those two prices in a normal, two-way sense during that stretch. Price simply jumped across an eighteen-cent RangeA range (or trading range) is a price zone where a stock oscillates between a defined support floor and resistance ceiling without making meaningful new highs or lows — price is consolidating rather than trending, and the dominant trade is Read definition → on the way up.
That skipped range is a fair value GapA gap is a price discontinuity on a chart where a stock opens significantly higher or lower than the previous session's close, leaving a visible empty space — gap-ups are driven by overnight buying pressure or positive news; gap-downs by seRead definition →, and the theory behind trading it is straightforward: a range that got skipped rather than genuinely traded through, tested, and agreed upon by both sides is considered unfinished business, a zone the market is statistically more likely to revisit later than a range that was properly negotiated the first time.
What is a fair value gap? A fair value gap, often shortened to FVG and also called an imbalance, is a three-candle pattern where the high of the first candle and the low of the third candle don't overlap, leaving a price range on the middle candle that wasn't touched by the candles on either side of it. It marks a stretch of price the market moved through quickly rather than trading through in a normal, two-sided way.
Fair Value Gaps vs. Overnight Gaps: Two Different Kinds of "Gap"
It's worth being precise about terminology, since "gap" gets used for two genuinely different things in trading. An overnight or session gap happens between one day's close and the next day's open, when a stock opens at a meaningfully different price than where it last traded, often driven by news, EarningsAn earnings report is the quarterly financial disclosure a public company files with the SEC, revealing revenue, earnings per share (EPS), profit margins, and forward guidance — it's the most significant regular catalyst for individual stocRead definition →, or broader market moves overnight. A fair value gap is an entirely intracandle phenomenon: it forms within a single continuous session, built from three consecutive candles on whatever timeframe a trader is watching, with no session break involved at all.
The two concepts share a loose family resemblance, both describe a price range the market "skipped," but they form for different reasons and get traded with different logic. This article covers the three-candle intracandle version specifically.
What Actually Qualifies as a Valid Fair Value Gap
A technically valid FVG exists on nearly every fast, one-directional move, which is exactly the problem: a one-minute chart during an active session can produce dozens of them, most too small and too insignificant to be worth a trader's attention. The qualification standard that separates a tradeable FVG from routine noise requires the underlying move to meet the same bar as a valid order block: real conviction, meaning the three-candle sequence forms as part of a genuinely impulsive move with VolumeVolume is the total number of shares (or contracts) traded during a given time period — it's the primary confirmation tool for all price action, because a price move accompanied by high volume indicates genuine market participation, while tRead definition → clearly above the session's recent average, not a minor, unremarkable wiggle.
Gap size relative to the instrument's normal volatility matters too. An FVG spanning a few cents on a low-priced, low-volatility stock might be statistically insignificant, essentially rounding error in the context of that stock's normal candle-to-candle movement, while the same absolute gap size on a different instrument could represent a genuinely meaningful skipped range. Measuring the gap's size against that instrument's Average True RangeAverage True Range (ATR) measures how much a stock or market typically moves over a set number of periods — it's a pure volatility reading, not a direction signal.Read definition →, rather than judging it in raw price terms, gives a more consistent standard across different stocks.
The Fair Value Gap Fill-and-Reject Setup
- Component
- Market Conditions Required
- Rule
- RVOL at 1.5 or higher; the FVG must have formed as part of a genuinely impulsive, above-average-volume move
- Component
- Time of Day
- Rule
- 9:30–11:00 AM ET or 3:00–4:00 PM ET
- Component
- Stock Selection Criteria
- Rule
- Liquid enough for clean candle formation; gap size at least 0.5x the instrument's average true range to be considered significant
- Component
- Entry Trigger
- Rule
- Price returns to the FVG and fills 50% or more of the gap, then prints a rejection candle back in the direction of the original impulsive move
- Component
- Stop Loss
- Rule
- Beyond the far edge of the FVG (the original move's starting point)
- Component
- Initial Profit Target
- Rule
- The high (or low) of the original impulsive move, or a 1:1 R-multiple
- Component
- Trade Management
- Rule
- Hold while price continues in the original direction without threatening a full gap fill; trail using each new higher low (or lower high)
- Component
- Invalidation Criteria
- Rule
- Price fully fills the gap (100%) and continues through it without reversing
| Component | Rule |
|---|---|
| Market Conditions Required | RVOL at 1.5 or higher; the FVG must have formed as part of a genuinely impulsive, above-average-volume move |
| Time of Day | 9:30–11:00 AM ET or 3:00–4:00 PM ET |
| Stock Selection Criteria | Liquid enough for clean candle formation; gap size at least 0.5x the instrument's average true range to be considered significant |
| Entry Trigger | Price returns to the FVG and fills 50% or more of the gap, then prints a rejection candle back in the direction of the original impulsive move |
| Stop Loss | Beyond the far edge of the FVG (the original move's starting point) |
| Initial Profit Target | The high (or low) of the original impulsive move, or a 1:1 R-multiple |
| Trade Management | Hold while price continues in the original direction without threatening a full gap fill; trail using each new higher low (or lower high) |
| Invalidation Criteria | Price fully fills the gap (100%) and continues through it without reversing |
This setup treats a partial fill with rejection as continuation confirmation, and a full fill without rejection as invalidation, a meaningful distinction from simply assuming every FVG gets filled and reverses. In practice, gaps get partially filled and continue, fully filled and reverse, or never revisited at all; the setup is specifically built around the first outcome, not a blanket assumption that all three are equally likely or equally tradeable.
Walking Through a Live Fair Value Gap Trade
Picture a liquid stock trading around $67.10 that begins an impulsive move at 10:12 AM ET on elevated volume. The first one-minute candle in the sequence has a high of $67.40. The second candle gaps further, trading from $67.55 to $67.90. The third candle has a low of $67.58. Since the first candle's high ($67.40) doesn't overlap with the third candle's low ($67.58), an eighteen-cent fair value gap exists between $67.40 and $67.58, and the move behind it showed clearly elevated volume, meeting the qualification standard.
By 10:31 AM, price has pulled back from its high near $68.20 down toward $67.65, roughly a 35% fill of the gap, not yet enough to trigger the setup's 50% threshold. Price continues down to $67.48 at 10:34 AM, now a 76% fill. The next candle prints a clear rejection: it dips to $67.42, just inside the gap's lower half, and closes back at $67.71, reversing sharply.
That's the entry trigger: a fill past 50% followed by a rejection candle back in the original direction. A trader would enter long around $67.70 as that candle closes, with a stop at $67.35 (below the gap's far edge), and an initial target at $68.20, the high of the original impulsive move, fifty cents of reward against thirty-five cents of risk.
Managing a Fair Value Gap Trade
Once in the trade, treat any close back below the FVG's far edge as an immediate invalidation, since that would represent a full fill and reversal rather than the partial fill and continuation the setup is built around. Continued higher lows forming as price moves back toward the target confirm the rejection is holding.
Scale partial size at the first target, and if price pushes beyond the original move's high with continued strength, treat any subsequent, fresh FVG that forms on the way up as a new potential zone to trail a stop beneath, rather than assuming the original trade's logic extends indefinitely.
Where Fair Value Gap Trading Breaks Down
The most important honest caveat with FVGs is that most of them simply aren't significant enough to matter, and the raw pattern's ubiquity on short timeframes is precisely why the qualification standard in this article exists. A trader who treats every three-candle gap on a one-minute chart as a meaningful signal will find dozens of candidates per session, the overwhelming majority of which reflect routine, low-conviction price movement rather than genuine imbalance.
Full fills that continue straight through without any rejection happen regularly, and there's no reliable way to know in advance whether a given FVG will see a partial fill and reversal, a full fill and continuation through it, or no meaningful retest at all before price moves elsewhere entirely. The setup's requirement for an actual rejection candle, rather than entering the instant price reaches the gap, is what keeps a trader from guessing at which of those three outcomes is unfolding before there's real evidence.
Choppy, low-volatility sessions produce FVGs that fail the volume and structure qualification test almost by definition, since the underlying moves creating them lack real conviction in those conditions. The setup should simply be skipped on days where the broader session doesn't show the RVOL and impulsive price action the qualification standard requires, rather than lowering the bar to find candidates that technically qualify but don't carry the same underlying logic.
Fair Value Gaps Across Timeframes and Instruments
Higher-timeframe FVGs, formed on a 15-minute or hourly chart, generally carry more weight than the same pattern on a one-minute chart, for the same reason higher-timeframe order blocks do: they reflect a more significant, harder-to-fake move rather than routine short-term noise. A trader looking for higher-confidence setups can require that a lower-timeframe FVG also sit within a zone that a higher-timeframe FVG or structural level overlaps, rather than trading isolated lower-timeframe gaps on their own.
The concept applies across liquid instruments generally, futures, major forex pairs, and liquid equities alike, since it's built from candle structure rather than anything specific to one asset class. The same liquidity and volume-conviction requirements that limit its usefulness in thin stocks apply equally in any other thinly traded instrument.
Where Fair Value Gap Trading Fits Inside a Complete Trading Plan
FVG trading works best as a precision entry technique for adding to or entering a position in the direction of a move a trader has already identified through broader context, a confirmed trend, a change of character from the Smart Money Concepts overview, or a level from Market Profile, rather than as a standalone reason to trade. Combined with clear position sizing and the fill-and-reject confirmation described above, it offers a specific, mechanical entry within an existing thesis. Scanning charts purely for FVGs without that broader context, and trading every gap that technically qualifies, is an easy way to accumulate a high volume of low-conviction trades.
Frequently Asked Questions
What's the difference between a fair value gap and an order block?
The two frequently appear as part of the same impulsive move, an order block at the starting candle and a fair value gap somewhere within the move itself, but they're separate concepts identified with different rules, and either can appear without the other in a given move. See the order block trading strategy for that specific setup.
Key Takeaway: Order blocks mark where a move started; fair value gaps mark a skipped range within the move, and both are worth checking for confluence.
Do fair value gaps always get filled eventually?
This is the single most important thing to understand before trading FVGs: the claim that gaps "always fill" isn't accurate, and building a strategy around that assumption without a confirmation trigger, like the rejection candle this article's setup requires, ignores the real range of outcomes.
Key Takeaway: Treat gap fills as one of several possible outcomes, not a certainty, and require price confirmation before trading a fill.
Why does the setup use a 50% fill threshold rather than requiring a full fill or no fill at all?
Requiring some fill before considering an entry avoids acting too early, before the gap has genuinely been tested at all. Treating a full fill as invalidation, rather than continuing to look for a bounce even deeper into or through the gap, keeps the setup disciplined about when the original thesis has actually failed.
Key Takeaway: A partial fill with rejection is the setup's target scenario; a full fill without rejection is treated as failure, not as a deeper entry opportunity.
How is a fair value gap different from a standard overnight price gap?
Both describe a price range the market moved through without normal two-sided trading, but they form under completely different circumstances and are analyzed with different logic. This article covers the three-candle intracandle version specifically.
Key Takeaway: Don't confuse an intracandle fair value gap with an overnight session gap; they're related in concept but distinct in formation and analysis.
Should a trader measure a fair value gap's size in raw price terms or relative to the instrument's volatility?
Using a relative measure, this article suggests at least 0.5x the instrument's average true range, keeps the qualification standard consistent across stocks with very different typical daily ranges, rather than applying a single fixed dollar or cent threshold universally.
Key Takeaway: Always size an FVG's significance against that specific instrument's normal volatility, not a fixed price amount.
Do fair value gaps work the same way on a five-minute chart as on a one-minute chart?
A trader can look for confluence between timeframes, a lower-timeframe gap that also sits within a zone flagged by a higher-timeframe gap, as a way to filter for higher-confidence candidates rather than trading isolated one-minute gaps on their own.
Key Takeaway: Weight higher-timeframe fair value gaps more heavily, and look for multi-timeframe confluence when possible.
Can fair value gap trading be combined with the cumulative volume delta or footprint chart approaches covered elsewhere in this module?
A fair value gap that formed alongside a strong CVD push, and that's later tested with weakening opposing delta on the retest, offers considerably more confidence than the price pattern alone.
Key Takeaway: Layer order-flow confirmation from CVD or footprint data onto FVG setups when the data is available, rather than relying on candle structure alone.
Why do so many fair value gaps on a one-minute chart turn out not to matter?
This is why the qualification standard in this article requires above-average volume and a meaningful move, not just the presence of the three-candle pattern itself. Without that filter, a trader ends up treating routine short-term noise as if it were significant market structure.
Key Takeaway: Apply the volume and significance qualification standard strictly; the raw three-candle pattern alone isn't enough to justify a trade.
Disclaimer
Article Sources
- The Price Impact of Order Book Events (Cont, Kukanov, Stoikov) - academic research on order flow imbalance and short-term price movement following impulsive activity.papers.ssrn.com
- Brock, Lakonishok, and LeBaron: Simple Technical Trading Rules and the Stochastic Properties of Stock Returns (Journal of Finance, 1992) - foundational academic study on the statistical reliability of pattern-based technical trading rules.onlinelibrary.wiley.com
- StockCharts ChartSchool: Volume - foundational reference on evaluating volume conviction behind a price move.chartschool.stockcharts.com