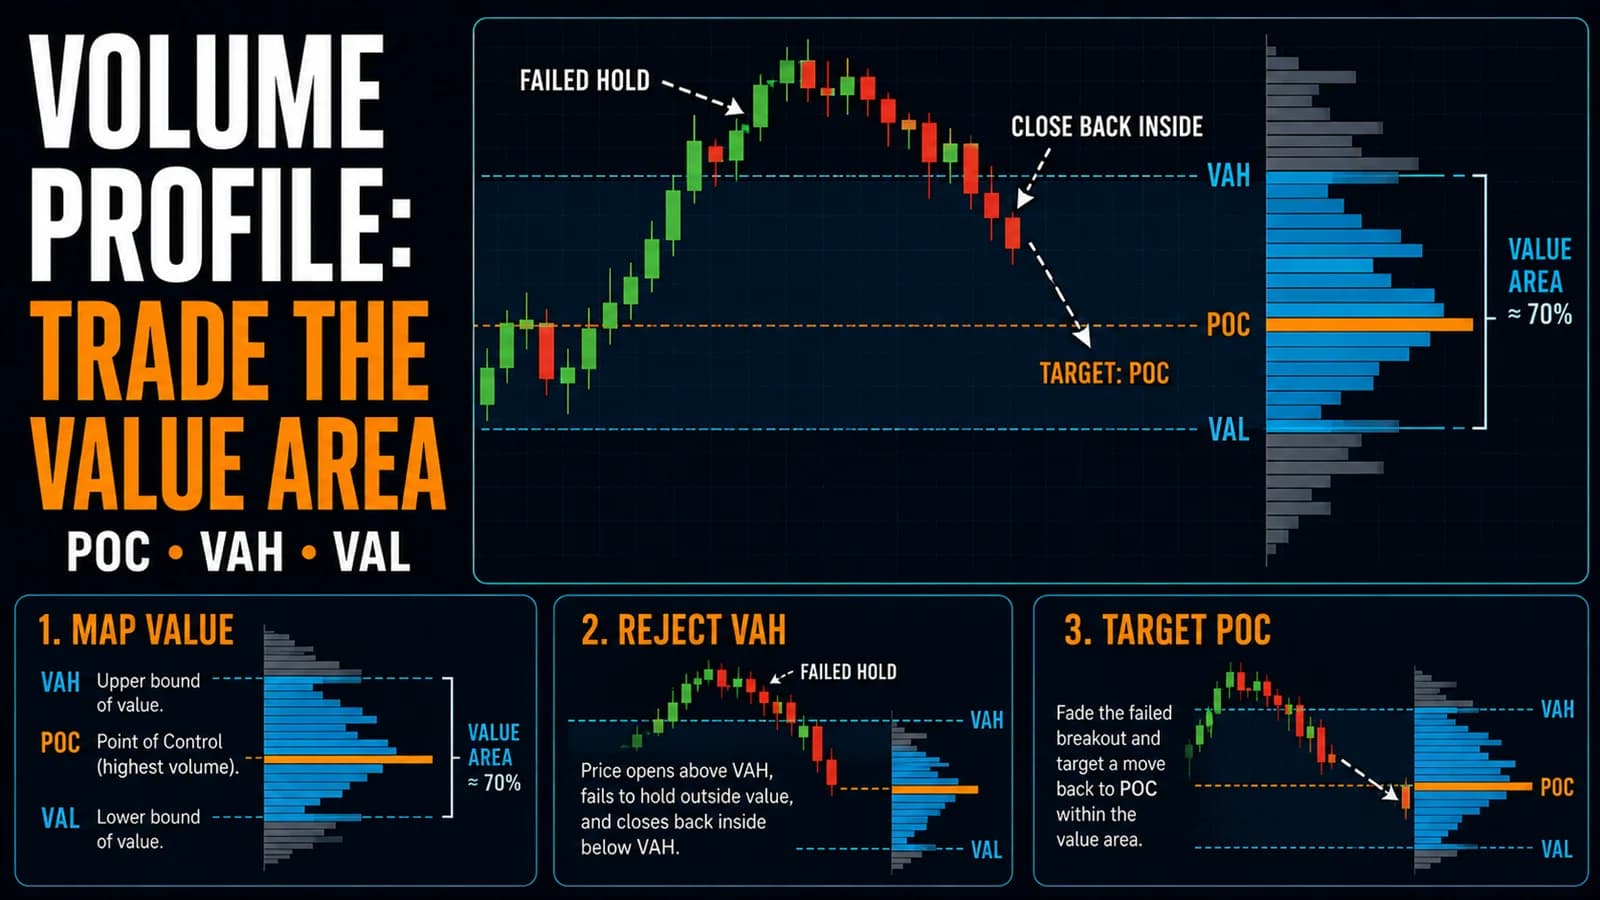
Most indicators plot against time. VolumeVolume is the total number of shares (or contracts) traded during a given time period — it's the primary confirmation tool for all price action, because a price move accompanied by high volume indicates genuine market participation, while tRead definition → Profile flips that entirely, showing where trading activity actually concentrated by price rather than by when it happened. That single shift in perspective reveals something a standard time-based chart hides: the specific price levels where the market has already agreed, through actual traded volume, that a stock is fairly valued.
What is Volume Profile? Volume Profile is a charting tool that displays trading volume horizontally across price levels rather than vertically across time, revealing the Point of Control (POC, the single price with the most volume), the Value Area High (VAH) and Value Area Low (VAL), which together bound the RangeA range (or trading range) is a price zone where a stock oscillates between a defined support floor and resistance ceiling without making meaningful new highs or lows — price is consolidating rather than trending, and the dominant trade is Read definition → containing a defined percentage, typically 70%, of the session's total volume.
Reading Volume by Price Instead of by Time
A standard volume bar shows how much traded during a given candle, telling you when activity spiked. Volume Profile answers a different question entirely: at which specific prices did the most trading actually occur, regardless of when during the session it happened. A stock can trade heavily at $50.20 early in the morning and again at $50.35 in the afternoon, and Volume Profile combines both instances into a single horizontal bar at that price level, showing the market's cumulative interest there.
This distinction matters because price levels with heavy historical volume tend to act as magnets and as SupportSupport is a price level where buying pressure has historically overcome selling pressure, causing price to stop declining and reverse — it's the floor where demand enters the market, and when it holds, it's a potential long entry; when it Read definition → or ResistanceResistance is a price level where selling pressure has historically overcome buying pressure, causing price to stall, reverse, or consolidate — it's the ceiling where supply enters the market and where breakout traders watch for either a coRead definition → going forward. A large volume node reflects a price where a substantial number of traders agreed to transact, which means a meaningful number of participants have a cost basis right at that level, a fact that shapes how price behaves when it revisits that zone later.
The Three Reference Points Every Trader Should Know
The Point of Control (POC) marks the single price level with the highest traded volume in the profile, representing the session's (or period's) fairest, most agreed-upon price. Price often gravitates back toward the POC during quieter stretches of the session, similar in spirit to how VWAPVWAP (Volume Weighted Average Price) is the average price a security has traded at throughout the session, weighted by volume — it's the most important intraday indicator for day traders, serving as a real-time measure of fair value and theRead definition → functions, though POC is calculated purely from volume distribution rather than a running average.
The Value Area, typically defined as the range containing 70% of total volume, is bounded by the Value Area High (VAH) and Value Area Low (VAL). These two levels function as a kind of "fair value zone" for the session: price trading inside the Value Area is considered to be within the range the market has broadly agreed is reasonable, while price pushing outside either boundary signals a potential shift in that agreement, either toward genuine price discovery in a new direction or toward an overextension likely to revert.
Setup Specification
- Component
- Market Conditions Required
- Rule
- Works in both trending markets (trading breakouts beyond VAH/VAL) and range-bound markets (fading moves back toward POC from outside the Value Area)
- Component
- Time of Day
- Rule
- Most useful once the current session's profile has developed enough volume to be meaningful, generally after the first 30 to 60 minutes; prior-day profiles are usable from the open
- Component
- Stock Selection Criteria
- Rule
- Liquid stocks with meaningful volume concentration; less useful on very thin, low-volume names where the profile is sparse and unreliable
- Component
- Entry Trigger (fade)
- Rule
- Price pushes outside the Value Area (above VAH or below VAL) without strong accompanying volume, then shows a reversal candle back toward the value area
- Component
- Entry Trigger (breakout)
- Rule
- Price closes decisively beyond VAH or VAL on strong, accelerating volume, suggesting a genuine shift in the market's accepted value range
- Component
- Stop Loss
- Rule
- Just outside the level being traded against (VAH, VAL, or POC), sized to the stock's typical volatility
- Component
- Initial Profit Target
- Rule
- The POC for fade trades back into the value area, or the next significant volume node beyond the breakout level for continuation trades
- Component
- Invalidation Criteria
- Rule
- Price failing to revert on a fade trade, or failing to hold beyond the value area on a breakout trade
| Component | Rule |
|---|---|
| Market Conditions Required | Works in both trending markets (trading breakouts beyond VAH/VAL) and range-bound markets (fading moves back toward POC from outside the Value Area) |
| Time of Day | Most useful once the current session's profile has developed enough volume to be meaningful, generally after the first 30 to 60 minutes; prior-day profiles are usable from the open |
| Stock Selection Criteria | Liquid stocks with meaningful volume concentration; less useful on very thin, low-volume names where the profile is sparse and unreliable |
| Entry Trigger (fade) | Price pushes outside the Value Area (above VAH or below VAL) without strong accompanying volume, then shows a reversal candle back toward the value area |
| Entry Trigger (breakout) | Price closes decisively beyond VAH or VAL on strong, accelerating volume, suggesting a genuine shift in the market's accepted value range |
| Stop Loss | Just outside the level being traded against (VAH, VAL, or POC), sized to the stock's typical volatility |
| Initial Profit Target | The POC for fade trades back into the value area, or the next significant volume node beyond the breakout level for continuation trades |
| Invalidation Criteria | Price failing to revert on a fade trade, or failing to hold beyond the value area on a breakout trade |
A Narrated Walk-Through
Consider a mid-cap financial stock, call it XYZ, where the prior session's Volume Profile shows a POC at $64.50, a VAH at $65.80, and a VAL at $63.20. On the following session, XYZ opens at $66.20, above the prior day's Value Area entirely, on moderate but not exceptional volume.
By 10:30 AM ET, XYZ drifts down to $65.60, back inside the prior Value Area range, and shows a reversal candle with volume ticking up as it approaches $65.80 (the VAH) from above. A trader treats this as a fade back toward the POC, entering short at $65.55 with a stop at $66.35, above the session's high. The target is the POC at $64.50, offering roughly 1.3:1 reward to risk. This walk-through describes a hypothetical archetype rather than a real ticker at current prices.
Distinguishing a Genuine Breakout From a Value Area Overextension
The hardest judgment call with Volume Profile is deciding whether a move beyond VAH or VAL represents genuine price discovery, the market establishing a new, higher or lower fair value, or simply a temporary overextension likely to snap back. Volume is the primary tool for making this call: a push beyond the value area on strong, sustained volume suggests real conviction behind the new level, while a push on weak or fading volume suggests the move lacks the participation needed to establish a genuinely new value area.
Time spent outside the value area also matters. A brief poke beyond VAH that quickly reverses is more consistent with an overextension, while price that spends an extended period trading above VAH without reverting is building the foundation for a new, higher value area to eventually form.
Where Volume Profile Trades Fail
The most common failure mode is treating every push beyond the value area as an automatic fade opportunity, without checking whether volume actually confirms weakness in the move. A stock breaking out on genuinely strong, accelerating volume is fighting a very different battle than one drifting slightly beyond VAH on thin participation, and applying the same fade logic to both situations produces poor results on the genuine breakouts.
A second failure mode involves using a stale or irrelevant profile. A Volume Profile built from a single unusual session, such as an earnings reaction day with wildly elevated volume, may not represent a meaningful reference point for subsequent, more normal trading sessions. Traders sometimes need to judge whether the specific period a profile was built from is actually representative before relying on its POC and Value Area levels.
A third failure mode is ignoring the broader trend context. A fade trade back toward POC in a stock that's in the early stages of a powerful new uptrend fights against real directional conviction, and the same logic that works well in range-bound conditions can produce repeated losses when applied blindly during a genuine trend change.
Building a Composite Profile Across Multiple Sessions
While a single session's Volume Profile is useful, some traders build a composite profile spanning several days or weeks, which reveals longer-term volume nodes that carry even more significance than a single day's activity. A price level that shows heavy volume concentration across multiple sessions represents a genuinely well-established area of consensus, often acting as a stronger support or resistance zone than any single day's POC alone.
This composite approach pairs naturally with other volume-based tools discussed elsewhere in this hub, and traders building a full market-structure view often layer a composite Volume Profile underneath more standard support and resistance analysis.
Tools for Building and Scanning Volume Profiles
Volume Profile requires specific charting functionality that not every basic platform includes by default, and identifying stocks currently trading near a significant historical volume node across a broad watchlist benefits from purpose-built scanning. Trade Ideas includes charting capable of displaying Volume Profile alongside its broader scanning tools, letting traders combine profile-based analysis with real-time filters for RVOL and price action.
Where Volume Profile Fits a Broader Trading Plan
Volume Profile works best as a structural layer underneath a trader's existing entry method, providing context about where genuine agreement on value exists rather than replacing a specific entry trigger on its own. Traders combining Volume Profile with a broader market profile and auction theory framework tend to build a more complete picture of how a stock's price discovery process is actually unfolding than using either tool alone.
FAQ
How does Volume Profile differ from a standard volume bar chart?
This reorientation from time-based to price-based volume reveals information a standard chart simply doesn't show directly: the specific prices where the most agreement on value has occurred. Traders use this price-based view to identify support, resistance, and fair value zones that a purely time-based volume chart can't reveal on its own.
Key Takeaway: Volume Profile organizes volume by price rather than by time, revealing where agreement on value has concentrated.
What percentage of volume defines the Value Area?
The 70% figure originated from market profile theory, reflecting roughly one standard deviation of a normal distribution, applied to the volume-by-price data. Traders occasionally adjust this percentage for a wider or narrower Value Area depending on their specific analytical preferences, though 70% remains the widely used default.
Key Takeaway: 70% is the traditional Value Area definition, adjustable on some platforms but rarely changed from the default.
Does the Point of Control move during the trading session, or is it fixed?
Early in a session, the developing POC can move meaningfully as fresh volume prints at new levels. As the session progresses and more volume accumulates, the POC typically stabilizes, though a very high-volume move late in the day can still shift it. Traders generally treat an early-session POC with more caution than one that's held steady for several hours.
Key Takeaway: The POC can shift early in a session before stabilizing as more volume accumulates throughout the day.
Should Volume Profile from the previous day be used, or does each new session need its own profile?
Since a fresh session's Volume Profile starts essentially empty at the open, traders commonly reference the prior day's completed profile for the first portion of a new session, then transition attention to the developing current-day profile as it accumulates enough volume to be statistically meaningful.
Key Takeaway: Use the prior day's profile early in a new session, transitioning to the current day's developing profile as it builds up volume.
How does Volume Profile relate to VWAP?
VWAP compresses all of a session's volume-weighted price data into a single number that updates continuously. Volume Profile preserves the full distribution, showing not just an average but exactly where volume concentrated most heavily. The two tools are complementary rather than redundant, since VWAP gives a quick single reference point while Volume Profile reveals the underlying structure behind it.
Key Takeaway: VWAP is a single average line, while Volume Profile preserves the full distribution of where volume actually concentrated.
Can Volume Profile be used on any timeframe, or is it specific to intraday sessions?
A composite profile spanning a longer period reveals longer-term structural levels that a single day's profile wouldn't capture. Day traders typically use a mix: the current or prior session's profile for immediate context, alongside a longer composite profile for identifying more significant, longer-standing support and resistance zones.
Key Takeaway: Volume Profile works across any timeframe, with day traders often referencing both session-level and longer composite profiles together.
Why does price sometimes ignore a heavily traded volume node entirely?
Volume Profile reflects historical agreement on value, not a guarantee that the same agreement will hold going forward. A significant earnings surprise, for example, can render prior volume nodes largely irrelevant as the market rapidly reprices the stock to a new range, which is why context around why a level formed matters as much as the level itself.
Key Takeaway: A major fundamental shift can render prior volume nodes less relevant, since Volume Profile reflects historical, not guaranteed future, agreement on value.
Is Volume Profile a beginner-friendly tool?
The visual presentation, a horizontal histogram rather than a standard vertical volume chart, takes some adjustment for traders used to reading volume only in the time-based format. Once a trader understands basic volume concepts, the transition to reading Volume Profile becomes considerably more intuitive than attempting to learn both concepts simultaneously.
Key Takeaway: Build foundational volume-reading skills first; Volume Profile is a natural, more advanced extension of that same concept.
Disclaimer
Article Sources
- StockCharts ChartSchool: Technical Indicators & Overlays - Reference covering Volume by Price and related volume-based charting tools.chartschool.stockcharts.com
- CME Group Education - Background on market profile concepts originally developed for futures markets, from which Volume Profile derives much of its framework.cmegroup.com
- CFA Institute: Technical Analysis for Investment Professionals - Professional context on volume-based analysis within broader technical practice.cfainstitute.org
- FINRA: Day Trading Risk Disclosure - Regulatory guidance on the risks inherent in short-term, indicator-driven trading.finra.org