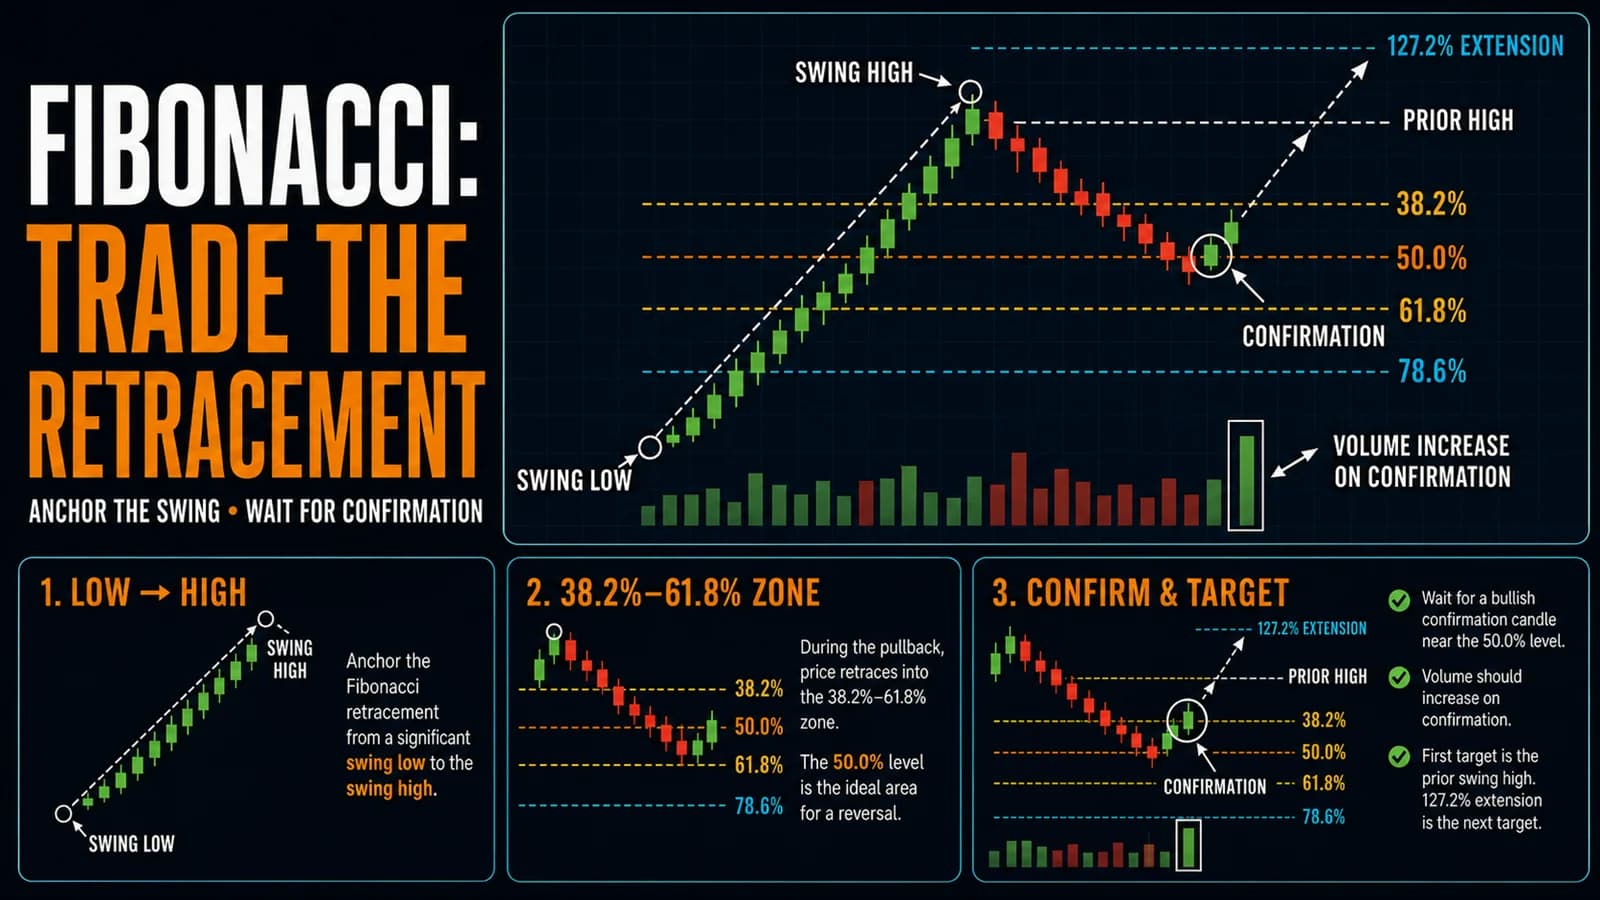
No indicator provokes more skepticism from newer traders than Fibonacci retracements, and the skepticism is understandable at first glance: why would a sequence of numbers from a 13th-century Italian mathematician have any bearing on where a tech stock pulls back today? The honest answer isn't mystical. It's that enough traders and algorithms watch the same levels that the levels become somewhat self-fulfilling, which is a perfectly legitimate reason to trade them even without believing in any deeper mathematical significance.
What is the Fibonacci RetracementFibonacci retracement levels are horizontal lines drawn at key ratios (23.6%, 38.2%, 50%, 61.8%, 78.6%) between a significant swing high and low — traders use these zones to identify where pullbacks within a trend may find support or resistRead definition → strategy? The Fibonacci retracement strategy uses horizontal lines drawn at key ratios, most commonly 38.2%, 50%, and 61.8%, between a significant swing high and swing low, to identify likely areas where a PullbackA pullback is a temporary counter-trend price movement within an established trend — in an uptrend, a pullback is a short-term decline that offers a lower-risk entry point before the trend resumes, as opposed to a reversal which signals theRead definition → within a TrendA trend is a sustained directional movement in price over time — an uptrend is characterized by a sequence of higher highs and higher lows, a downtrend by lower highs and lower lows — and correctly identifying the current trend direction isRead definition → might find SupportSupport is a price level where buying pressure has historically overcome selling pressure, causing price to stop declining and reverse — it's the floor where demand enters the market, and when it holds, it's a potential long entry; when it Read definition → or ResistanceResistance is a price level where selling pressure has historically overcome buying pressure, causing price to stall, reverse, or consolidate — it's the ceiling where supply enters the market and where breakout traders watch for either a coRead definition → before the trend resumes.
Why These Specific Ratios, and Why They Work Even Without Magic
The Fibonacci sequence produces a set of ratios, most notably 61.8% and 38.2%, that appear repeatedly in nature and have been applied to financial markets for decades. Whether or not there's a genuine underlying mathematical reason, the practical case for using these levels rests on a simpler, more defensible foundation: enough market participants, from retail traders to institutional algorithms, watch the same 38.2%, 50%, and 61.8% retracement levels that real buying or selling activity tends to cluster there, creating a genuine, observable effect regardless of the underlying theory's validity.
This matters for how a trader should think about the tool. Fibonacci retracements aren't a precise prediction of where price must stop. They're a probability zone, a place where enough attention converges that a pullback is more likely than average to find support or resistance, which is meaningfully different from claiming the market obeys some hidden mathematical law.
How to Draw the Retracement Correctly
The retracement tool anchors to a specific swing low and swing high, and choosing the wrong anchor points is the single most common technical mistake traders make with this tool. For an uptrend, the tool is drawn from the swing low to the swing high, and the retracement levels then project downward from the high, showing where a pullback might find support. For a downtrend, the tool is drawn from the swing high to the swing low, projecting upward to show where a bounce might find resistance.
Choosing genuinely significant swing points, rather than minor, insignificant wiggles, matters considerably. A retracement drawn from a truly major swing low to a truly major swing high tends to produce more meaningful, more widely watched levels than one drawn from two arbitrary, minor points that most other market participants wouldn't consider significant reference points at all.
Setup Specification
- Component
- Market Conditions Required
- Rule
- A clearly defined trend with an identifiable, significant swing high and swing low to anchor the retracement
- Component
- Time of Day
- Rule
- Applies throughout the session; more reliable once a clear intraday swing has developed rather than during the first few minutes of a fresh move
- Component
- Stock Selection Criteria
- Rule
- Liquid stocks with a visible, well-defined trend; works across most price ranges
- Component
- Entry Trigger
- Rule
- Price pulls back into the 38.2% to 61.8% retracement zone and shows a reversal candle with supporting volume, ideally aligning with another confirmation such as a moving average or prior support level
- Component
- Stop Loss
- Rule
- Below the 61.8% or 78.6% level (for longs), or beyond the swing point itself if the trade is meant to be invalidated by a full retracement
- Component
- Initial Profit Target
- Rule
- The prior swing high (a full retracement reversal), with Fibonacci extension levels (127.2%, 161.8%) used for projecting beyond the prior high on strong continuations
- Component
- Trade Management
- Rule
- Trail beneath higher lows as the trend resumes; treat a break below the 61.8% level as a warning that the pullback may be turning into a full reversal
- Component
- Invalidation Criteria
- Rule
- Price closing decisively below the 61.8% or 78.6% retracement level, suggesting the original trend may be failing rather than simply pausing
| Component | Rule |
|---|---|
| Market Conditions Required | A clearly defined trend with an identifiable, significant swing high and swing low to anchor the retracement |
| Time of Day | Applies throughout the session; more reliable once a clear intraday swing has developed rather than during the first few minutes of a fresh move |
| Stock Selection Criteria | Liquid stocks with a visible, well-defined trend; works across most price ranges |
| Entry Trigger | Price pulls back into the 38.2% to 61.8% retracement zone and shows a reversal candle with supporting volume, ideally aligning with another confirmation such as a moving average or prior support level |
| Stop Loss | Below the 61.8% or 78.6% level (for longs), or beyond the swing point itself if the trade is meant to be invalidated by a full retracement |
| Initial Profit Target | The prior swing high (a full retracement reversal), with Fibonacci extension levels (127.2%, 161.8%) used for projecting beyond the prior high on strong continuations |
| Trade Management | Trail beneath higher lows as the trend resumes; treat a break below the 61.8% level as a warning that the pullback may be turning into a full reversal |
| Invalidation Criteria | Price closing decisively below the 61.8% or 78.6% retracement level, suggesting the original trend may be failing rather than simply pausing |
A Narrated Walk-Through
Consider a mid-cap biotech stock, call it XYZ, rallying from $40.00 to $52.00 over the course of a session on strong volume following positive trial data. As the initial move stalls, XYZ begins pulling back, and a trader draws a Fibonacci retracement from the $40.00 low to the $52.00 high, identifying the 38.2% level at $47.42, the 50% level at $46.00, and the 61.8% level at $44.58.
XYZ pulls back to $46.20, just above the 50% level, and prints a reversal candle with volume ticking up as buyers step back in. A trader enters at $46.50 with a stop at $44.30, just below the 61.8% level. The first target is $52.00, the prior swing high, offering roughly 2.5:1 reward to risk. If XYZ clears $52.00 with continued strength, a Fibonacci extension projects a further target near $58.40, based on the 127.2% extension of the original move. This walk-through describes a hypothetical archetype rather than a real ticker at current prices.
Combining Fibonacci Levels With Other Confirmation
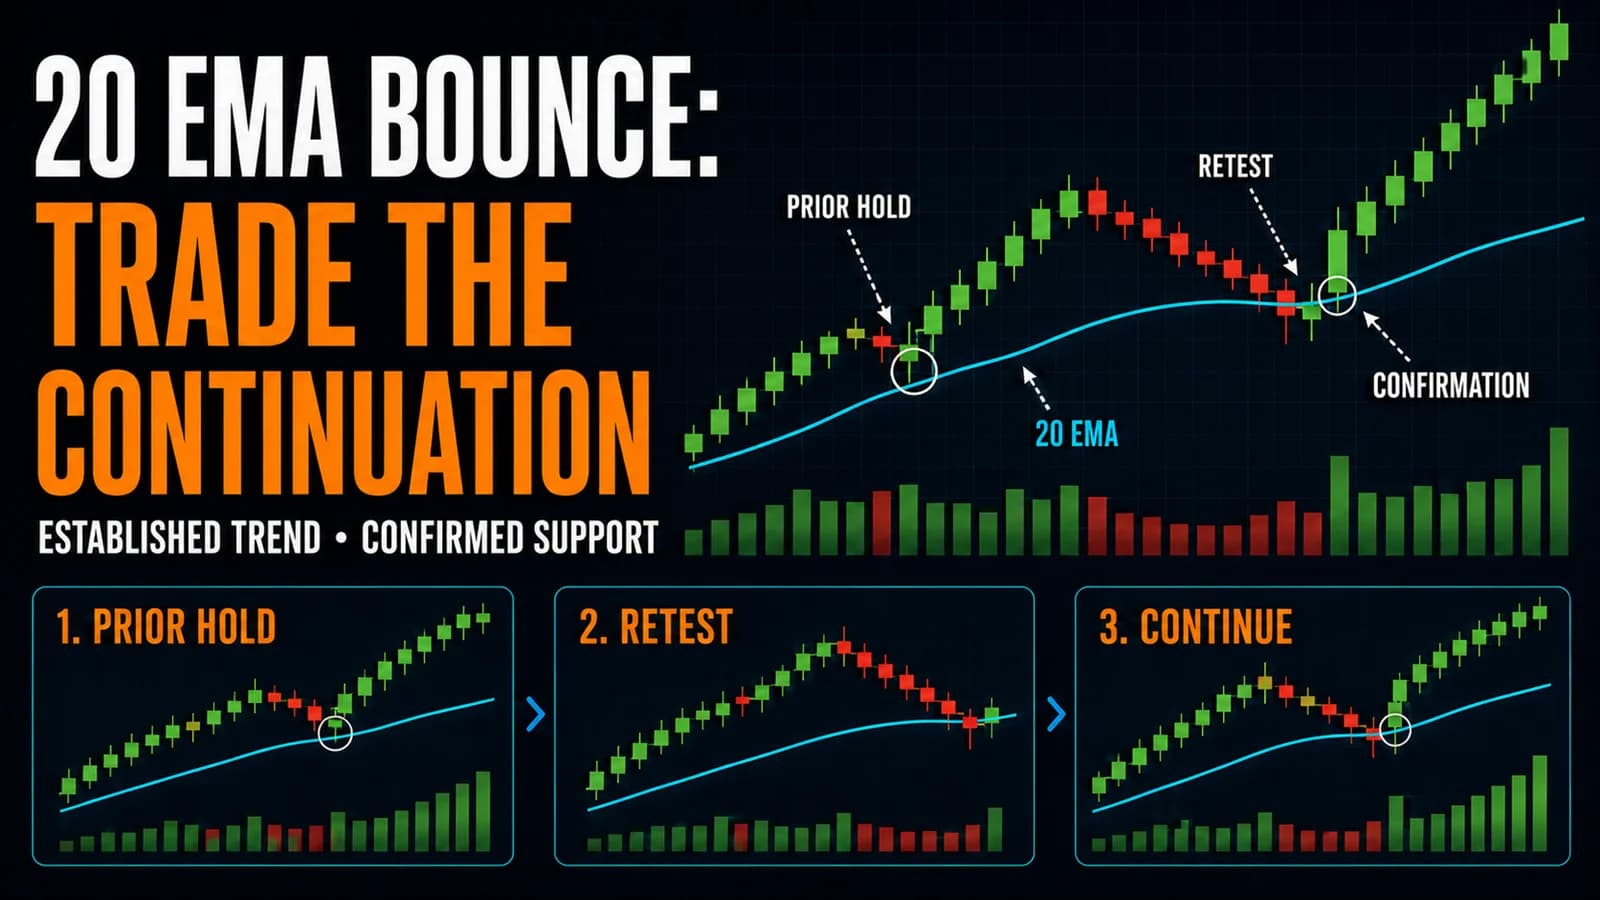
Fibonacci retracement levels rarely work best in isolation, and the strongest setups occur when a Fibonacci level coincides with another independent form of support or resistance. A 61.8% retracement that lines up closely with a stock's rising 20 EMA, or with a prior swing low from an earlier session, gives a trader two independent reasons to expect the level to hold rather than relying purely on the Fibonacci math.
This kind of confluence is genuinely important, since a Fibonacci level sitting in open space with no other supporting evidence carries meaningfully less predictive weight than one reinforced by additional structure.
Where Fibonacci Retracement Trades Fail
The most common failure mode is choosing poor, insignificant anchor points for the retracement, drawing the tool from minor swings that most other market participants aren't watching at all. Because the tool's usefulness depends partly on widespread attention creating a self-fulfilling effect, a retracement drawn from obscure, low-significance points loses much of the practical advantage that makes the tool worth using in the first place.
A second failure mode is treating every retracement level as an automatic bounce point regardless of the broader trend's strength. A shallow pullback that barely reaches the 38.2% level in an extremely strong trend suggests the move has plenty of remaining momentum, while a deep pullback all the way to 61.8% or beyond suggests the original trend may be weakening, and treating both situations with identical confidence ignores meaningful information the depth of the pullback itself is providing.
A third failure mode involves ignoring what happens after price reaches a Fibonacci level. Simply touching 50% or 61.8% isn't itself a signal; waiting for an actual reversal candle with supporting volume, rather than buying the instant price touches the level, meaningfully reduces the number of false signals a trader gets caught in.
Fibonacci Extensions for Projecting Beyond the Prior High
Beyond retracement levels, Fibonacci extensions (commonly 127.2% and 161.8%) project potential targets beyond the original swing high or low, useful for setting profit targets on a trend that's expected to continue past its prior extreme. These extension levels use the same underlying ratio logic as retracements but project forward rather than backward, giving traders a framework for target-setting on strong continuation moves rather than only on the initial pullback entry.
Screening for Stocks at Key Fibonacci Levels
Manually drawing and monitoring Fibonacci retracements across a large watchlist in real time is impractical without charting tools built to display them automatically. Most modern charting platforms include a Fibonacci drawing tool as standard functionality, and Trade Ideas offers charting alongside its broader scanning capabilities that traders can use to combine Fibonacci level analysis with real-time volume and price filters for a more complete view of candidates worth watching.
Where Fibonacci Retracements Fit a Broader Trading Plan
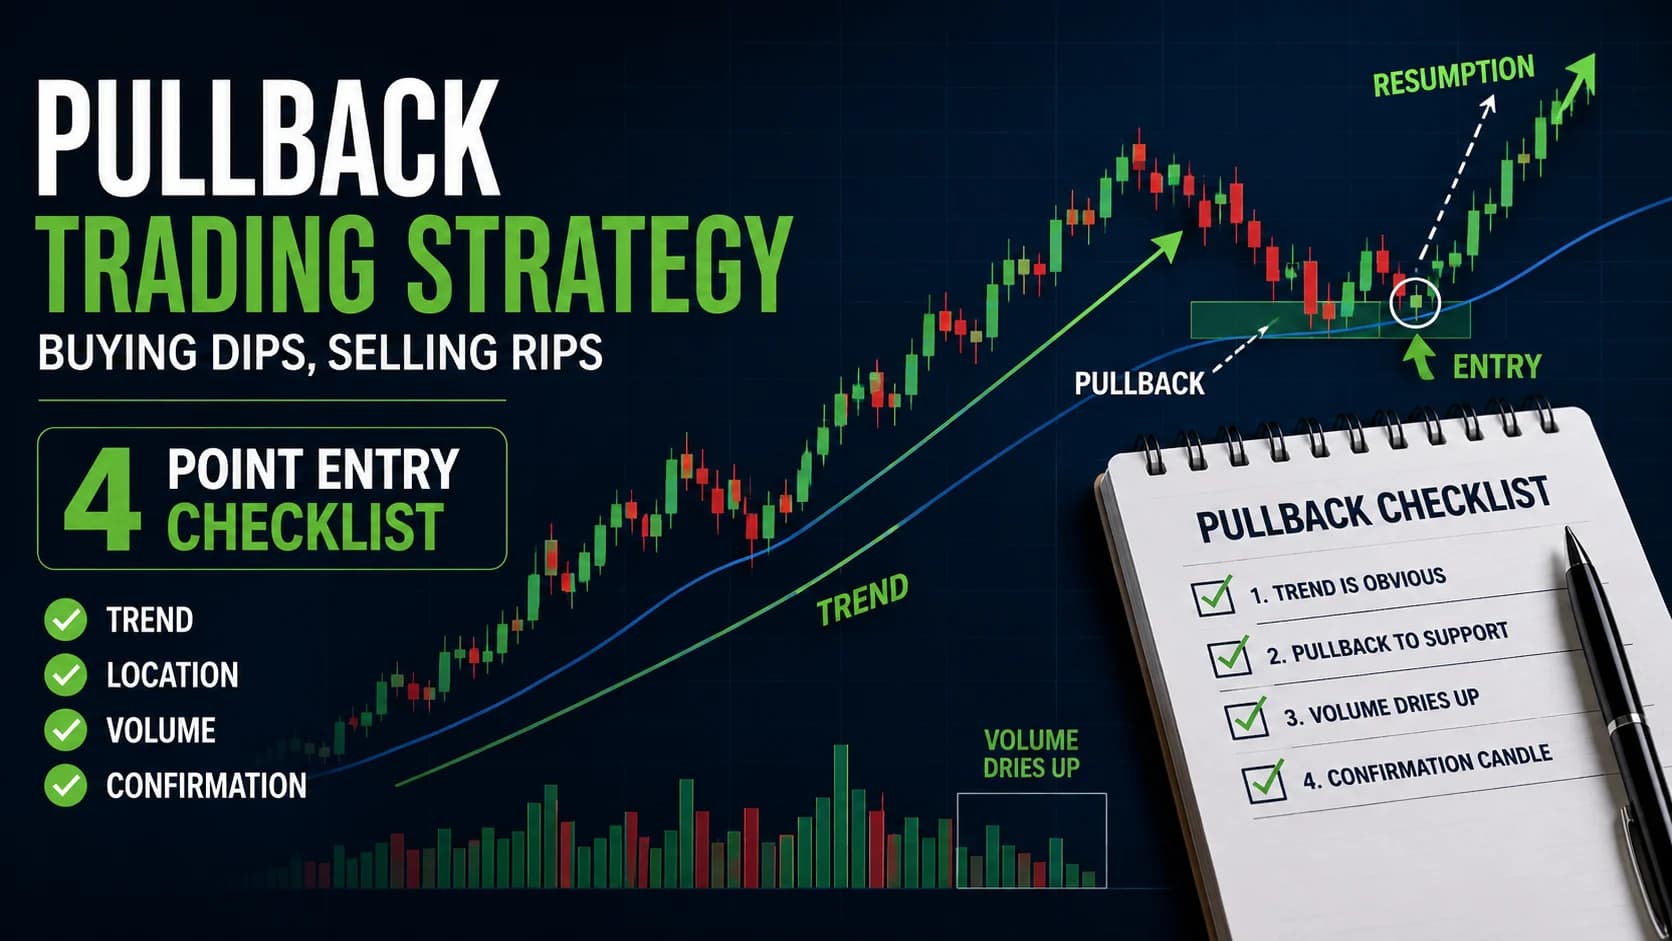
Fibonacci retracements work best as a supplementary confirmation tool layered onto a broader trend-following or pullback strategy, rather than as a standalone system traded purely off the ratio levels alone. Pairing Fibonacci analysis with clear trend structure, such as the pullback trading framework covered elsewhere in this hub, tends to produce a more disciplined approach than relying on Fibonacci levels in isolation.
FAQ
Which Fibonacci retracement level is considered the most significant?
The 61.8% level marks a deep but not complete retracement, and many traders consider a pullback that holds at or above this level as still consistent with a healthy, intact trend. A break below 61.8% is often treated as a warning sign that the original trend may be weakening rather than simply pausing for a routine pullback.
Key Takeaway: 61.8% is generally treated as the most significant level, with a break below it often signaling trend weakness rather than a routine pullback.
Is the 50% level technically a Fibonacci ratio?
The genuine Fibonacci-derived ratios are 23.6%, 38.2%, 61.8%, and 78.6%. The 50% level is included by convention because a halfway retracement is intuitively significant to many traders independent of Fibonacci theory, and its widespread use means it functions similarly to the true Fibonacci levels in practice.
Key Takeaway: 50% isn't a true Fibonacci ratio but is included by convention and watched just as widely as the genuine Fibonacci levels.
How does a trader choose which swing high and low to use for the retracement?
Choosing minor, insignificant swings undermines the tool's practical value, since fewer other market participants are likely watching the same levels. Traders generally look for a clear, sizable move on the timeframe they're trading, anchoring the retracement to the obvious start and end points of that specific move rather than an arbitrary smaller fluctuation within it.
Key Takeaway: Anchor retracements to genuinely significant, widely visible swing points rather than minor internal fluctuations.
Can Fibonacci retracements be used on any timeframe?
A retracement drawn on a 1 minute chart reflects a much smaller, less widely tracked swing than the same tool applied to a daily or weekly chart. Day traders commonly use Fibonacci retracements on both an intraday timeframe for immediate entries and a higher timeframe for broader context on where the current move sits within the bigger picture.
Key Takeaway: Fibonacci retracements work on any timeframe, with higher timeframe levels generally carrying more significance.
Should a trader buy immediately when price touches a Fibonacci level?
A Fibonacci level marks a zone of increased probability, not a guarantee that price will reverse the moment it arrives there. Price frequently pierces through a Fibonacci level before actually reversing, and traders who wait for confirmation, a candle close back in the trend's direction with supporting volume, avoid many of the false touches that don't hold.
Key Takeaway: Wait for a confirming reversal candle at the Fibonacci level rather than entering on the first touch.
How do Fibonacci extensions differ from retracements?
Retracements are used to find likely entry points during a pullback, while extensions are used to set profit targets once a trend has cleared its prior high or low and continues moving. Both tools use the same underlying Fibonacci ratios but serve different, complementary purposes within a single trade.
Key Takeaway: Retracements find likely pullback entry zones; extensions project targets for a continuing move beyond the prior extreme.
Does Fibonacci analysis work the same way in a downtrend as in an uptrend?
The underlying logic mirrors exactly between the two directions, simply flipped. A short trader watches for a bounce into the 38.2% to 61.8% zone within a downtrend as a potential entry to short, using the same confirmation principles, a reversal candle with supporting volume, that apply to the long-side version of the setup.
Key Takeaway: The Fibonacci retracement strategy applies identically in downtrends, simply reversed in direction and anchor points.
Is Fibonacci retracement analysis beginner-friendly?
A beginner can quickly learn to place a Fibonacci retracement tool on a chart, but developing the judgment to choose significant anchor points and wait for genuine confirmation, rather than reacting to every touch, typically develops with more screen time. This is a reasonable early tool to learn conceptually, even if mastering its practical application takes longer.
Key Takeaway: The mechanics are simple to learn, but effective application requires practice in choosing anchors and waiting for confirmation.
Disclaimer
Article Sources
- StockCharts ChartSchool: Technical Indicators & Overlays - Reference covering Fibonacci-based tools alongside related support and resistance overlays.chartschool.stockcharts.com
- CFA Institute: Technical Analysis for Investment Professionals - Professional context on Fibonacci retracement analysis within broader technical practice.cfainstitute.org
- CME Group Education - Background on technical retracement tools as applied across futures and broader markets.cmegroup.com
- FINRA: Day Trading Risk Disclosure - Regulatory guidance on the risks inherent in short-term, indicator-driven trading.finra.org