
The Pullback Trading Strategy: A Pro Guide to Buying Dips & Selling Rips

In this article11 sections
Most traders who "buy the dip" are really just buying a falling stock and hoping. There's a specific, narrow set of conditions where buying a dip is a genuinely high-probability trade — and a much larger set of conditions where the exact same action is how accounts get destroyed. The difference isn't intuition. It's a checklist.
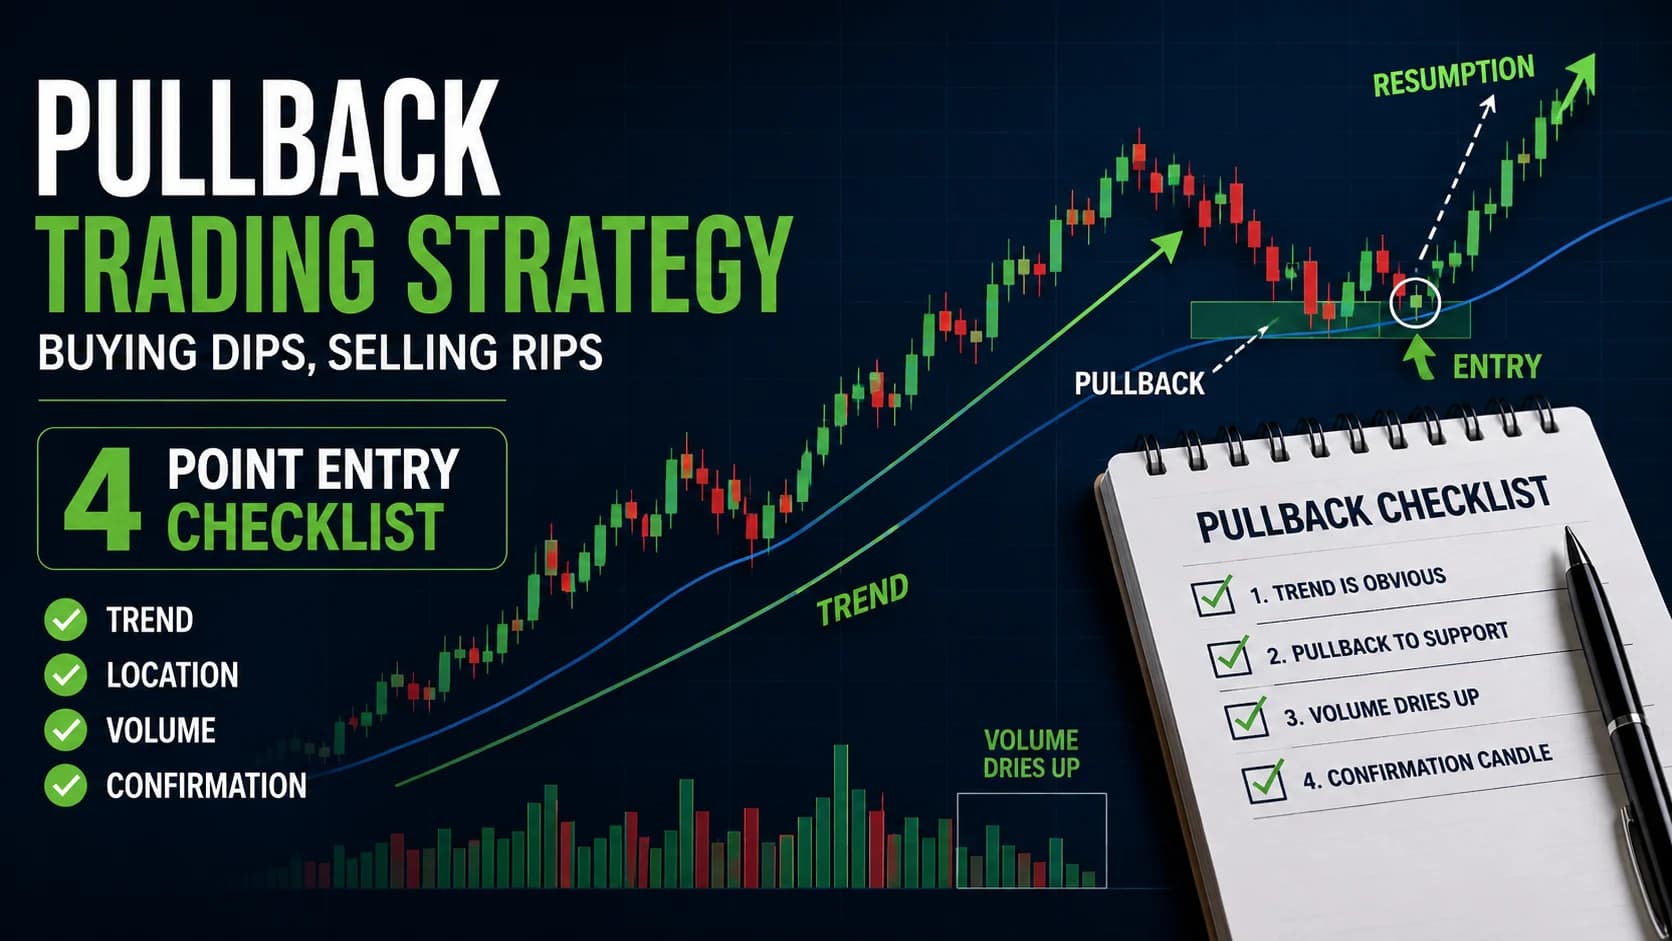
What is the pullback trading strategy? The pullback trading strategy involves entering a trade in the direction of an established trend after price temporarily retraces to a support level, then confirms a resumption. Traders buy dips in uptrends and sell rips in downtrends, using a mechanical checklist — trend strength, pullback location, volume behavior, and a confirmation candle — to separate a healthy pause from the start of a reversal.
Pullback Trading vs. Catching a Falling Knife
A pullback is a pause, not a reversal. Picture a stock climbing from $40 to $48 over three sessions on rising volume, then drifting back down to $45 over the next day and a half on noticeably lighter volume. That's a pullback — the market taking a breath before, potentially, continuing higher. Nothing about the underlying trend has changed. The stock simply ran out of short-term buyers and traded down until sellers ran out too.
A reversal looks similar on the surface and behaves completely differently underneath. The same stock drops from $48 to $43, but this time on volume that's heavier than anything seen during the uptrend, with wide, ugly candles and no hesitation. That's not a rest — that's distribution. Buying that dip is what traders call catching a falling knife, and it's the single most common way "pullback trading" gets a bad reputation.
This strategy is not a prediction tool. It doesn't tell you when a trend will start. It's an entry-timing framework for a trend that already exists and is already confirmed. If there's no trend, there's no pullback to trade — there's just a stock bouncing around inside a range, which is a completely different setup with its own rules.
It's also not a "buy the 20 EMA" system, even though the 20-period EMA shows up constantly in the walk-through below. The moving average is a location, not a signal. Plenty of pullbacks touch the 20 EMA and keep falling right through it. The checklist exists precisely because the touch, by itself, means almost nothing.
Best Market Conditions for a Pullback Entry
Pullback entries work best in stocks or index products with a clean, already-established directional trend — a series of higher highs and higher lows for longs, or lower highs and lower lows for shorts — on a timeframe you can actually see without squinting. This tends to show up most reliably in liquid mid-cap and large-cap names and structural ETFs like SPY and QQQ, where institutional participation creates cleaner technical reactions at moving averages and prior levels.
Time of day matters more than most traders assume. The first 15 to 20 minutes of the session are usually too noisy for this setup — volume is erratic, spreads are wide, and a "pullback" in the opening range is often just normal chop. The strongest window tends to run from roughly 10:00 AM to 3:00 PM ET, once the initial volatility has settled and the day's real trend has revealed itself. Pullbacks can still work into the final hour, but stops need to be tighter given the volatility that often creeps back in before the close.
Broad market conditions matter too. This setup tends to perform best when volatility is moderate rather than extreme — a VIX reading in a calmer, more orderly range generally produces cleaner trends with fewer violent, low-volume fakeouts. When volatility spikes sharply, trends can still exist, but the "quiet pullback" behavior this strategy depends on tends to break down, since panic and euphoria both show up as volume, not the absence of it.
The 4-Point Pullback Checklist (Setup Specification)
Every component below is a hard, mechanical rule. If a trade doesn't satisfy all four checklist points plus the entry, stop, and target rules, it isn't a pullback trade — it's a guess wearing a pullback's clothing.
- Component
- Market Conditions Required
- Rule
- Clean, established trend on the trading timeframe (higher highs/higher lows for longs, lower highs/lower lows for shorts); broader market not in acute high-VIX panic
- Component
- Time of Day
- Rule
- Strongest 10:00 AM–3:00 PM ET; avoid the first 15–20 minutes; tighten stops if trading into the final hour
- Component
- Stock Selection Criteria
- Rule
- Average daily volume above roughly 1 million shares; price generally above $10; RVOL confirming genuine trend participation, not a thin, illiquid drift
- Component
- Entry Trigger
- Rule
- Buy-stop (or sell-stop for shorts) 1–2 cents beyond the high (or low) of the confirmation candle, only after all 4 checklist points are satisfied
- Component
- Stop Loss
- Rule
- 1–2 cents beyond the low (or high) of the confirmation candle — mechanical, not discretionary
- Component
- Initial Profit Target
- Rule
- Prior swing high/low for a minimum 2:1 reward-to-risk; scale a portion there and trail the remainder
- Component
- Trade Management
- Rule
- Move stop to breakeven once the first target is hit; trail the remainder using higher lows (or lower highs)
- Component
- Invalidation Criteria
- Rule
- Confirmation candle's low (or high) breaks before the target is reached; volume spikes heavily against the position; the broader trend structure breaks
| Component | Rule |
|---|---|
| Market Conditions Required | Clean, established trend on the trading timeframe (higher highs/higher lows for longs, lower highs/lower lows for shorts); broader market not in acute high-VIX panic |
| Time of Day | Strongest 10:00 AM–3:00 PM ET; avoid the first 15–20 minutes; tighten stops if trading into the final hour |
| Stock Selection Criteria | Average daily volume above roughly 1 million shares; price generally above $10; RVOL confirming genuine trend participation, not a thin, illiquid drift |
| Entry Trigger | Buy-stop (or sell-stop for shorts) 1–2 cents beyond the high (or low) of the confirmation candle, only after all 4 checklist points are satisfied |
| Stop Loss | 1–2 cents beyond the low (or high) of the confirmation candle — mechanical, not discretionary |
| Initial Profit Target | Prior swing high/low for a minimum 2:1 reward-to-risk; scale a portion there and trail the remainder |
| Trade Management | Move stop to breakeven once the first target is hit; trail the remainder using higher lows (or lower highs) |
| Invalidation Criteria | Confirmation candle's low (or high) breaks before the target is reached; volume spikes heavily against the position; the broader trend structure breaks |
Point 1: The trend is obvious. If you have to talk yourself into seeing the trend, it isn't strong enough to trade. Look for a clear sequence of higher highs and higher lows (or the inverse for a downtrend), with the 20-period EMA sloped in the trend's direction and acting as dynamic support. This is the same moving average behavior covered in the guide to EMAs and SMAs for day trading — this strategy simply uses that foundation as a trend filter rather than a standalone signal.
Point 2: The location is logical. Random dips in the middle of nowhere aren't setups. The pullback needs to land on a level with a real reason to hold: the 20 or 50 EMA, a prior resistance level now acting as support (or vice versa in a downtrend), or a well-defined support or resistance zone from earlier price action. A pullback that stops two dollars short of any recognizable level is often just a trend running out of steam early — not a discount entry.
Point 3: The volume is weak. This is the single best tell available, and it's the one traders skip most often. A healthy pullback happens on visibly lighter volume than the preceding trend leg — it reads as profit-taking, not distribution. A sharp pullback on volume that matches or exceeds the trend leg's volume isn't a pause. That's usually the first sign the trend is actually reversing.
Point 4: A confirmation signal appears. Touching a level is not the same as holding it. The checklist requires a specific bullish reversal candle (a hammer, a bullish engulfing candle, or similar) forming right at the support level before any entry order goes in. In a downtrend, the mirror signal is a bearish candle — a shooting star or bearish engulfing pattern — forming at resistance. No confirmation candle, no trade, regardless of how good the other three points look.
Walk-Through Example: A Mid-Cap Tech Pullback
Consider a hypothetical mid-cap technology stock — call it XYZ, trading around $180 a share with typical daily volume well above the liquidity threshold this strategy requires.
The trend: XYZ has spent the past two weeks in a clean uptrend, posting a string of higher highs and higher lows, with the 20-day EMA sloped upward and sitting below price the entire time. Checklist point one: satisfied.
The pullback begins: After tagging a high of $189, XYZ drifts down over the next day and a half toward its rising 20 EMA, which sits near $178. The move down is orderly — no gaps, no panic candles.
The volume check: During the drift down, volume runs noticeably lighter than it did on the way up to $189. By 11:15 AM ET on the second day, RVOL has fallen to roughly 0.7, versus north of 2.0 during the prior up-leg. That's the signature of profit-taking, not selling pressure. Checklist points two and three: satisfied.
The confirmation candle: At 11:40 AM, XYZ touches $178.10 and prints a clean bullish hammer — a small body near the top of the candle's range with a long lower wick, closing at $178.90. The high of that hammer is $179.10. Checklist point four: satisfied. All four boxes are now checked.
Execution: The entry is a buy-stop at $179.20, ten cents above the hammer's high. The stop-loss goes at $177.90, ten cents below the hammer's low — a risk of $1.30 per share. The prior swing high of $189 becomes the initial target, offering roughly $9.80 of reward against $1.30 of risk — better than 7:1, though this guide's checklist only requires a 2:1 minimum before the trade qualifies.
What happens next: XYZ triggers the entry within the hour, grinds sideways for a stretch — a normal, unremarkable pause that would tempt an impatient trader to bail early — and then resumes the climb, eventually tagging $189 two sessions later. A trader following the trade-management rule above would have scaled a portion of the position at a 2:1 milestone near $182.10, moved the remaining stop to breakeven, and trailed the rest using the sequence of higher lows that formed on the way to $189.
Managing a Pullback Trade After the Bounce
Getting the entry right is only half the trade. Once filled, the position needs a plan that doesn't depend on guessing where the stock stops.
The first decision point is the initial target — the prior swing high or low. This guide's checklist treats that level as a scale-out point, not necessarily a full exit: take partial profit there, then move the stop on the remainder to breakeven. That single adjustment removes the risk of a full round-trip loss on a trade that was, at one point, working.
From there, trail the remaining position using the trend's own structure — each new higher low (in an uptrend) becomes the new stop reference once price confirms it's holding. This keeps the trader in a genuinely strong trend far longer than a fixed price target would, while still getting out mechanically the moment the trend's own rhythm breaks.
Avoid the temptation to move a stop further away to "give the trade room." A pullback trade's entire premise is that the confirmation candle marked the exact point where buyers took control. If price trades back through that level, the premise that justified the trade is gone — staying in on hope is a different trade than the one the checklist approved.
Why Confirmed Pullbacks Still Stall Out
This is the section that separates a real playbook from marketing copy, and pullback trading has real, specific failure modes worth naming plainly.
The most common failure isn't a broken trend — it's a confirmation candle that prints and then simply goes nowhere. The buy-stop triggers, the position fills, and price stalls within a point of entry for the rest of the session before drifting back to the stop. This happens often enough that it's worth expecting: a confirmation candle proves buyers showed up for one bar, not that they're committed for the rest of the day.
There's also a counterintuitive wrinkle worth knowing. The cleanest-looking pullbacks — a textbook touch of the 20 EMA, a picture-perfect hammer — are sometimes the ones most likely to stall, precisely because they're obvious. When a setup is visible to every trader watching the same chart, the resulting buy orders can get absorbed almost entirely by profit-taking from traders who bought the earlier leg up, leaving little net demand to push price meaningfully higher.
This setup also degrades badly in choppy, low-conviction conditions — the kind of tape common during summer sessions or extended holiday stretches, where RVOL runs persistently under 1.0. In that environment, price tends to oscillate around the 20 EMA without ever establishing the kind of directional separation needed to call a move a "trend" in the first place, which means checklist point one never gets satisfied honestly, no matter how much a trader wants it to.
Finally, this strategy fails hardest when the broader market disagrees with the individual stock. A textbook pullback in a single name, entered while the S&P 500 is breaking down on heavy volume, is fighting a current most individual stocks can't swim against for long.

Selling Rips and Other Pullback Variations
Selling rips in a downtrend: The entire framework mirrors cleanly. Replace "buy the dip" with "sell the rip" — wait for a low-volume rally into a resistance level (commonly a declining 20 or 50 EMA), then require a bearish confirmation candle like a shooting star or bearish engulfing pattern before entering short. Stop goes above the confirmation candle's high; target is the prior swing low.
Trading it on ETFs and index products: The same four-point logic applies cleanly to SPY, QQQ, and similar structural ETFs, often with cleaner technical reactions than individual stocks because there's no single-company news risk to distort the pattern.
Tightening for faster timeframes: Scalpers can run this same checklist on a 1- or 5-minute chart using the 9 EMA instead of the 20, though confirmation candles on faster timeframes are noisier and the strategy's edge narrows considerably. This guide's trend continuation strategy covers moving-average trend confirmation in more depth for traders who want the slower, higher-timeframe version of this same logic.
Combining with a broader pullback framework: This checklist is a tight, mechanical entry system rather than a full market-condition framework. For a wider look at how pullback opportunities behave across different trend strengths and volume regimes, this guide's companion piece on pullback trading in trends covers the broader diagnostic picture this checklist plugs into.
Scanning for Clean Pullback Setups
This strategy doesn't require exotic tools — clean charts, a way to see volume clearly, and (optionally) a way to find qualifying trends without manually scanning hundreds of charts.
A dependable charting platform is the non-negotiable piece. TradingView covers the core requirement: clean candlestick charts, customizable moving averages, and clear volume bars layered underneath price.
Finding candidates is the part that eats the most time manually. Trade Ideas is built as a full trading platform rather than a simple scanner — its real-time scanning engine can filter for stocks already in a confirmed uptrend with rising relative volume, and its Holly AI signals are backtested nightly against historical setups, which can help narrow the universe of trending stocks down to a manageable pre-market and intraday watchlist before this checklist is applied by hand. Traders who want to see current pricing and trial terms can check the deals page for current offers.
Where the Pullback Checklist Fits Your Trading Plan
Pullback trading is a trend-continuation entry method, which means it belongs in a trading plan alongside — not instead of — a broader read on market conditions. It pairs naturally with trend-day approaches on strongly trending sessions and should generally be set aside entirely on choppy, range-bound days where no clean trend exists to pull back from in the first place.
It also demands more patience than most beginner-friendly strategies, which is exactly why it gets skipped so often. The psychological cost is real: watching a stock run without you, waiting for a retracement that may or may not come, and then waiting again for a confirmation candle before acting. This guide's breakdown of trading discipline covers why that kind of structured patience is a trainable skill rather than a fixed personality trait — which matters here more than in almost any other setup, because the entire edge of this strategy depends on not acting until the checklist is actually complete.
Pullback Trading Strategy FAQ
How is the 4-point checklist different from just "buying the dip"?
The phrase "buy the dip" gets applied to almost any decline, including the start of a genuine reversal. The checklist exists specifically to filter out those false signals. A dip that fails even one of the four points — say, a trend that isn't clearly established, or a pullback happening on rising rather than falling volume — doesn't qualify under this framework, regardless of how tempting the lower price looks.
Key Takeaway: The checklist turns a vague instinct into four testable, mechanical conditions.
Which of the four checklist conditions fails most often on a real pullback?
It's an easy mistake to make because declining price on its own looks similar whether volume is light or heavy — the visual difference only shows up when a trader actually looks at the volume panel and compares bar heights directly against the up-leg that preceded it. Skipping that comparison is how traders end up buying the start of a reversal while believing they bought a pullback.
Key Takeaway: Always compare pullback volume directly against the preceding trend leg's volume, not against a vague sense of "quiet."
Why does the checklist require a confirmation candle instead of buying at the support level itself?
A moving average or prior resistance level is a location where buyers might step in — not proof that they will. Plenty of pullbacks slice straight through a level that looks like it should hold. Requiring a confirmation candle before entry means the trade is placed only after the market has already shown its hand, which sacrifices a small amount of price for a meaningfully higher-probability entry.
Key Takeaway: The confirmation candle converts a hopeful location into a confirmed reaction.
What happens if volume spikes during the pullback instead of drying up?
Heavy volume on a decline suggests active selling, not simply an absence of buyers. Even if the other three checklist points look reasonable, a volume spike against the trend is the single strongest disqualifying signal available, and it should override any temptation created by a clean-looking chart pattern elsewhere.
Key Takeaway: Rising volume on a pullback is a disqualifier, not a detail to explain away.
How do you apply the 4-point checklist to a downtrend?
Every mechanical rule flips direction: the entry becomes a sell-stop below a bearish confirmation candle's low, the stop-loss sits above that candle's high, and the target becomes the prior swing low. The underlying logic — trend, location, volume, confirmation — doesn't change at all.
Key Takeaway: This is one checklist applied in two directions, not two separate strategies.
What's the minimum reward-to-risk ratio the checklist requires?
That threshold comes from a simple mathematical reality: at a 2:1 ratio, a strategy only needs to win more than roughly 34% of the time to be net profitable before costs, giving meaningful room for error even on a setup that doesn't win every time. Trades offering less than 2:1 based on the prior swing high or low should generally be passed on entirely, regardless of how clean the checklist otherwise looks.
Key Takeaway: 2:1 is the floor, not the target — many qualifying setups offer considerably more.
Can this checklist be automated with a scanner, or does it require discretionary judgment?
A scanner can filter for stocks in a confirmed uptrend with rising relative volume during the trend leg and cooling volume during a pullback — that part is close to fully mechanical. Recognizing a genuine hammer or engulfing candle versus a similar-looking but weaker pattern is where experienced judgment still adds real value over a pure automated filter.
Key Takeaway: Scanners narrow the watchlist; the final confirmation call still benefits from trained eyes.
Why does the checklist use the 20 EMA instead of the 50 or 200-period average?
Longer moving averages smooth out price so heavily that a pullback often won't even reach them before the trend resumes, making them poor location references for this specific setup. The 50 EMA can still work as a secondary reference on stronger, longer-running trends, but the 20 EMA is the default because it tracks closely enough to actually get tested during a normal pullback.
Key Takeaway: Faster averages track pullbacks more reliably than slower ones on intraday and short-swing timeframes.
What's the difference between a checklist pullback and a panic bounce in a downtrend?
Panic bounces tend to reverse just as violently as they appeared, because they're driven by short covering rather than a genuine change in trend structure. This checklist's volume requirement is specifically designed to exclude that kind of bounce — a rally on heavy volume after a sharp drop fails Point 3 and shouldn't be mistaken for a qualifying setup in either direction.
Key Takeaway: Volume is what separates a genuine pause from a violent, unstable snap-back.
How many of the four checklist points can be skipped and still take the trade?
Each point exists to rule out a specific, common failure mode — no trend means there's nothing to continue, a poor location means the level was arbitrary, rising volume suggests distribution rather than rest, and no confirmation candle means the market hasn't actually shown its hand yet. A setup missing any one of the four isn't a weaker version of this strategy — it's a different, lower-probability trade wearing the same name.
Key Takeaway: The checklist works as a complete system; partial checklists are a different trade entirely.
Trading Pullbacks Isn't About Being Early
The whole appeal of this strategy is also its biggest psychological cost: it requires letting a stock move without you, sometimes for hours, before a qualifying entry ever appears. That's an uncomfortable trade-off for anyone wired to chase, but it's the trade-off that keeps pullback traders out of the reversals that wreck dip-buyers with no criteria at all.
Start by watching. Pick a handful of clearly trending stocks and track how they behave every time they touch a moving average or prior level — long before risking a dollar on it. Once the pattern is familiar, apply the four-point checklist without exception. A setup that misses even one box isn't a smaller version of this trade. It's a different trade, and one this strategy was built specifically to avoid.
For other setups built around trend, range, and volatility conditions, this guide's full Strategies hub breaks down the complete library by market regime.
Article Sources
- Jegadeesh & Titman, "Returns to Buying Winners and Selling Losers" (1993), Journal of Finance - the foundational academic study establishing that price trends exhibit statistically significant continuation over multi-month horizons.
- Barber, Lee, Liu & Odean, "The Cross-Section of Speculator Skill: Evidence from Day Trading" (2014), Journal of Financial Markets - large-sample research on day trader outcomes used to frame this guide's honest expectations around win rates and skill persistence.
- Barber, Lee, Liu, Odean & Zhang, "Learning, Fast or Slow" (2020), Review of Asset Pricing Studies - longitudinal data on day trader survival rates cited in this guide's risk framing.
- StockCharts ChartSchool: Moving Averages - reference for EMA calculation and standard trend-following conventions.
- StockCharts ChartSchool: Candlestick Pattern Dictionary - reference for standard hammer and engulfing candle definitions used in this guide's confirmation-signal criteria.
Was this helpful?
Be the first to weigh in

Written by
Kazi Mezanur RahmanFounder, independent researcher, and editor of DayTradingToolkit. A one-person publication focused on risk-first trading education and documented tool research. He trades his own capital as a retail trader and combines personal market experience with systematic primary-source research.
Keep Reading
Strategies
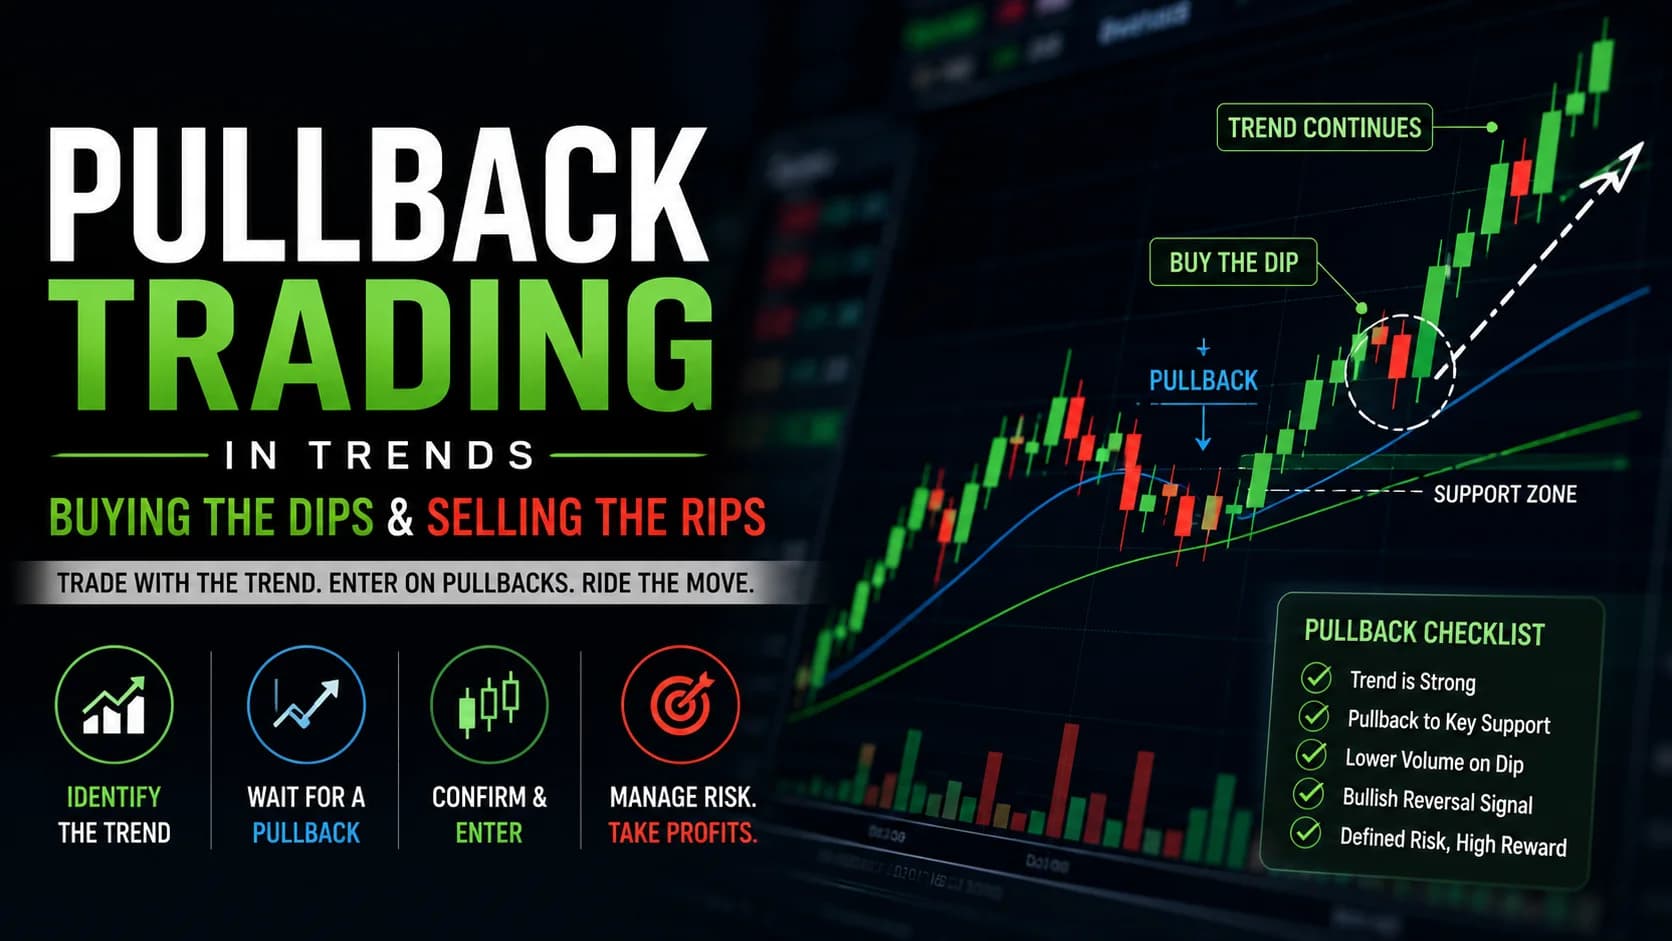
Buying the Dips & Selling the Rips: Mastering Pullback Trading in Trends
Master pullback trading with our framework for identifying high-probability dips in uptrends and rips in downtrends. Entry methods, volume diagnostics, and failure modes.
Strategies
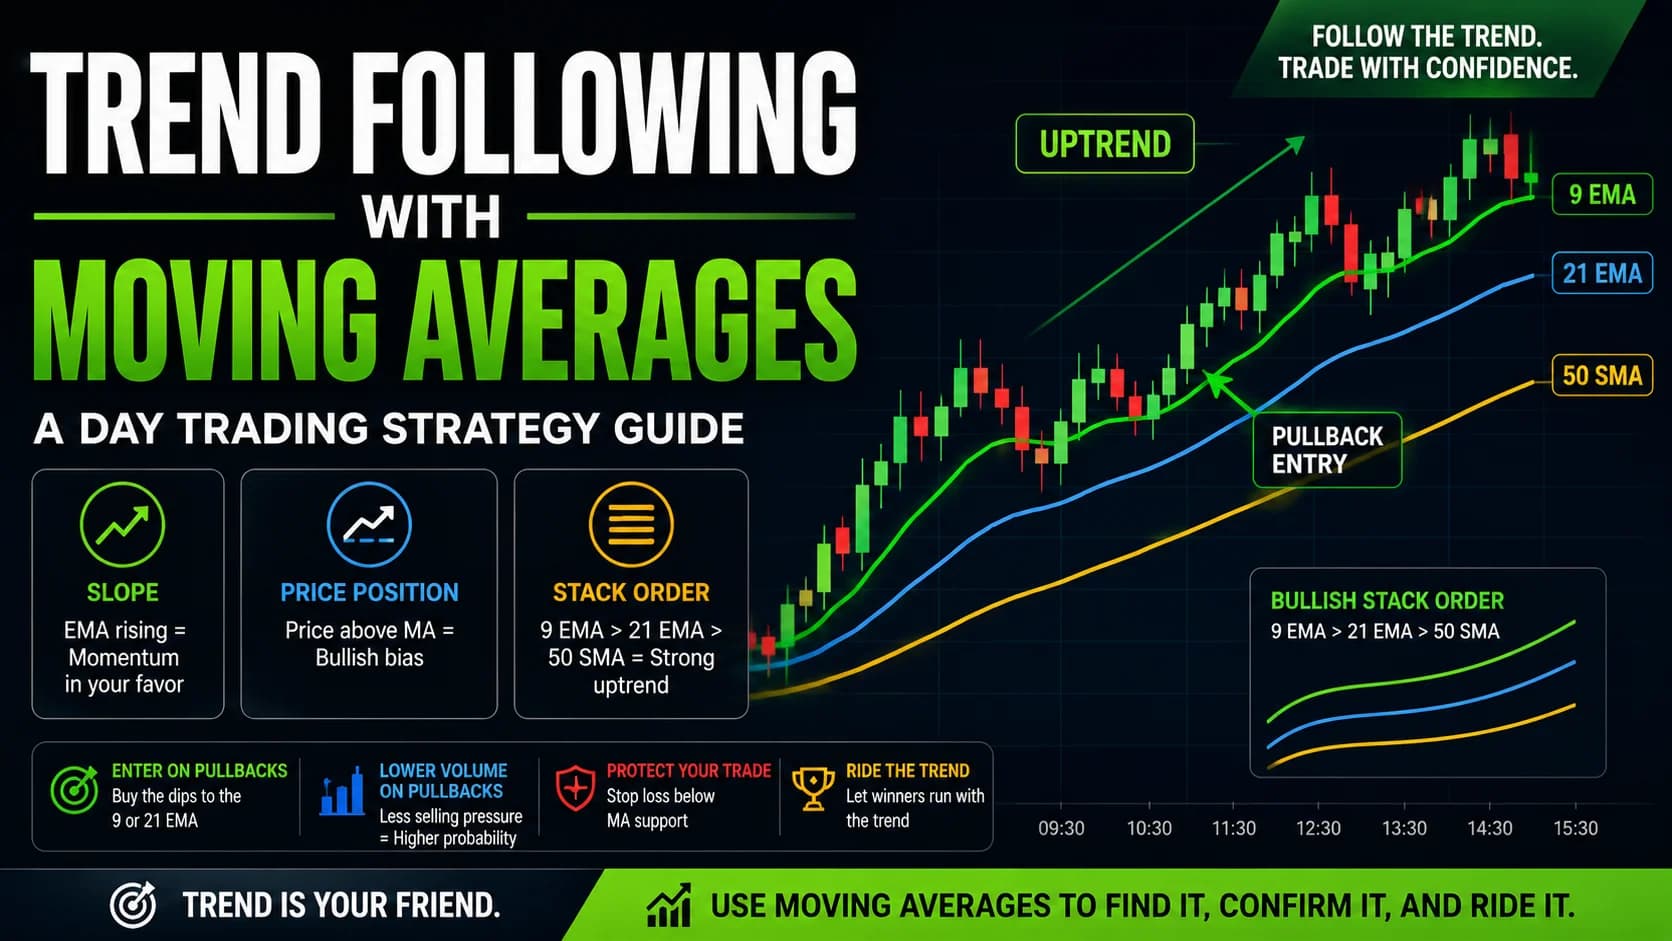
Riding the Wave: A Deep Dive into Trend Following with Moving Averages
Stop trading MA crossovers. Learn the three MA signals that actually work — slope, price position, and stack order — plus the full setup spec for 9/21 EMA trend trading.
Strategies
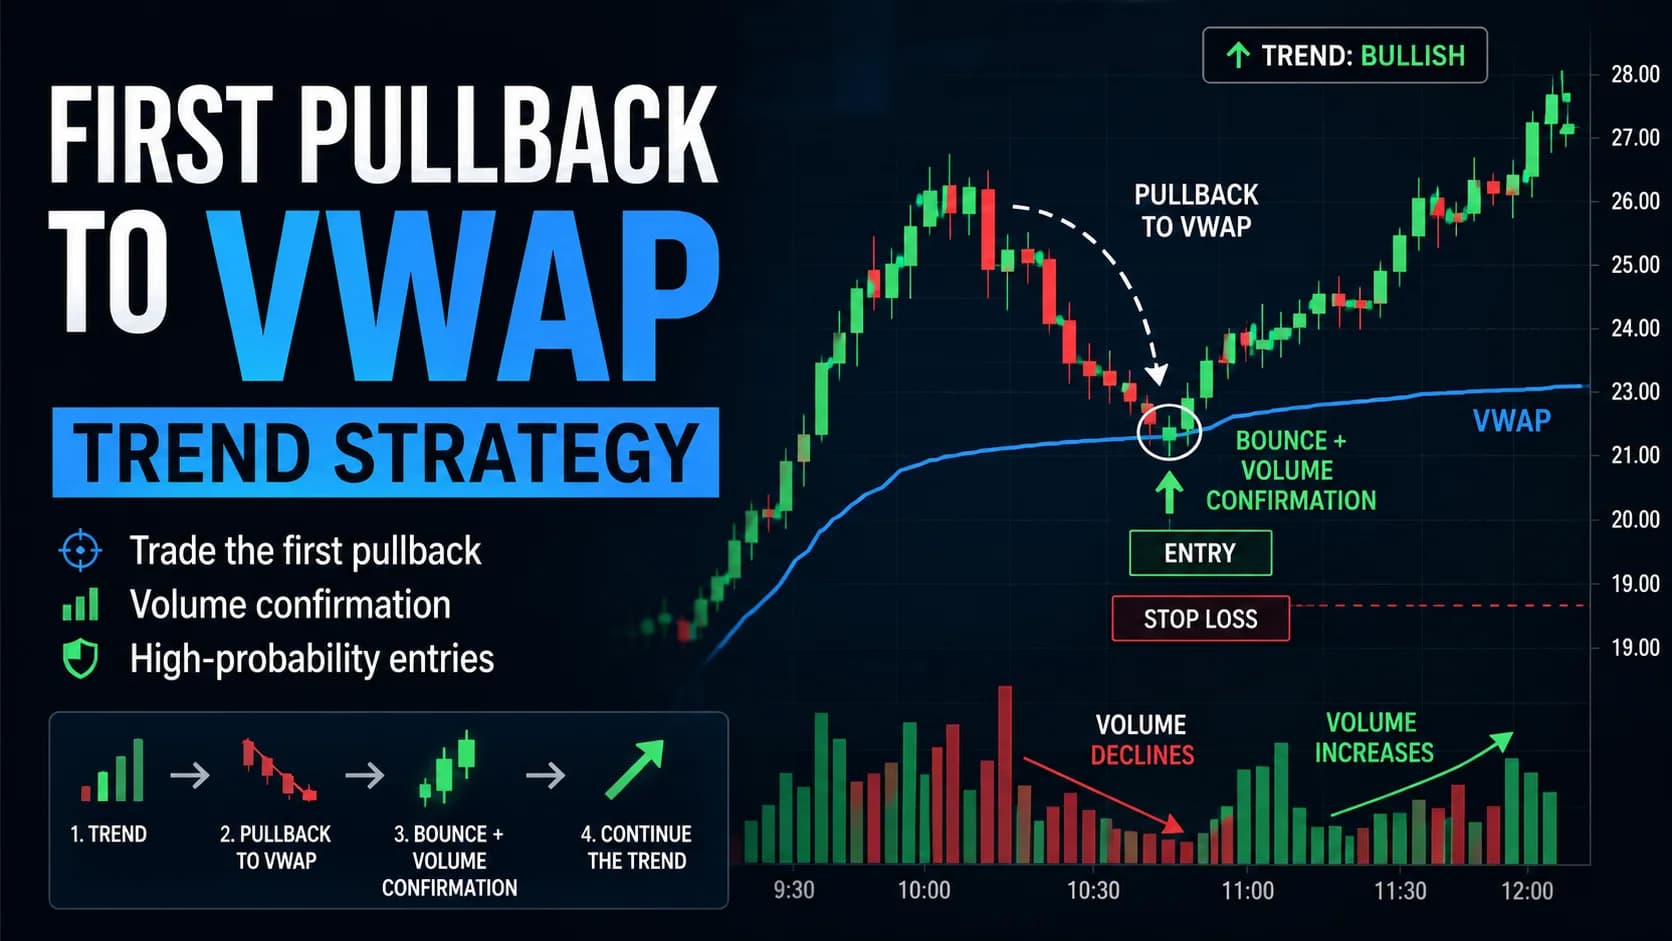
Trading the First Pullback to VWAP in a Trending Stock
A mechanical checklist for trading the first pullback to VWAP in a trending, catalyst-driven stock — volume confirmation, exact entry and stop rules, and an honest look at when this popular setup fails.
Strategies
The Anchored VWAP Trend Strategy for Day Traders
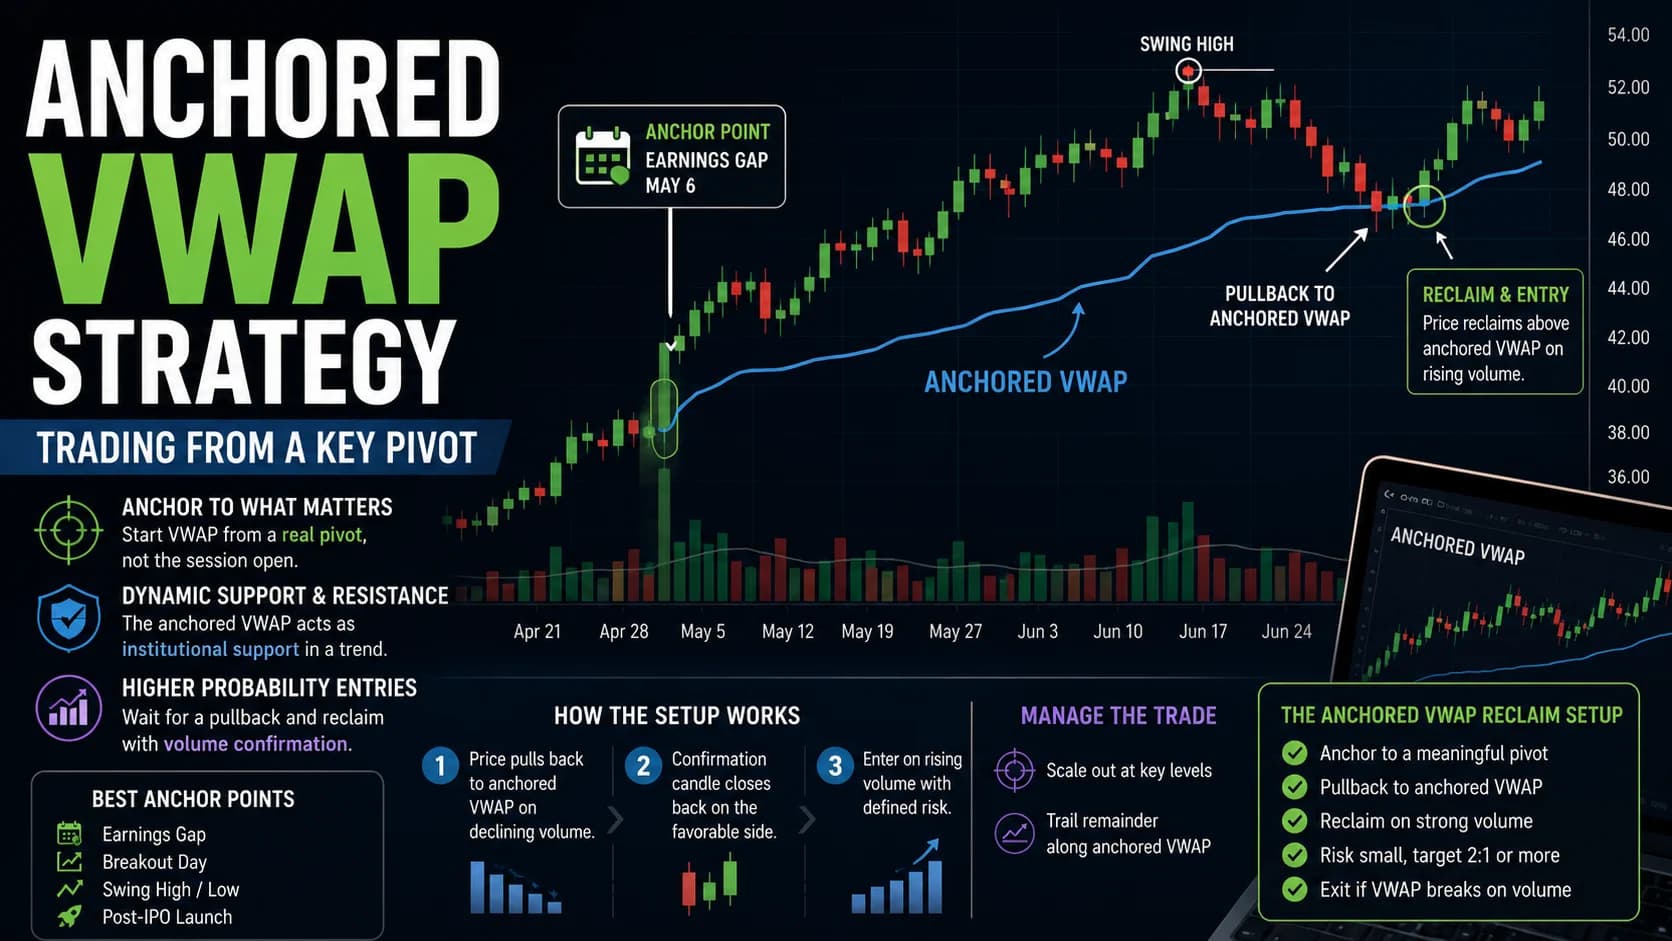
The anchored VWAP trading strategy: how to pick a genuine anchor point (a gap, a swing point, a breakout), trade the pullback with volume confirmation, and manage a multi-day anchored position.
Comments
No comments yet. Be the first to share your thoughts.