
Trading the First Pullback to VWAP in a Trending Stock

In this article10 sections
A stock gaps up on a catalyst, rips higher in the first fifteen minutes, then does something that scares off most traders watching it: it stops going up. That first pause back toward the volume-weighted average price isn't weakness. For a specific, narrow kind of trending stock, it's the highest-quality entry the whole session will offer.
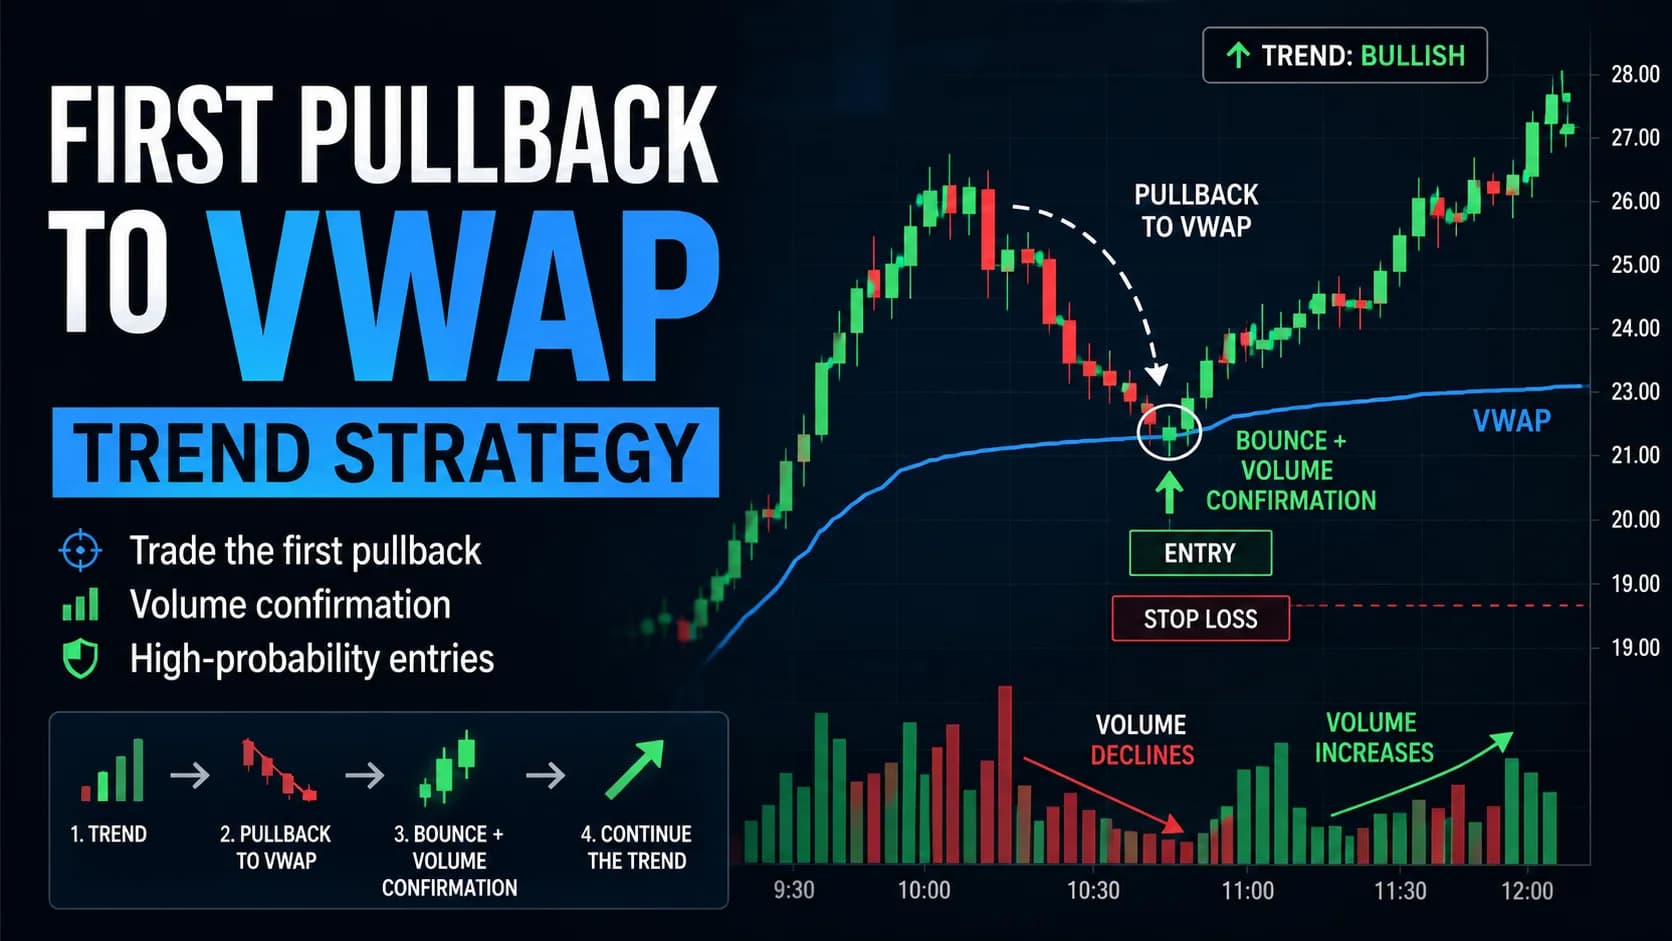
What is the first pullback to VWAP strategy? The first pullback to VWAP strategy enters in the direction of an established intraday trend the first time price retraces to touch the volume-weighted average price (VWAP) after an opening move, provided the retracement shows declining volume followed by a confirmed bounce on rising volume. It's a continuation trade built around VWAP's role as the session's institutional benchmark rather than around a lagging, calculated moving average.
VWAP Pullbacks vs. Trading a Moving Average
VWAP — the volume-weighted average price — is not just another line on a chart. It's the actual average price every share traded at during the session, weighted by how much volume traded at each level, and it resets fresh at the open every single day. This guide's VWAP basics explainer covers the calculation and definition in more depth; this article assumes that foundation and focuses on trading the first pullback specifically. Large institutional desks are benchmarked against it: buying below VWAP or selling above it is treated internally as a good execution. That institutional habit is what gives VWAP more weight as a support and resistance level than an arbitrary line would carry on its own.
This is meaningfully different from an EMA-based pullback checklist. A moving average is a rolling calculation that necessarily lags behind price. VWAP is a running average of everything that has actually traded since the open, weighted by real volume — it's less a trend-following tool and more a real-time record of the day's actual transaction history.
It's worth being direct about something the broader trading-education world doesn't always agree on: whether the very first touch of VWAP is genuinely the highest-probability one. Some practitioners argue the first pullback works best because it represents the first chance for sidelined buyers to get in at the institutional average. Others argue the opposite — that the first test can fail more often because early profit-takers are still exiting, and that the second or third test, once the level has already proven itself, is the safer entry. This guide's position: the ordinal position alone isn't what makes the trade work. The volume signature around the touch is what matters, and the checklist below is built to require that signature regardless of whether it's the first test of the day or the third.
The Best Time of Day for a VWAP Pullback
This setup needs a real catalyst — a gap, an earnings surprise, sector-wide news, anything that produces a stock trending with genuine conviction rather than drifting. A stock with no story behind its move has no reason for institutional flow to be defending VWAP as a level, and the setup loses its foundation.
Time of day matters more here than with almost any other setup in this guide. VWAP is most informative in the first 90 minutes of the session (9:30–11:00 AM ET) and again in the final hour (3:00–4:00 PM ET), when volume and institutional participation are both elevated. The stretch from roughly 11:30 AM to 1:30 PM ET is a well-known dead zone — volume dries up, spreads widen, and VWAP touches during this window are considerably less reliable. Late in the session, past roughly 3:00 PM ET, VWAP itself starts to flatten out under the weight of the day's accumulated volume, which makes fresh touches less meaningful than they were earlier in the day.
The setup also depends on the stock having established real separation from VWAP before the pullback even begins. A stock that's barely above VWAP to start with doesn't offer a meaningful pullback — it offers noise.
The First Pullback to VWAP Setup (Setup Specification)
Every component below is a hard rule. The entry doesn't fire on proximity to VWAP alone — it fires on a specific volume signature confirming the level is actually holding.
- Component
- Market Conditions Required
- Rule
- Stock has a genuine catalyst (gap, news, earnings) and has held clearly above VWAP since the open with visible separation; broader market (SPY/QQQ) not breaking down against the trade direction
- Component
- Time of Day
- Rule
- Strongest 9:45–11:00 AM ET and 2:00–3:00 PM ET; avoid the 11:30 AM–1:30 PM ET midday lull and anything after roughly 3:30 PM ET when VWAP flattens
- Component
- Stock Selection Criteria
- Rule
- Elevated relative volume tied to a real catalyst; average daily volume above roughly 1 million shares; price already showing clear separation above VWAP before the pullback
- Component
- Entry Trigger
- Rule
- Price touches or briefly dips to VWAP on visibly declining volume, then a confirmation candle closes back above VWAP on a volume increase; buy-stop 1–2 cents above that candle's high
- Component
- Stop Loss
- Rule
- 1–2 cents below VWAP itself, or below the pullback's low if that sits further away
- Component
- Initial Profit Target
- Rule
- Prior high of day, or a measured move projected from VWAP equal to the distance from VWAP to the opening push's high, for a minimum 2:1 reward-to-risk
- Component
- Trade Management
- Rule
- Scale a portion at the first target; move stop to breakeven; trail the remainder along VWAP or the 9 EMA
- Component
- Invalidation Criteria
- Rule
- Price closes decisively below VWAP on rising volume; or price chops back and forth across VWAP repeatedly, signaling the trending regime has broken down
| Component | Rule |
|---|---|
| Market Conditions Required | Stock has a genuine catalyst (gap, news, earnings) and has held clearly above VWAP since the open with visible separation; broader market (SPY/QQQ) not breaking down against the trade direction |
| Time of Day | Strongest 9:45–11:00 AM ET and 2:00–3:00 PM ET; avoid the 11:30 AM–1:30 PM ET midday lull and anything after roughly 3:30 PM ET when VWAP flattens |
| Stock Selection Criteria | Elevated relative volume tied to a real catalyst; average daily volume above roughly 1 million shares; price already showing clear separation above VWAP before the pullback |
| Entry Trigger | Price touches or briefly dips to VWAP on visibly declining volume, then a confirmation candle closes back above VWAP on a volume increase; buy-stop 1–2 cents above that candle's high |
| Stop Loss | 1–2 cents below VWAP itself, or below the pullback's low if that sits further away |
| Initial Profit Target | Prior high of day, or a measured move projected from VWAP equal to the distance from VWAP to the opening push's high, for a minimum 2:1 reward-to-risk |
| Trade Management | Scale a portion at the first target; move stop to breakeven; trail the remainder along VWAP or the 9 EMA |
| Invalidation Criteria | Price closes decisively below VWAP on rising volume; or price chops back and forth across VWAP repeatedly, signaling the trending regime has broken down |
The volume signature is the actual signal — not the touch itself. A stock merely arriving at VWAP proves nothing. What separates a genuine pullback from the start of a breakdown is volume drying up as price approaches the line, followed by a visible pickup in volume the moment the bounce candle forms. That sequence — declining into the touch, rising on the reaction — is the checklist's real trigger, and it applies whether this is the session's first VWAP test or its third.
A confirmed close above VWAP is required before the entry, not a wick through it. A brief dip below VWAP that immediately reclaims it on the same candle is a normal, healthy part of the pullback. A candle that closes below VWAP changes the read entirely — at that point the trade is no longer a bounce, it's a potential reclaim setup with a different risk profile.

Walk-Through Example: A Catalyst Gapper's First VWAP Test
Consider a hypothetical mid-cap consumer stock — call it GHI, gapping up 9% pre-market on an earnings beat.
The open and the push: GHI opens at $52.00 and rips to $55.40 in the first 20 minutes on heavy relative volume. VWAP, still forming, sits near $53.60 by the time the initial push slows down.
The pullback: Starting around 10:10 AM, GHI drifts down from $55.40 as early profit-takers sell into strength. Volume noticeably decreases through the drift — this is the checklist's first required signal.
The touch and confirmation: At 10:35 AM, GHI touches $53.65 — just above VWAP — and prints a strong bullish candle on a clear pickup in volume, closing at $54.30. The candle's high is $54.45.
Execution: The entry is a buy-stop at $54.55, ten cents above the confirmation candle's high. The stop-loss goes at $53.45, twenty cents below VWAP — a risk of $1.10 per share. Using the measured-move approach, the distance from VWAP ($53.60) to the opening push high ($55.40) is $1.80; projected from the VWAP touch at $53.65, that gives a target near $55.45 — close to the actual prior high of day at $55.40, and offering roughly $1.75 of reward against $1.10 of risk, comfortably above this guide's 2:1 minimum.
What happens next: GHI triggers the entry, works through $55.40, and continues to a new high near $57 into the early afternoon. A trader following the management plan would scale a portion near $55.45, move the remaining stop to breakeven, and trail the rest along VWAP or the 9 EMA as the trend extends.
Trailing a Stop Along a Rising VWAP
Once the first target is reached, moving the stop to breakeven removes the risk of a full round-trip on a trade that was working. From there, VWAP itself can serve as a trailing reference — as long as price continues holding above a rising VWAP, the trend's basic premise remains intact.
Because VWAP flattens as the session accumulates volume, its usefulness as a trailing tool degrades somewhat in the afternoon. Many traders switch to trailing behind the 9 EMA or the sequence of intraday higher lows once VWAP's slope stops providing much new information, particularly after the early-afternoon lull has passed.
Why the "First Pullback" Rule Isn't Absolute
The most honest thing to say about the "first pullback" framing is that it isn't a settled statistical law — it's a widely repeated heuristic, and reasonable, experienced traders disagree about it. Some argue the first test is the cleanest because it's untested by anyone else yet; others argue it fails more often precisely because the stock hasn't proven the level will hold. Treating "it's the first pullback" as sufficient justification on its own, without the volume confirmation this guide's checklist requires, is a real failure mode — the ordinal position isn't a substitute for genuine evidence that buyers are actually defending the level.
This setup also fails reliably in the midday lull. Volume dries up broadly between roughly 11:30 AM and 1:30 PM ET, which means the "declining volume into the touch, rising volume on the bounce" signature this checklist depends on becomes much harder to read cleanly — there's less volume overall to show a meaningful contrast.
A stock that chops back and forth across VWAP repeatedly, rather than cleanly pulling back to it once, is signaling that the trending regime itself has broken down. Under those conditions, VWAP stops behaving like a level institutions are defending and starts behaving like the middle of an ordinary range — trading it as a trend-continuation level at that point is fighting what the price action is actually showing.
Finally, this setup depends entirely on a real catalyst existing in the first place. A stock drifting up on light, catalyst-free volume doesn't have the institutional participation that makes VWAP meaningful, and a "pullback" on a stock like that is closer to noise than to genuine order flow.
VWAP Reclaims, Short Setups, and Later Tests
Applying the mirror logic to a downtrend: Everything reverses cleanly for a stock gapping down or breaking down on a catalyst — the first rip back up to VWAP on declining volume, followed by a bearish confirmation candle on rising volume, becomes the short entry, with the stop just above VWAP and the target at the prior low of day.
The VWAP reclaim, a related but distinct setup: A reclaim is a different trade from a bounce — it applies when a stock has been trading below VWAP and breaks back above it and holds, rather than staying above VWAP throughout a shallow pullback. A reclaim is a more aggressive entry, betting that a battle sellers initially won is now flipping to buyers, and it typically warrants a wider stop than a clean bounce.
Waiting for the second or third test instead of the first: Given the genuine disagreement over which touch is highest-probability, a more conservative variation simply skips the first test and waits for VWAP to prove itself over multiple touches before committing — trading fewer signals per day in exchange for a level that's already demonstrated it holds.
Confluence with the 9 EMA: When VWAP and the 9 EMA converge at roughly the same price, a bounce from that combined zone carries more weight than either level would on its own, since two independently calculated references are agreeing. The same confluence logic applies to this guide's market structure strategy — a VWAP bounce that also confirms a higher low under that framework is a stronger signal than either read alone.
Scanning for Gappers That Hold Above VWAP
TradingView plots VWAP natively and makes it straightforward to watch the volume panel alongside the VWAP line in real time, which is essential for reading the declining-then-rising volume signature this checklist depends on.
Finding catalyst-driven gappers with genuine relative volume before the session even opens is where a scanner earns its keep. Trade Ideas can filter pre-market for stocks gapping on news with elevated relative volume, narrowing the day's watchlist down to names actually likely to produce a tradeable VWAP setup rather than random noise. Traders comparing current pricing can check the deals page for active offers.
Fitting VWAP Pullbacks Into a Trading Plan
This is another trend-continuation entry method, and it pairs naturally with a broader read of the day's overall conditions — genuinely useful on strong catalyst-driven trend days, and worth sitting out entirely on quiet, catalyst-free, choppy sessions where VWAP has nothing institutional behind it to defend.
The setup also asks for real patience: watching a stock rip higher without you for the first fifteen or twenty minutes, then waiting for it to actually come back and prove the pullback is holding before acting. This guide's breakdown of finding patience and staying objective covers exactly this tension — the urge to chase the initial move is strongest right when the setup requires doing the opposite. For other trend-continuation setups built around different reference points, this guide's full Strategies hub breaks down the complete library by market regime.
First Pullback to VWAP FAQ
Is the first pullback to VWAP really the highest-probability one?
The case for the first test is that it's the first opportunity for sidelined buyers to enter at the institutional average, before the level gets diluted by repeated testing. The case against it is that early profit-takers are often still exiting during that first pullback, which can make it fail more often than a level that's already proven itself on a second or third touch. This guide's approach sidesteps the disagreement by requiring the same volume confirmation regardless of which test it is.
Key Takeaway: Don't rely on "it's the first test" alone — require the volume signature every time, no matter which touch it is.
What's the difference between a VWAP bounce and a VWAP reclaim?
A bounce is the more conservative version — the dominant trend never really broke, and the pullback is shallow. A reclaim is a more aggressive bet that a level sellers had already won is now flipping back to buyers, which typically means a wider stop and a somewhat lower-probability, higher-reward trade.
Key Takeaway: A bounce trades an intact trend; a reclaim trades a trend fighting its way back.
Why does this setup become unreliable during the midday lull?
With less overall participation during this window, a "decline" in volume approaching VWAP may just reflect the entire market's midday slowdown rather than anything specific to the stock. The contrast this setup depends on gets muddied when overall activity is already thin.
Key Takeaway: Low baseline volume during the lull makes the volume signature unreliable — the setup works better outside that window.
Why does VWAP flatten out later in the trading day?
Early in the session, a single strong push can move VWAP meaningfully. By mid-afternoon, VWAP is effectively summarizing the average price of the whole day up to that point, and incremental price action has comparatively little impact on where the line sits. This is why fresh touches late in the day carry less new information than touches earlier in the session.
Key Takeaway: A flattening VWAP late in the day is expected math, not a signal on its own.
How is trading VWAP different from trading a pullback to a moving average?
VWAP's institutional benchmark role gives it a self-reinforcing quality that a plain EMA doesn't carry — large trading desks are actually measured against it, which creates real defending flow at the level. A moving average has no equivalent institutional mandate behind it; its usefulness comes purely from how widely traders happen to watch it.
Key Takeaway: VWAP's edge comes partly from institutional benchmarking behavior; a moving average's edge comes purely from trader consensus.
Does this setup work without a news catalyst?
A catalyst-free drift can still technically produce a VWAP touch, but there's little reason to expect any institutional flow defending that specific level if there's no real story behind the stock's movement that day. The setup is built around catalyst-driven trend days specifically, not generic price wandering.
Key Takeaway: No catalyst generally means no real institutional flow behind the level — skip the setup on those days.
How do you apply this strategy to a downtrend or short side?
The stop sits just above VWAP, and the target projects to the prior low of day or a measured move calculated the same way as the long version, just inverted. Every mechanical rule flips direction; the underlying logic of volume confirmation stays identical.
Key Takeaway: This is one framework applied in two directions, not two separate strategies.
What is a measured-move target from VWAP?
If a stock pushed from VWAP up to a high $2 away before pulling back, projecting that same $2 distance from the VWAP touch gives a concrete target level. This tends to land near the prior high of day in practice, which is why many traders use the two interchangeably, but the measured-move calculation gives a specific number to work with even when the prior high isn't perfectly clean.
Key Takeaway: Measured moves turn "aim higher" into an actual, calculable price target.
Can this strategy be scanned for or automated?
A scanner can narrow the day's watchlist down to stocks with real catalysts and elevated relative volume holding above VWAP, which does most of the heavy lifting before the setup even needs to be watched manually. Confirming that volume is genuinely declining into the touch and picking up on the bounce is a more nuanced, real-time read that's harder to fully automate reliably.
Key Takeaway: Let a scanner build the watchlist; keep the volume-signature confirmation as a live, human judgment call.
What should the stop-loss be based on — VWAP itself or the pullback low?
Using VWAP alone as the stop reference can occasionally place the stop uncomfortably close to price if the pullback barely dipped below the line. Checking both the VWAP level and the actual candle low, and using whichever is more conservative, protects against getting stopped out on ordinary noise around the line.
Key Takeaway: Use whichever is further away — VWAP or the pullback's actual low — as the real stop reference.
Article Sources
- Investopedia: Volume-Weighted Average Price (VWAP) - reference for the standard VWAP definition and calculation.
- CME Group: Benchmark Administration - reference for VWAP's role as a formal institutional execution benchmark across asset classes.
- Alphatrends: Anchored VWAP - Brian Shannon, CMT, is a widely cited authority on VWAP and Anchored VWAP methodology in modern technical analysis; referenced here for the institutional-flow framing behind VWAP as a support and resistance level.
- Madhavan, A. (2002), research on VWAP as an institutional trading benchmark — referenced for the historical adoption of VWAP as standard practice among pension funds and asset managers.
- StockCharts ChartSchool - reference for standard VWAP charting conventions used throughout this guide.
Was this helpful?
Be the first to weigh in

Written by
Kazi Mezanur RahmanFounder, independent researcher, and editor of DayTradingToolkit. A one-person publication focused on risk-first trading education and documented tool research. He trades his own capital as a retail trader and combines personal market experience with systematic primary-source research.
Keep Reading
Strategies
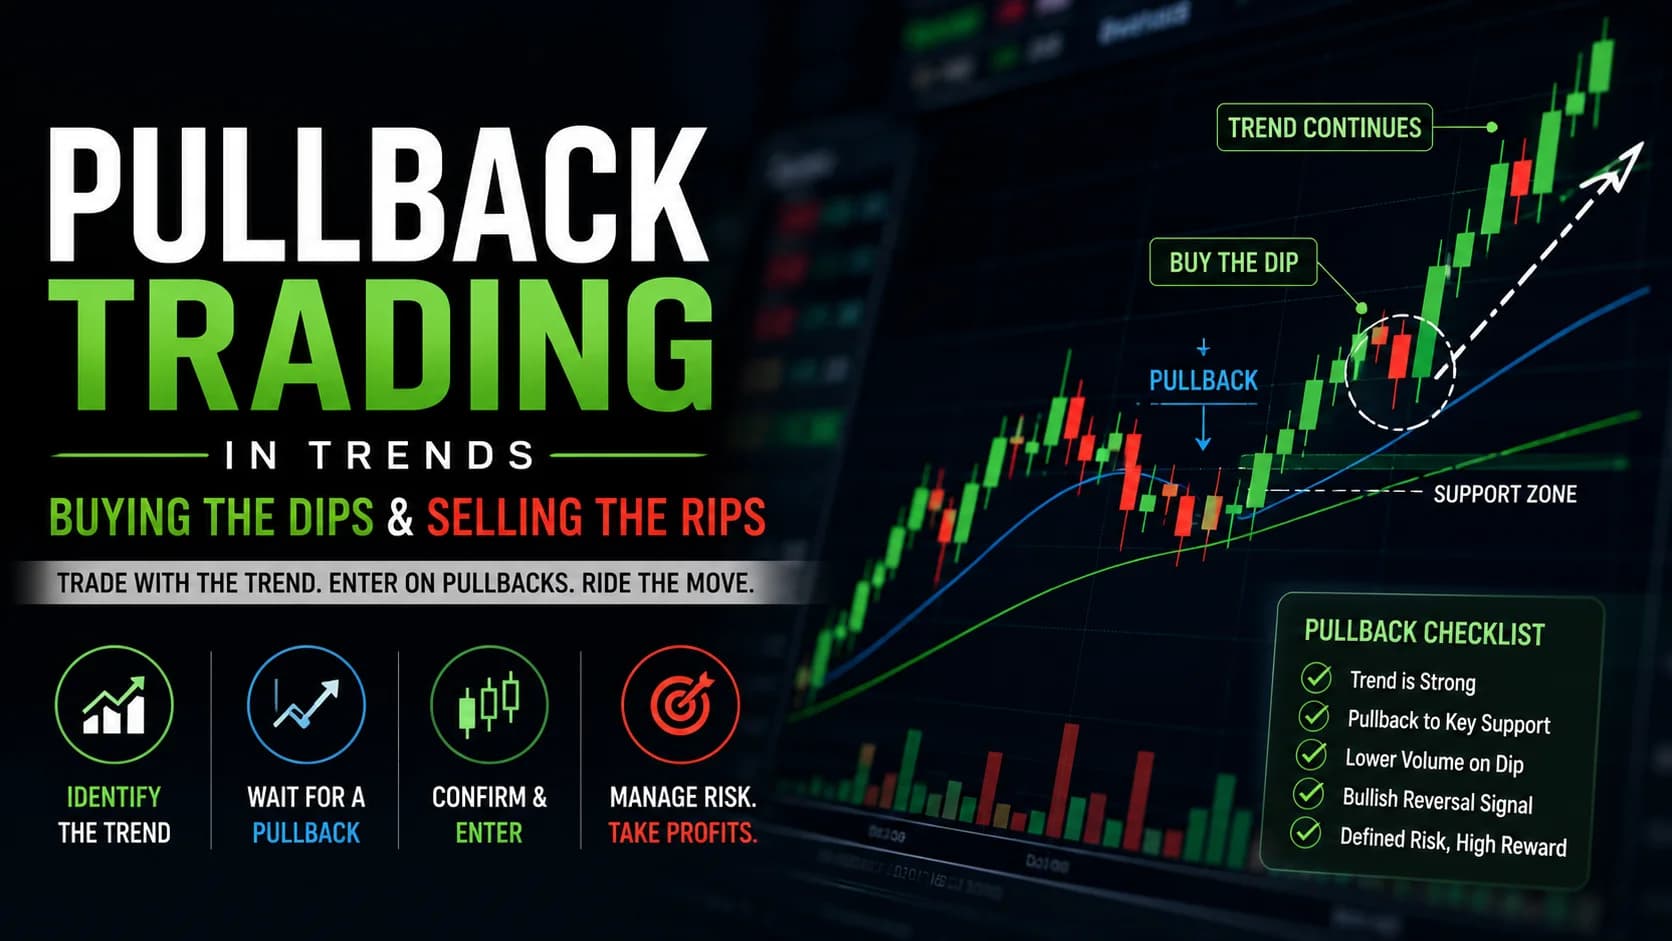
Buying the Dips & Selling the Rips: Mastering Pullback Trading in Trends
Master pullback trading with our framework for identifying high-probability dips in uptrends and rips in downtrends. Entry methods, volume diagnostics, and failure modes.
Strategies
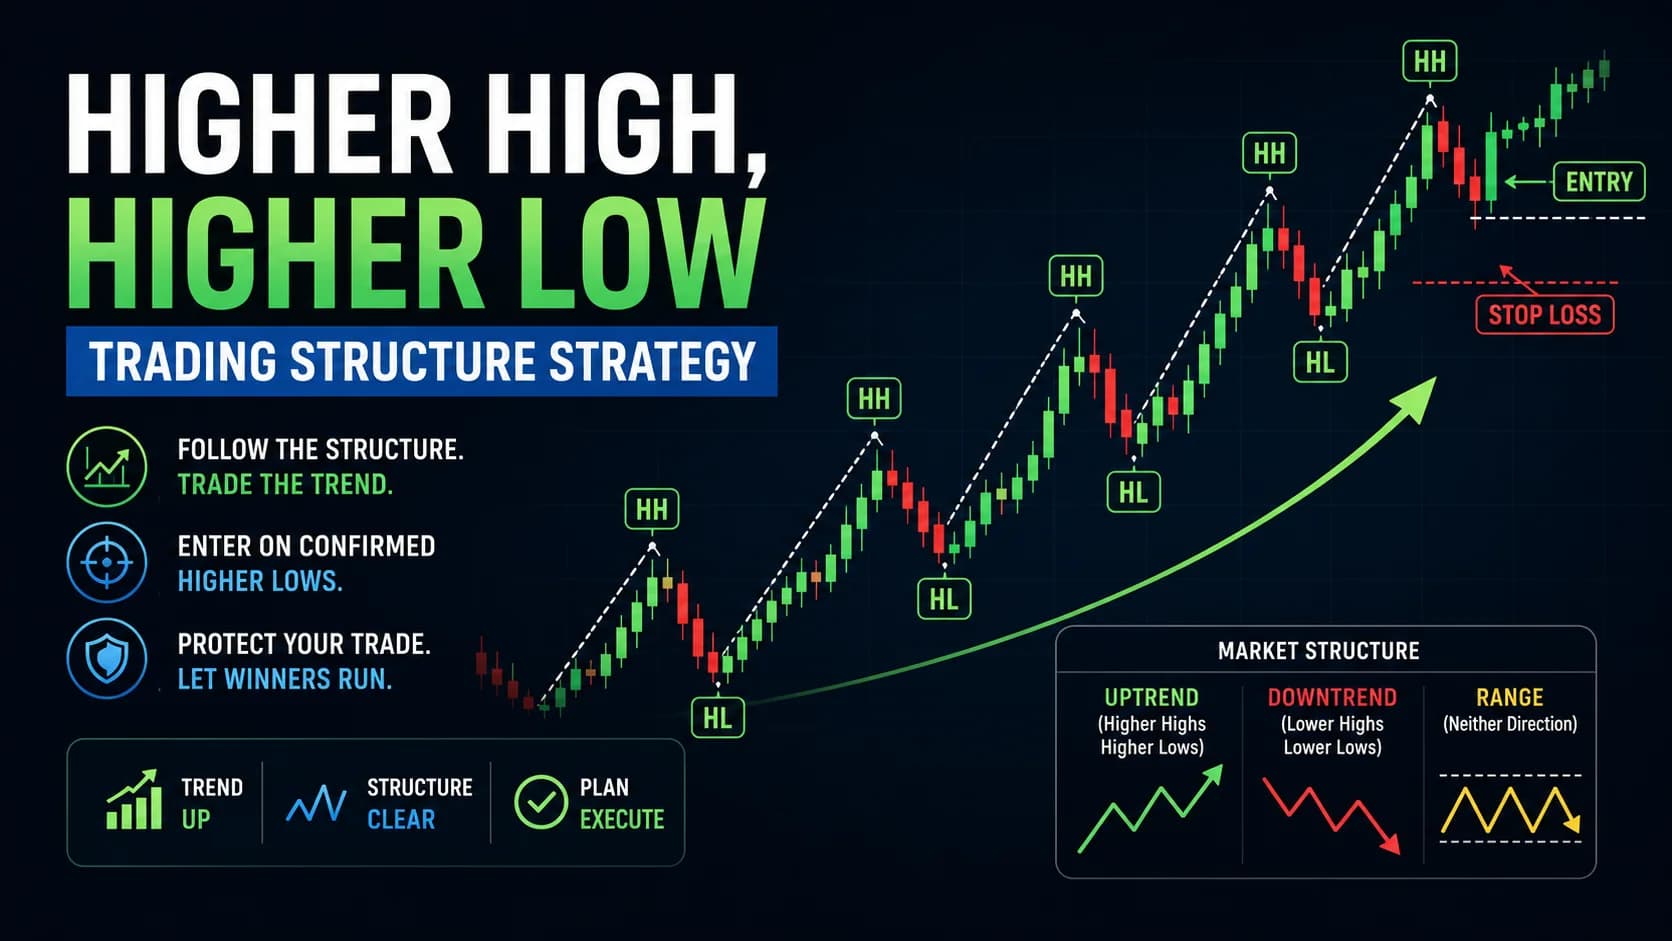
The Higher High, Higher Low Trading Strategy (Market Structure Basics)
A mechanical market structure trading strategy built on Dow Theory's higher-high, higher-low framework: how to confirm swing points, enter continuations, and spot a real break of structure.
Beginner’s Guide
VWAP Explained: The Day Trader's Most Important Indicator
Learn what VWAP is, why institutional traders obsess over it, and 3 simple ways beginners can use this powerful day trading indicator. Plain English guide.
Strategies
The Anchored VWAP Trend Strategy for Day Traders
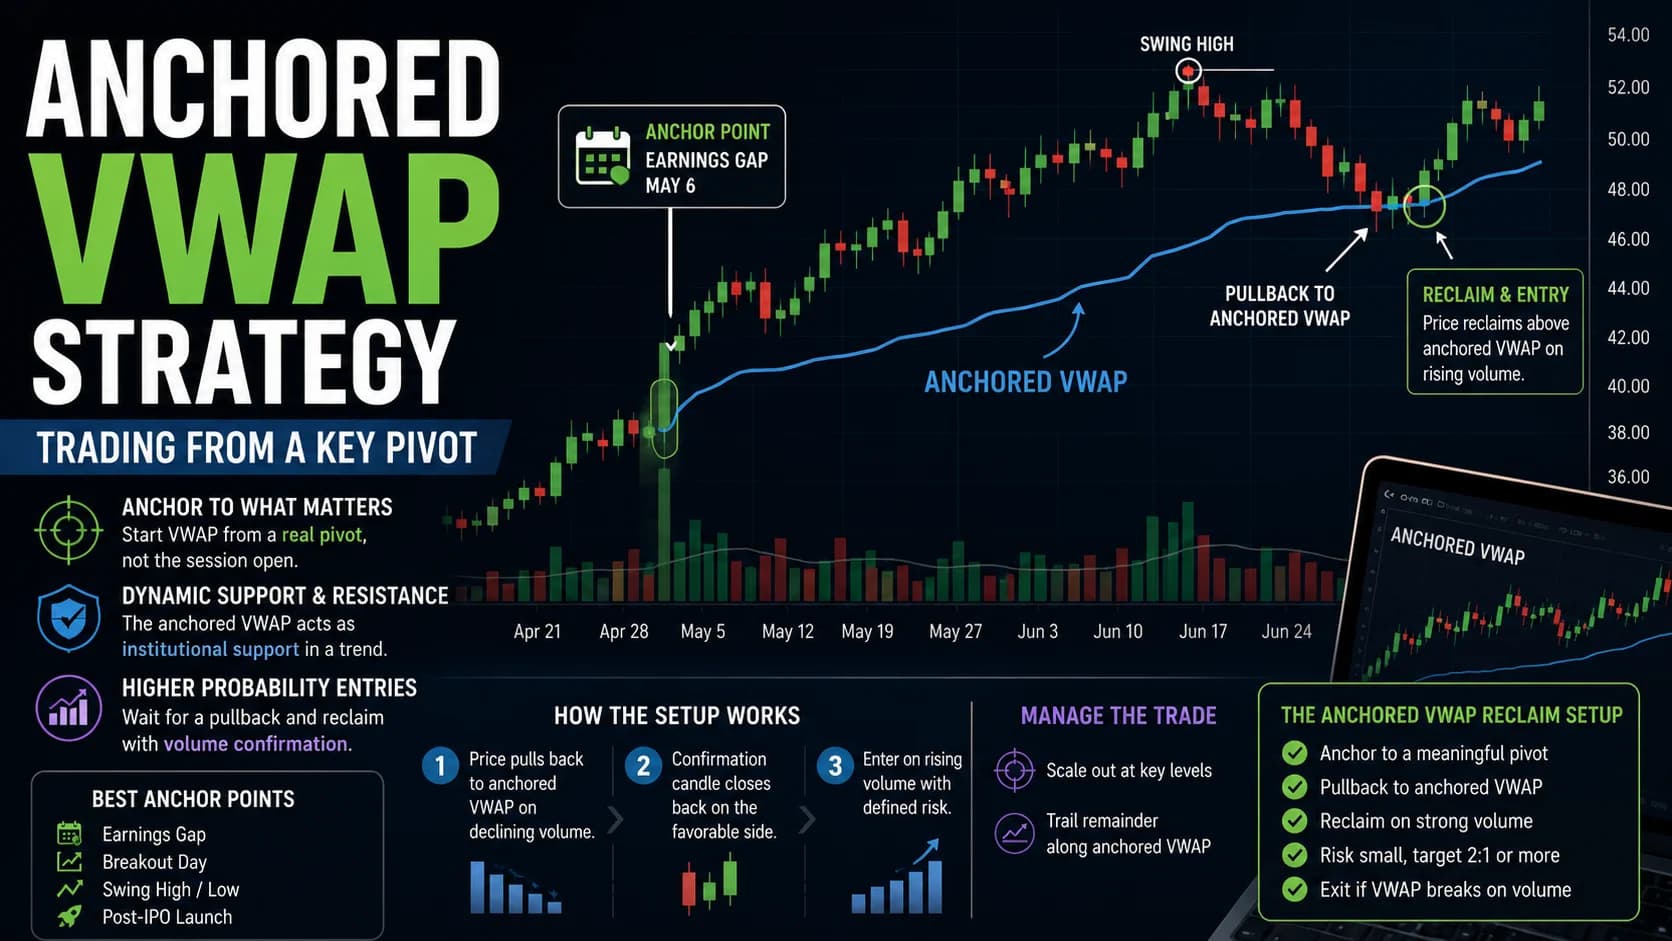
The anchored VWAP trading strategy: how to pick a genuine anchor point (a gap, a swing point, a breakout), trade the pullback with volume confirmation, and manage a multi-day anchored position.
Comments
No comments yet. Be the first to share your thoughts.