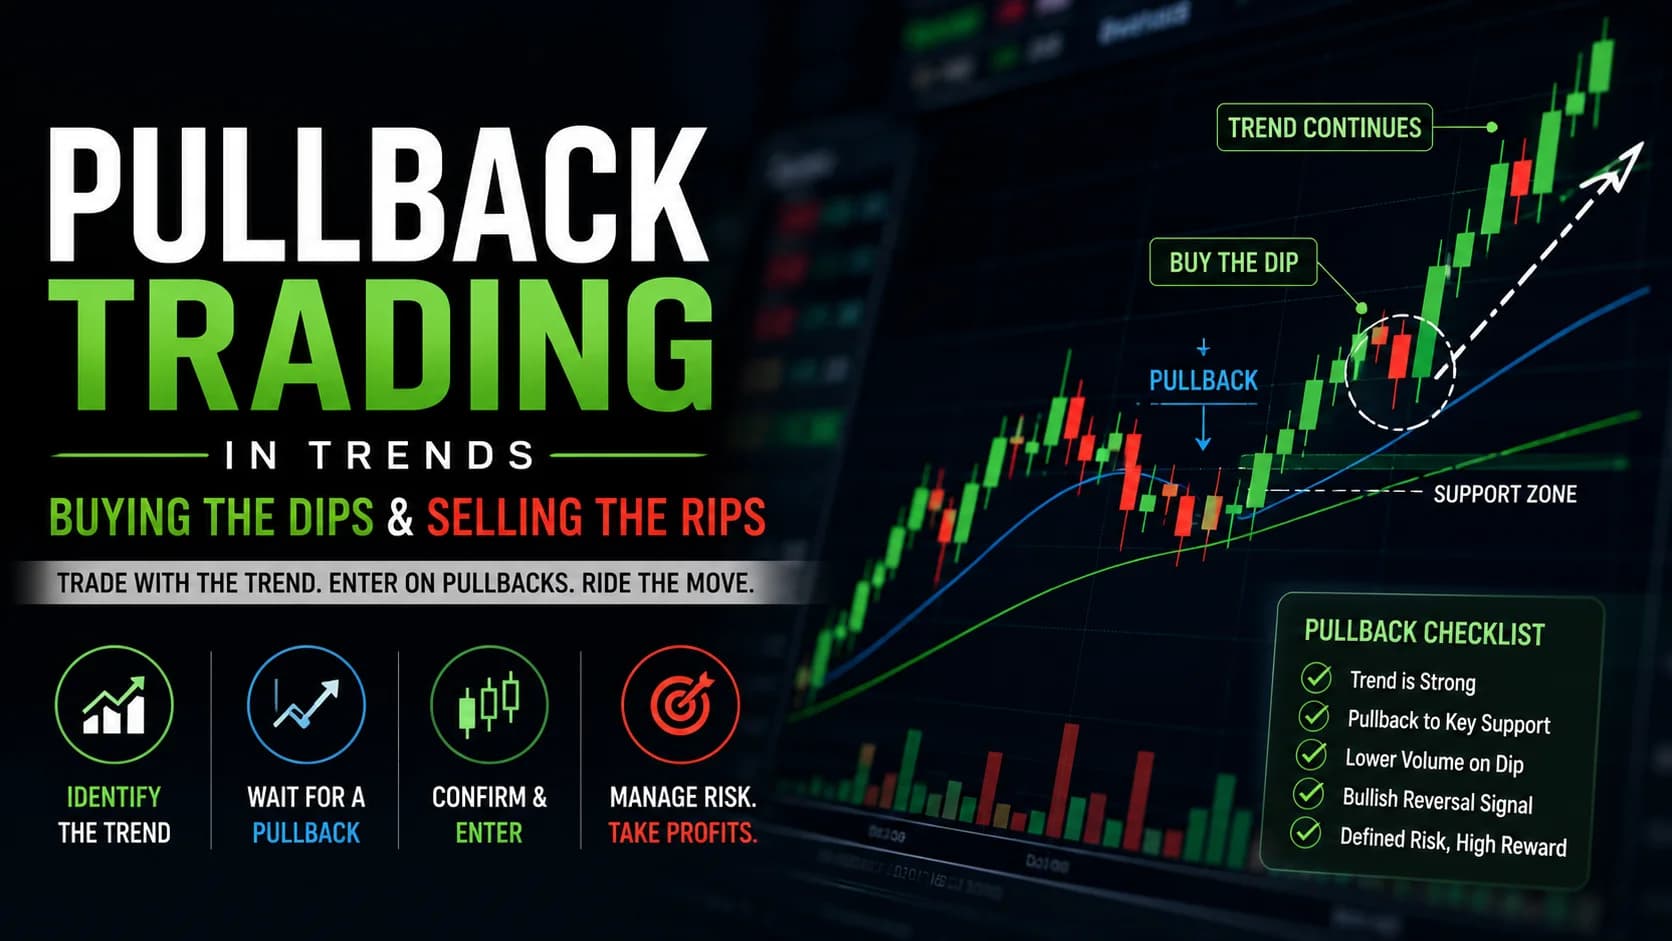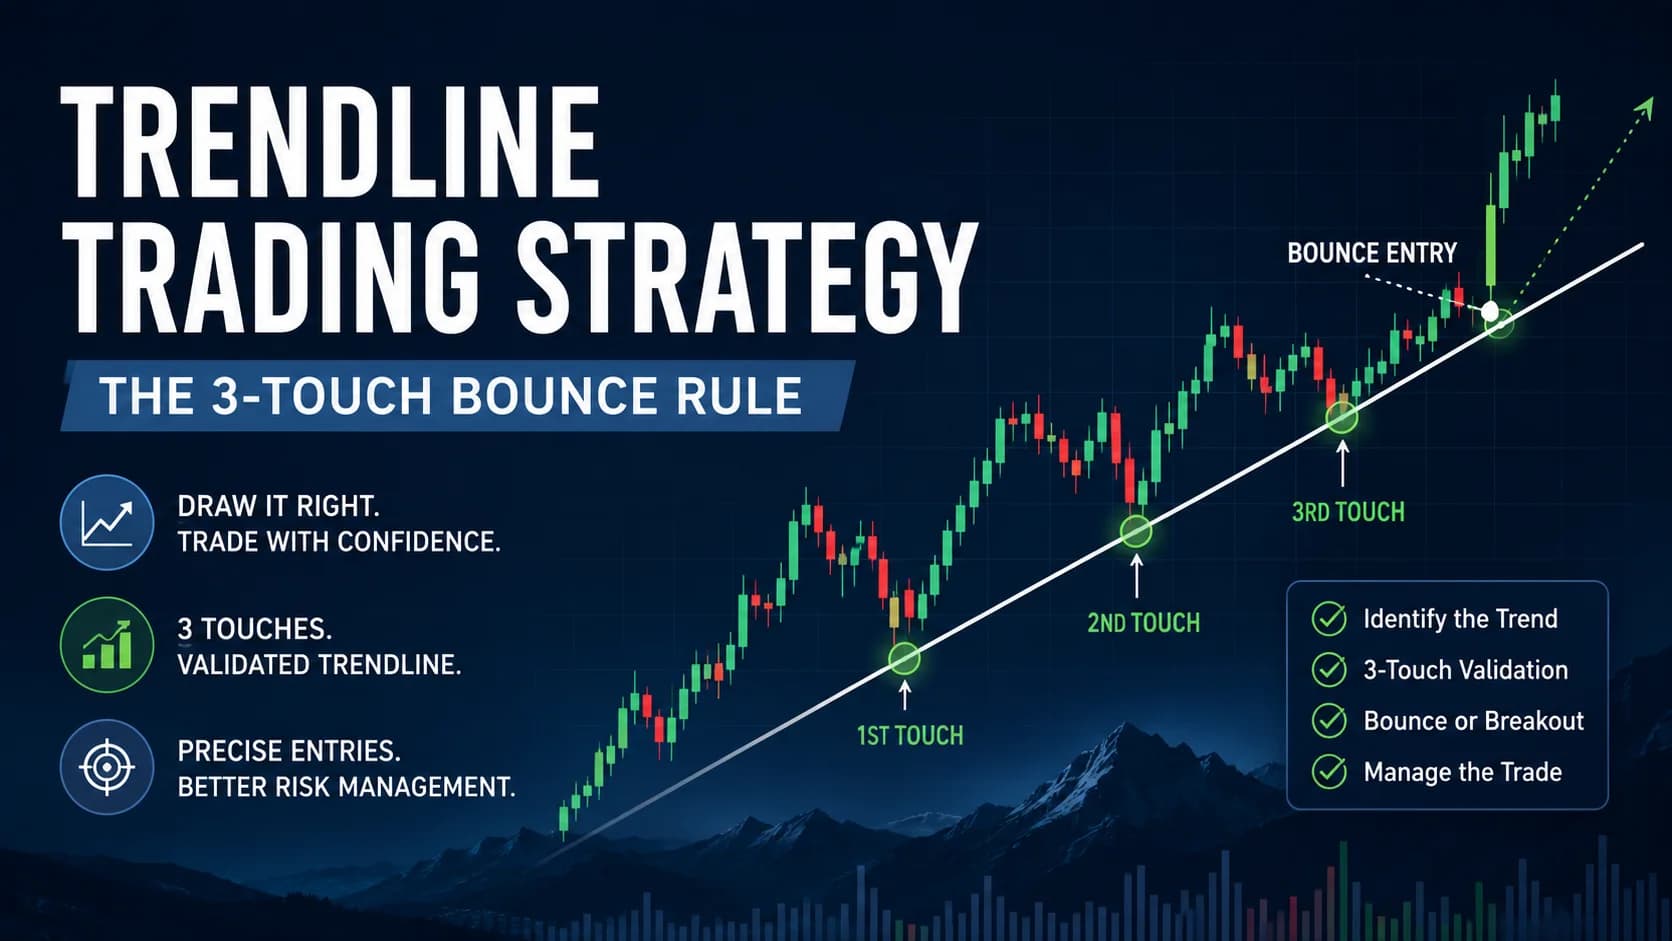
Every Moving AverageA moving average smooths out price data by calculating the average closing price over a set number of periods — it filters out noise and identifies the trend direction, with the stock above the MA interpreted as bullish and below as bearishRead definition →, every TrendlineA trendline is a straight line drawn connecting two or more swing highs (in a downtrend) or swing lows (in an uptrend) that defines the slope and trajectory of a price trend — price bouncing off a trendline is a potential entry signal, whilRead definition →, every indicator on a chart is trying to approximate one thing: the sequence of swing highs and swing lows that actually defines a TrendA trend is a sustained directional movement in price over time — an uptrend is characterized by a sequence of higher highs and higher lows, a downtrend by lower highs and lower lows — and correctly identifying the current trend direction isRead definition →. Strip all of that away and the raw structure is still there underneath — and trading directly off that structure, without an indicator standing between the trader and the price, is its own complete approach.
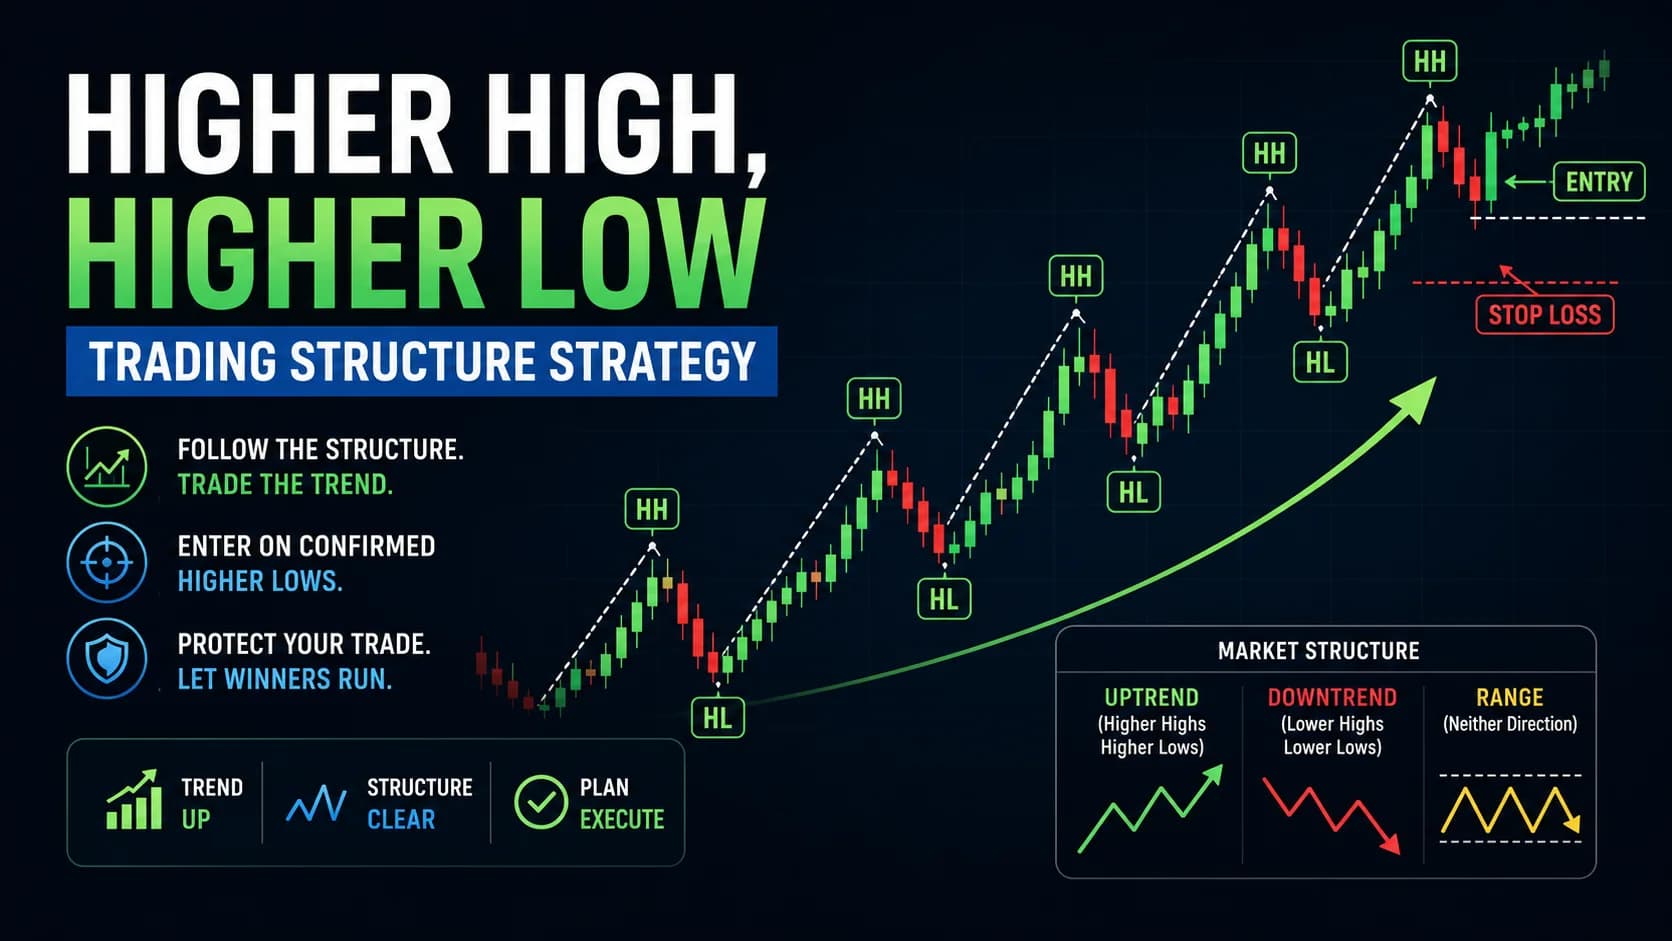
What is the higher-high, higher-low strategy? The higher-high, higher-low strategy defines an uptrend as a sequence of rising swing highs and rising swing lows, and a downtrend as the mirror sequence of falling swing highs and falling swing lows. Traders using this framework enter in the direction of the confirmed structure — buying as new higher lows hold in an uptrend, selling as new lower highs hold in a downtrend — and treat a break in that sequence as the primary signal that the trend itself may be changing.
Market Structure vs. Moving Averages and Trendlines
This framework traces back to Dow Theory, the foundational description of trend first laid out by Charles Dow in a series of Wall Street Journal editorials around 1900 and later formalized by Robert Rhea. The core claim is simple: a market is in a primary uptrend for as long as it keeps printing successively higher peaks and higher troughs, and that uptrend remains intact — regardless of how scary any single PullbackA pullback is a temporary counter-trend price movement within an established trend — in an uptrend, a pullback is a short-term decline that offers a lower-risk entry point before the trend resumes, as opposed to a reversal which signals theRead definition → feels — until the sequence itself actually breaks.
This is not the same as reading a moving average's slope or drawing a trendline. Both of those tools are derived from the underlying swing structure — an EMA smooths it into a single line, a trendline connects a subset of the swing points with a straight edge. Trading market structure directly means working with the swing highs and lows themselves, with nothing standing between the trader and the raw sequence of peaks and troughs. This guide's trend vs. range basics covers the beginner-level version of this same idea; this article goes further into the mechanical rules for trading directly off that structure.
It's also not a prediction tool any more than a pullback checklist or a trendline is. It doesn't call tops or bottoms in advance. It describes what a trend objectively is, in a way that's less exposed to hindsight bias than eyeballing a chart and declaring "yeah, that looks like an uptrend." A swing point either qualifies under the rules below or it doesn't — there's less room to see what a trader wants to see.
When Swing Structure Actually Reflects a Trend
Market structure trading works in any environment where price is actually forming a directional sequence of swings rather than churning sideways. The framework itself is what reveals whether that's happening: a clean run of higher highs and higher lows is a genuine uptrend, a clean run of lower highs and lower lows is a genuine downtrend, and — critically — a market printing a Higher HighA higher high occurs when price makes a swing peak that is above the previous swing peak — it's one of the two defining features of an uptrend and indicates buyers are consistently willing to pay more than before.Read definition → alongside a lower low (or a lower high alongside a higher low) is neither. That mixed signature is the structural definition of a range, and it's the framework's built-in warning to stand aside rather than force a trend read onto a market that hasn't earned one.
This approach tends to work best on timeframes with enough price history to form several clean swing points — 5-minute and higher intraday charts, and daily charts for a higher-timeframe read of the primary trend. On very fast timeframes (tick charts, 1-minute charts in thin conditions), swing points can form and invalidate so quickly that the structure becomes noisy rather than informative.
Structure reads on different timeframes can genuinely disagree, and that's not a contradiction — a stock can be printing higher highs and higher lows on the daily chart while simultaneously making lower highs and lower lows over the last hour intraday. Both are correct descriptions of their respective timeframes. The practical takeaway is to identify the higher-timeframe structure first, then use the intraday structure to time entries in alignment with it.
The Structure Continuation Setup (Setup Specification)
The core, tradeable version of this framework enters as each new swing low is confirmed to be holding within an already-established uptrend (or the mirror for a downtrend). Every component below is a hard, mechanical rule.
- Component
- Market Conditions Required
- Rule
- At least two confirmed HH-HL cycles already in place (or LH-LL for a downtrend); no mixed structure (simultaneous new high and new low) in recent swings
- Component
- Time of Day
- Rule
- Strongest 10:00 AM–3:00 PM ET; avoid acting on swing points that are still forming in the first 15–20 minutes
- Component
- Stock Selection Criteria
- Rule
- Liquid stock or ETF with average daily volume above roughly 1 million shares; clean, non-choppy swing formation visible on a 5-minute or higher chart
- Component
- Entry Trigger
- Rule
- Buy-stop (or sell-stop for shorts) above the high of the candle that confirms a new higher low has held — i.e., the break of the most recent minor swing high after a pullback
- Component
- Stop Loss
- Rule
- Below the confirmed swing low itself (or above the confirmed swing high for shorts)
- Component
- Initial Profit Target
- Rule
- Prior swing high for a minimum 2:1 reward-to-risk; scale a portion there and trail the remainder
- Component
- Trade Management
- Rule
- Move stop to breakeven at the first target; trail the remainder beneath each subsequent confirmed higher low
- Component
- Invalidation Criteria
- Rule
- Price makes a lower low that undercuts the prior confirmed swing low — a genuine break of structure — regardless of how the entry trade is currently performing
| Component | Rule |
|---|---|
| Market Conditions Required | At least two confirmed HH-HL cycles already in place (or LH-LL for a downtrend); no mixed structure (simultaneous new high and new low) in recent swings |
| Time of Day | Strongest 10:00 AM–3:00 PM ET; avoid acting on swing points that are still forming in the first 15–20 minutes |
| Stock Selection Criteria | Liquid stock or ETF with average daily volume above roughly 1 million shares; clean, non-choppy swing formation visible on a 5-minute or higher chart |
| Entry Trigger | Buy-stop (or sell-stop for shorts) above the high of the candle that confirms a new higher low has held — i.e., the break of the most recent minor swing high after a pullback |
| Stop Loss | Below the confirmed swing low itself (or above the confirmed swing high for shorts) |
| Initial Profit Target | Prior swing high for a minimum 2:1 reward-to-risk; scale a portion there and trail the remainder |
| Trade Management | Move stop to breakeven at the first target; trail the remainder beneath each subsequent confirmed higher low |
| Invalidation Criteria | Price makes a lower low that undercuts the prior confirmed swing low — a genuine break of structure — regardless of how the entry trade is currently performing |
A swing point has to actually qualify before it counts. A swing high needs price to make a lower high on both sides of it — a single candle poking to a new extreme, surrounded by candles that immediately exceed it again, isn't a confirmed swing point. This is the single most common mistake in applying this framework: treating every minor wiggle as a meaningful swing, which turns a clean structural read into noise.
The entry isn't the pullback itself — it's the confirmation that the pullback held. Buying the moment price stops falling is a guess about where the low will be. Waiting for price to reclaim the most recent minor swing high after the pullback is proof that the higher low actually held and that buyers have already resumed control, which is a materially different, better-confirmed signal than trying to pick the exact bottom of the retracement.
Walk-Through Example: Structure Continuation in a Mid-Cap Retailer
Consider a hypothetical mid-cap retail stock — call it DEF, trading in the mid-$40s with liquidity well above this strategy's threshold.
The existing structure: Over the prior two weeks, DEF has already printed one clean HH-HL cycle: a swing low at $38, a swing high at $44, and a second swing low at $41 — higher than the first. Two cycles in, the uptrend is established under this framework.
The pullback and confirmation: DEF rallies to a new high of $47, then pulls back. The pullback holds at $42.50 — above the prior $41 swing low — before turning back up. That $42.50 low only becomes a confirmed swing low once price makes a lower high on both sides of it, which happens as DEF starts climbing again.
The entry trigger: As DEF climbs off the $42.50 low, it needs to clear the minor swing high that formed during the pullback's brief bounce attempts — say, $44.20 — before the higher low is considered confirmed and actionable. The entry is a buy-stop at $44.30, ten cents above that minor high.
Execution: The stop-loss goes at $42.30, twenty cents below the confirmed $42.50 swing low — a risk of $2.00 per share. The prior swing high of $47 becomes the initial target, offering $2.70 of reward against $2.00 of risk — just over 1.3:1 on its own, below this guide's 2:1 minimum, which under this framework means waiting for a better-positioned entry or treating the $47 level as an interim scale-out point rather than the full target, with the plan to trail further if DEF's structure continues.
What happens next: DEF clears $44.30, works toward and through $47, and prints a third HH-HL cycle with a new swing low near $45. A trader following the trade-management rule above would trail the stop beneath each newly confirmed higher low as the structure develops, exiting only when a swing low actually breaks.
Trailing a Stop Beneath Each Confirmed Swing Low
The exit plan under this framework is built into the structure itself: trail the stop beneath the most recently confirmed swing low (or above the most recent confirmed swing high, for shorts), moving it up only once a new low is actually confirmed — never in anticipation of one.
This produces a naturally wide amount of room during any single pullback, which is precisely the point. A stop set too tight, based on minor intraday noise instead of the actual confirmed swing low, will get triggered by ordinary pullback behavior long before the structure itself has broken. The structure-based stop only moves when the market has already proven the old level matters less than the new one.
Scaling out at the prior swing high is a reasonable default, but for a trader who wants to stay with a trend that's clearly working, holding the full position and trailing behind each new confirmed low can capture considerably more of a sustained move — at the cost of giving back more of the open profit if the structure suddenly breaks.
Why Unconfirmed Swing Points Wreck This Framework
The most common failure is treating an unconfirmed swing point as if it were confirmed. A single candle spike to a new high, surrounded by candles that promptly exceed it, isn't a real swing high — and a trader who marks it as one anyway ends up trading a structure that doesn't actually exist yet. This is exactly the kind of mistake that's easy to make in the moment and easy to see in hindsight, which makes it worth naming plainly here.
There's a genuinely counterintuitive wrinkle worth knowing: mixed structure — a new high alongside a new low within the same recent swing sequence — doesn't just mean "unclear." Under this framework, it's a specific, identifiable signal that the market has shifted into a range or a volatility expansion, and continuing to trade it as a trend is fighting the framework's own diagnosis. The honest move at that point is to stand aside, not to force a directional read onto a market that has structurally stopped cooperating.
This approach also degrades on very fast timeframes in thin, choppy conditions, where swing points can form and invalidate within a handful of candles. A "confirmed" higher low on a 1-minute chart in a low-volume stock may simply reflect noise rather than any real shift in buying or selling pressure — the same structural logic that works cleanly on a daily chart can generate false signals rapidly on the fastest timeframes.
Finally, this framework is descriptive, not predictive — a limitation Dow Theory itself acknowledges. It tells a trader what the structure currently is and when it has broken, but it offers no advance warning that a break is coming. The break of structure is confirmed only after it happens, which means this approach will always give up some of the top or bottom of a move in exchange for not guessing early.
Trading Structure Breaks and Multi-Timeframe Alignment
Trading the break of structure as a reversal signal: When an established uptrend's swing low actually gets undercut — a genuine break of structure — that's the framework's own signal that the trend may be changing, not merely pausing. This pairs directly with this guide's breakdown of spotting market reversals, which covers how to build a full reversal thesis once structure alone has flagged the possibility.
Applying the mirror logic to downtrends: Everything above reverses cleanly for shorts — sell-stops trigger on the break of a minor swing low after a bounce holds below the prior swing high, stops sit above the confirmed swing high, and targets project to the prior swing low.
Multi-timeframe structure alignment: Since structure on different timeframes can genuinely disagree, a common refinement is to require the daily or hourly structure to be trending in the same direction as the intraday structure before taking a continuation entry — trading only when both timeframes agree reduces the number of signals but improves their average quality.
Combining structure with an indicator-based method: This framework pairs naturally with either of this guide's other trend-continuation systems — the moving-average-based pullback checklist or the diagonal-line-based trendline strategy — since all three are describing the same underlying trend from different angles. Confluence between a confirmed higher low, a rising 20 EMA, and a respected ascending trendline is a considerably stronger signal than any one of the three alone.
Marking Swing Highs and Lows Without Bias
This framework's biggest practical challenge isn't finding trending stocks — it's marking swing highs and lows consistently across timeframes without letting hindsight or wishful thinking creep into which wiggles count.
TradingView is the standard for manually marking swing points, with drawing tools that make labeling confirmed highs and lows across multiple timeframes fast and precise, plus the ability to keep a daily-chart structure visible for reference while trading off a faster intraday chart.
Finding candidates already showing a clean, multi-cycle HH-HL sequence before committing screen time to one is where a real-time scanner earns its keep. Trade Ideas can filter for stocks with rising relative volume and price already trending, which narrows the field considerably before this framework's manual swing-point work begins. Traders comparing current pricing across tools can check the deals page for active offers.
Where Structure Trading Fits a Trend-Day Plan
Market structure trading is another trend-continuation approach, and like the others in this guide, it works best paired with a broader read of overall market conditions rather than as a standalone system — it should be set aside on days where the structure itself is signaling a range rather than forced onto a market that isn't cooperating.
Because identifying a "confirmed" swing point involves a judgment call about which wiggles matter, this approach is genuinely exposed to confirmation bias — the tendency to see the swing structure a trader wants to see rather than the one that's actually there. This guide's breakdown of trading cognitive biases covers why that bias is so easy to miss in real time, which is precisely why the "lower high on both sides" qualification rule above exists: it's an objective test that doesn't depend on how badly a trader wants the setup to be real. For other trend, range, and volatility frameworks built the same way, this guide's full Strategies hub breaks down the complete library by market regime.
Market Structure Trading FAQ
What actually qualifies as a confirmed swing high or swing low?
This rule exists specifically to filter out noise. Without it, almost any minor wiggle could be labeled a "swing point," which would make the entire higher-high, higher-low framework meaningless. Requiring confirmation on both sides means a swing point can only be marked once price has actually moved away from it in both directions, which takes some of the subjectivity out of an otherwise judgment-heavy exercise.
Key Takeaway: No swing point counts until price has moved away from it on both sides.
How is trading market structure different from trading a moving average?
An EMA or SMA takes a rolling average of recent prices, which necessarily lags the actual turning points by design. Trading the raw swing structure means reacting to the exact moment a higher low is confirmed rather than waiting for an averaged line to catch up. The trade-off is that structure requires more manual judgment about what counts as a valid swing point, while a moving average's calculation is entirely objective.
Key Takeaway: Structure reacts faster to real turning points; moving averages trade consistency for a small amount of lag.
What does it mean when a stock makes a higher high and a lower low at the same time?
A genuine uptrend requires both conditions — higher highs and higher lows — to hold together. When one half of that pair breaks while the other doesn't, the market is no longer meeting the definition of a trend under this framework, regardless of how it might look at a casual glance. This is the framework's built-in signal to stand aside rather than force a directional trade.
Key Takeaway: Mixed structure means "range," not "unclear" — treat it as an explicit signal to wait.
What is a "break of structure" and why does it matter?
Under this framework, a trend remains valid for as long as its sequence of higher highs and higher lows stays intact — no matter how sharp or scary any individual pullback feels along the way. The moment a confirmed swing low actually breaks, that specific condition is no longer true, and the trend's own definition says it may be over. It's a lagging signal by design — it only confirms after the fact — but it's an objective one.
Key Takeaway: A break of structure is the framework's own trend-invalidation rule, confirmed only after it happens.
Can this strategy be traded on multiple timeframes at once?
A common refinement is to identify the higher-timeframe structure first — is the daily chart making higher highs and higher lows? — and only take intraday continuation entries that align with that direction. Trading against the higher-timeframe structure using only intraday signals is a materially riskier trade than trading with both timeframes in agreement.
Key Takeaway: Check the higher-timeframe structure before trusting an intraday signal built on it.
Why wait for price to clear the pullback's minor high instead of buying the low directly?
There's no way to know in real time whether a pullback has finished making its low. Waiting for confirmation — a break back above the small swing high that formed during the pullback — sacrifices some of the potential move in exchange for meaningfully better odds that the entry is timed after the low is already in, not during it.
Key Takeaway: The entry trigger is proof the low already held, not a bet on where it will hold.
How does this framework relate to Dow Theory?
Dow's original observation was that markets move in a series of zigzagging waves rather than straight lines, and that the relative position of each new peak and trough — not any single price level — is what actually defines whether the primary trend is up, down, or absent. Everything modern traders do with moving averages and trendlines is, in a sense, a more convenient approximation of this same underlying idea.
Key Takeaway: This framework isn't a new invention — it's the original technical definition of trend, applied directly.
Does this strategy work on choppy, low-volume stocks?
The framework depends on swing points that actually mean something to a meaningful number of market participants, which requires enough volume and price history for a real structure to form in the first place. In illiquid or extremely choppy conditions, the same rules technically still apply, but the signals they generate become unreliable fast.
Key Takeaway: This framework needs real liquidity and a genuine trend to work — it degrades quickly in thin, choppy names.
What's the minimum number of swings needed before a trend is considered established?
A single higher high followed by a single higher low is a start, but it's a thin sample — not meaningfully different from the two-touch trendline problem covered elsewhere in this guide's strategy library. A second confirmed cycle shows the pattern repeating, which is a materially stronger basis for a continuation entry than acting on the very first sign of a possible trend.
Key Takeaway: One HH-HL cycle is a hint; two confirmed cycles is a tradeable trend.
Can market structure trading be automated?
Because a valid swing point is defined by an explicit, checkable rule rather than a subjective impression, this framework is more naturally suited to systematic scanning than tools like trendlines that depend on which points a trader chooses to connect. The judgment that still benefits from experience is deciding which timeframe's structure should take priority when different timeframes disagree.
Key Takeaway: The swing-point rule is objective enough to automate; multi-timeframe judgment still benefits from experience.
Article Sources
- Investopedia: Dow Theory - reference for the historical origin and core tenets of Dow Theory's trend definition.investopedia.com
- Fidelity: Basic Concepts of Trend Analysis - reference for the practical application of peaks, troughs, and trend confirmation.fidelity.com
- StockCharts ChartSchool - reference for standard swing-point and trend-structure conventions used throughout this guide.chartschool.stockcharts.com
- Jegadeesh & Titman, "Returns to Buying Winners and Selling Losers" (1993), Journal of Finance - academic research establishing that price trends exhibit statistically significant continuation, supporting this guide's continuation-based approach to structure.onlinelibrary.wiley.com
- CMT Association - professional body for the Chartered Market Technician designation, referenced for general professional standards in technical analysis methodology.cmtassociation.org