


Market Updates & Context

Day Trading Market Insights

Weekly market previews, regulatory updates, and catalyst analysis for active day traders — covering what changed, why it matters, and what it means for how you trade this week.

Weekly
Market previews and event coverage
Current
Rule and regulatory changes tracked
Zero
Recycled generic market takes
Trader
Written for active day traders

Weekly market coverage

FOMC weeks, earnings seasons, NFP days, and macro catalyst events analyzed from a day trader's perspective — what it means for volatility, setups, and sizing this week.

Regulatory & rule changes

When market structure changes — PDT rule elimination, extended trading hours, margin rule updates — this hub covers what changed, when it takes effect, and what you need to do.

Catalyst context for traders

Understanding why the market is behaving the way it is — what the Fed is signaling, what big earnings weeks mean for volatility, and which events are signal versus noise.

Free newsletter

Get new day trading market insights guides

Join the free list for fresh guides, tool notes, and trading lessons from this hub. Built for practical reading, not hype.

Unsubscribe anytime.

Library

All Day Trading Market Insight Articles

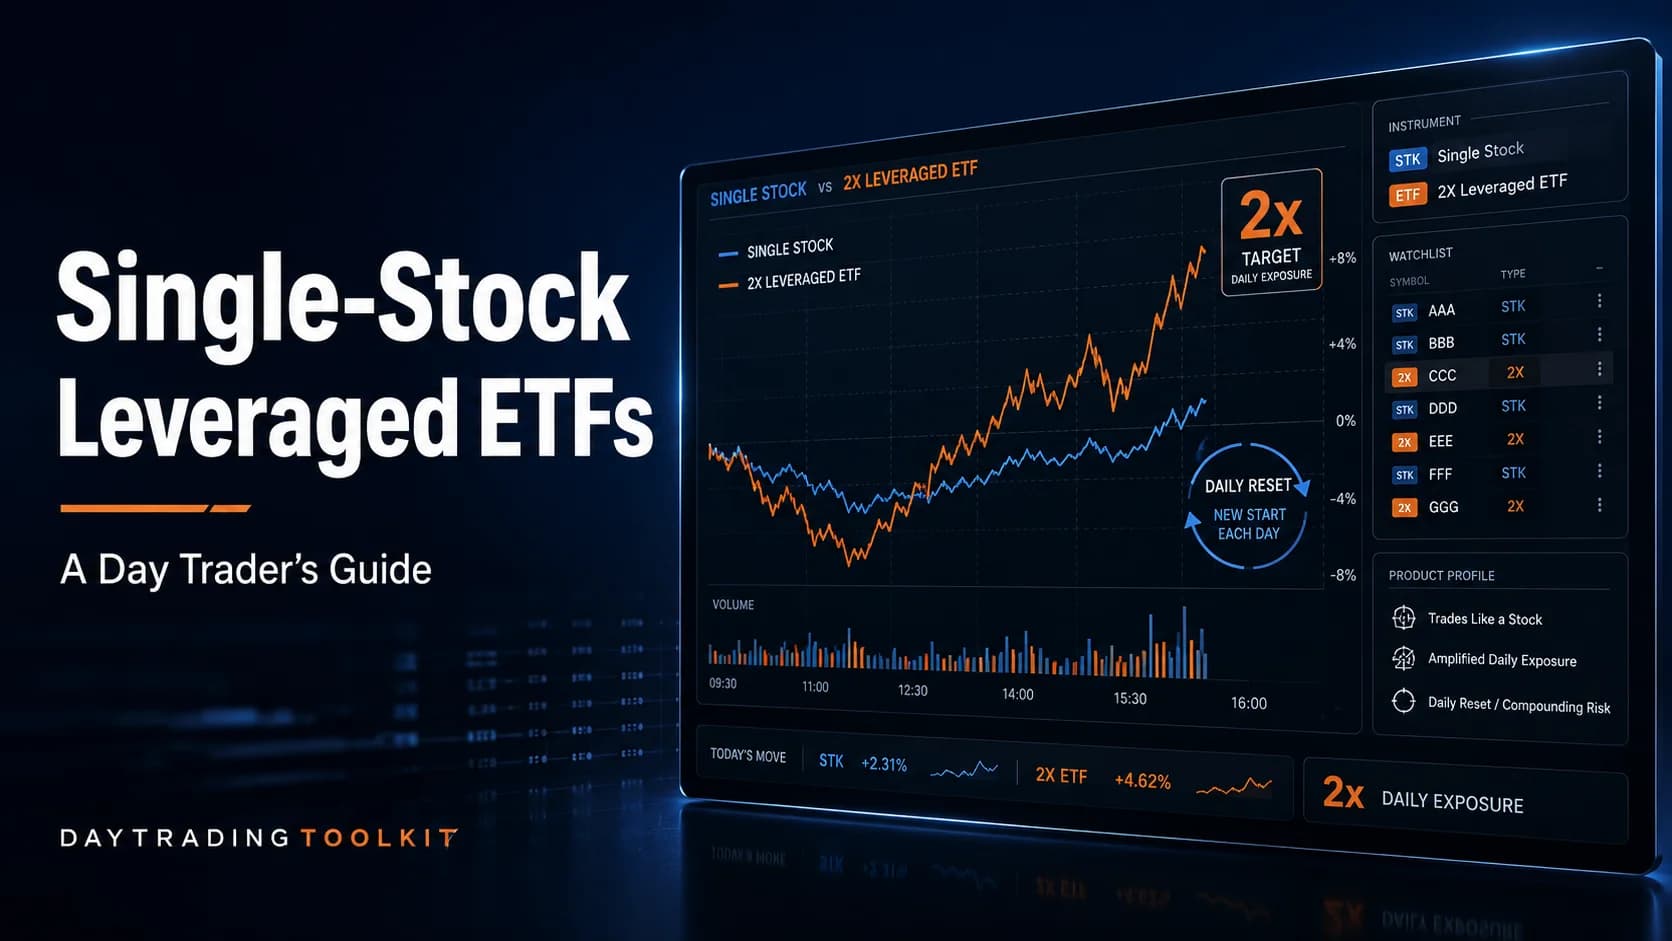
Single-stock leveraged ETFs guide showing a 2x ETF trading dashboard, daily reset chart, amplified exposure, and compounding risk for day traders.

Single-Stock Leveraged ETFs: What Day Traders Need to Know Before Trading NVDL, TSLL, and the Rest

Single-stock leveraged ETFs like NVDL and TSLL have grown from a niche curiosity into a 400+ ticker category. Here's how the daily reset actually works, the real risks, and where these products fit in a day trading plan.

Aug 4, 202681
Prop firm regulation guide showing a funded trading evaluation dashboard, compliance review, trading agreement and regulatory gavel.

Prop Firm Regulation: What's Real, What's Hype, and What It Means for Your Account

The CFTC's biggest case against a prop firm just collapsed in court, but regulators in the US, EU, UK, and Australia are still closing in. Here's what's actually happening and how to protect your funded account.

Aug 4, 202645
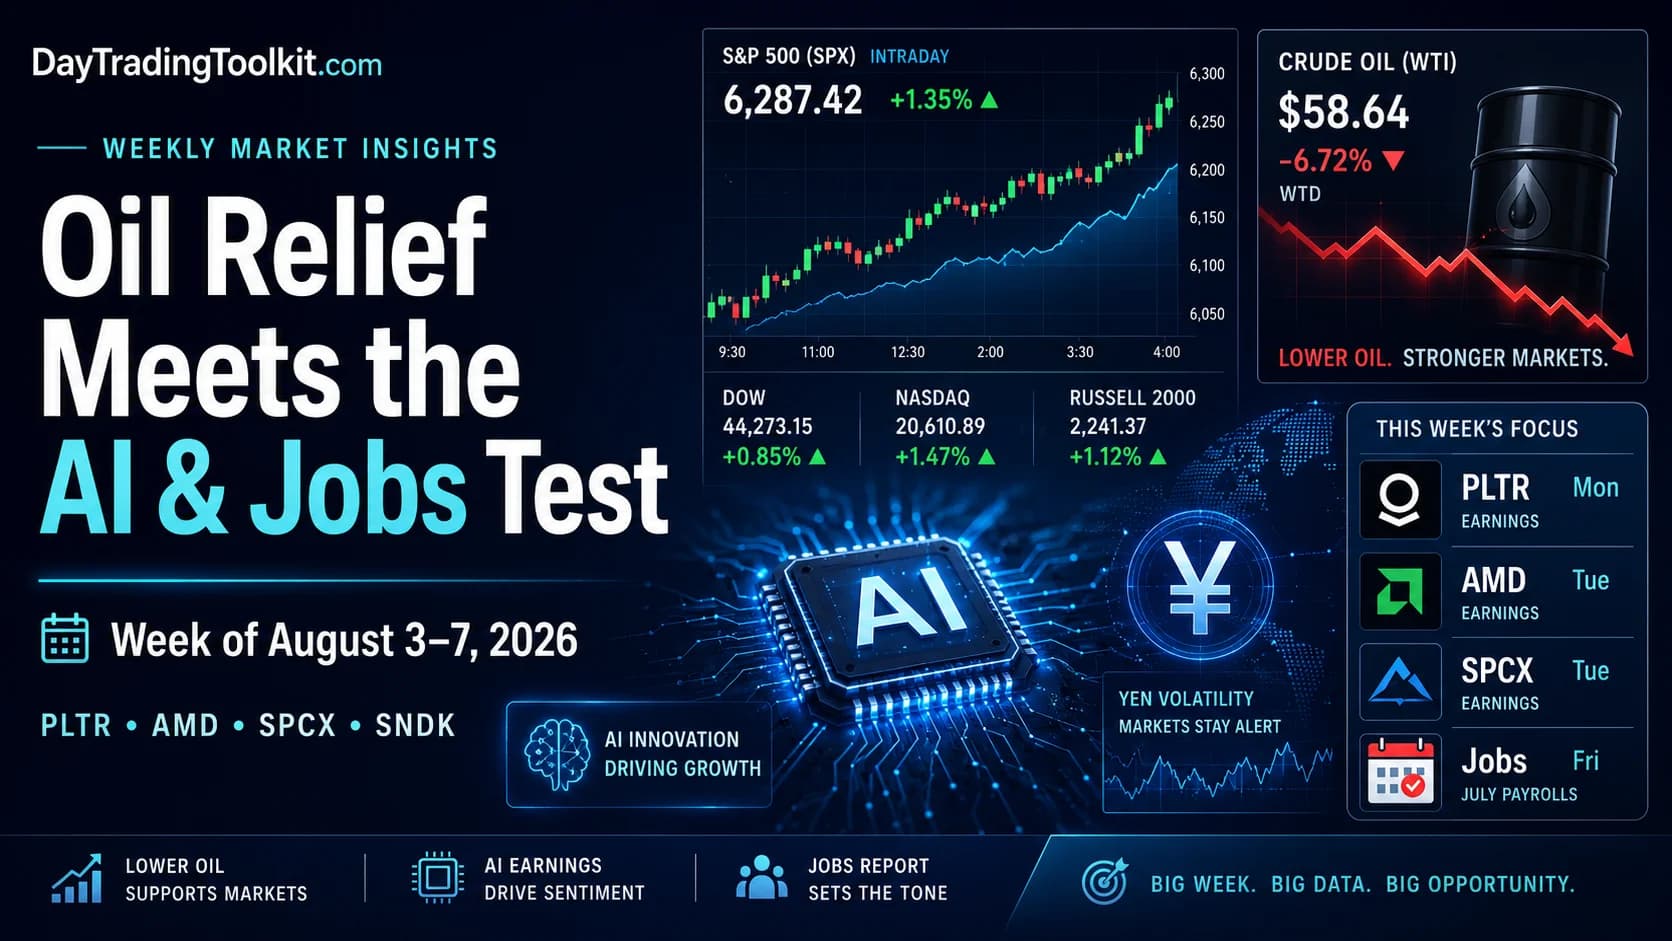
Weekly Market Insights featured image showing falling oil prices, AI earnings, yen volatility, and the August 2026 U.S. jobs report.

Weekly Market Insights August 3–7, 2026: Oil Relief Meets the AI and Jobs Test

Oil is falling and stocks are rallying, but Palantir, AMD, SpaceX, Sandisk and Friday’s jobs report will test whether Monday’s relief can last all week.

Aug 3, 2026177
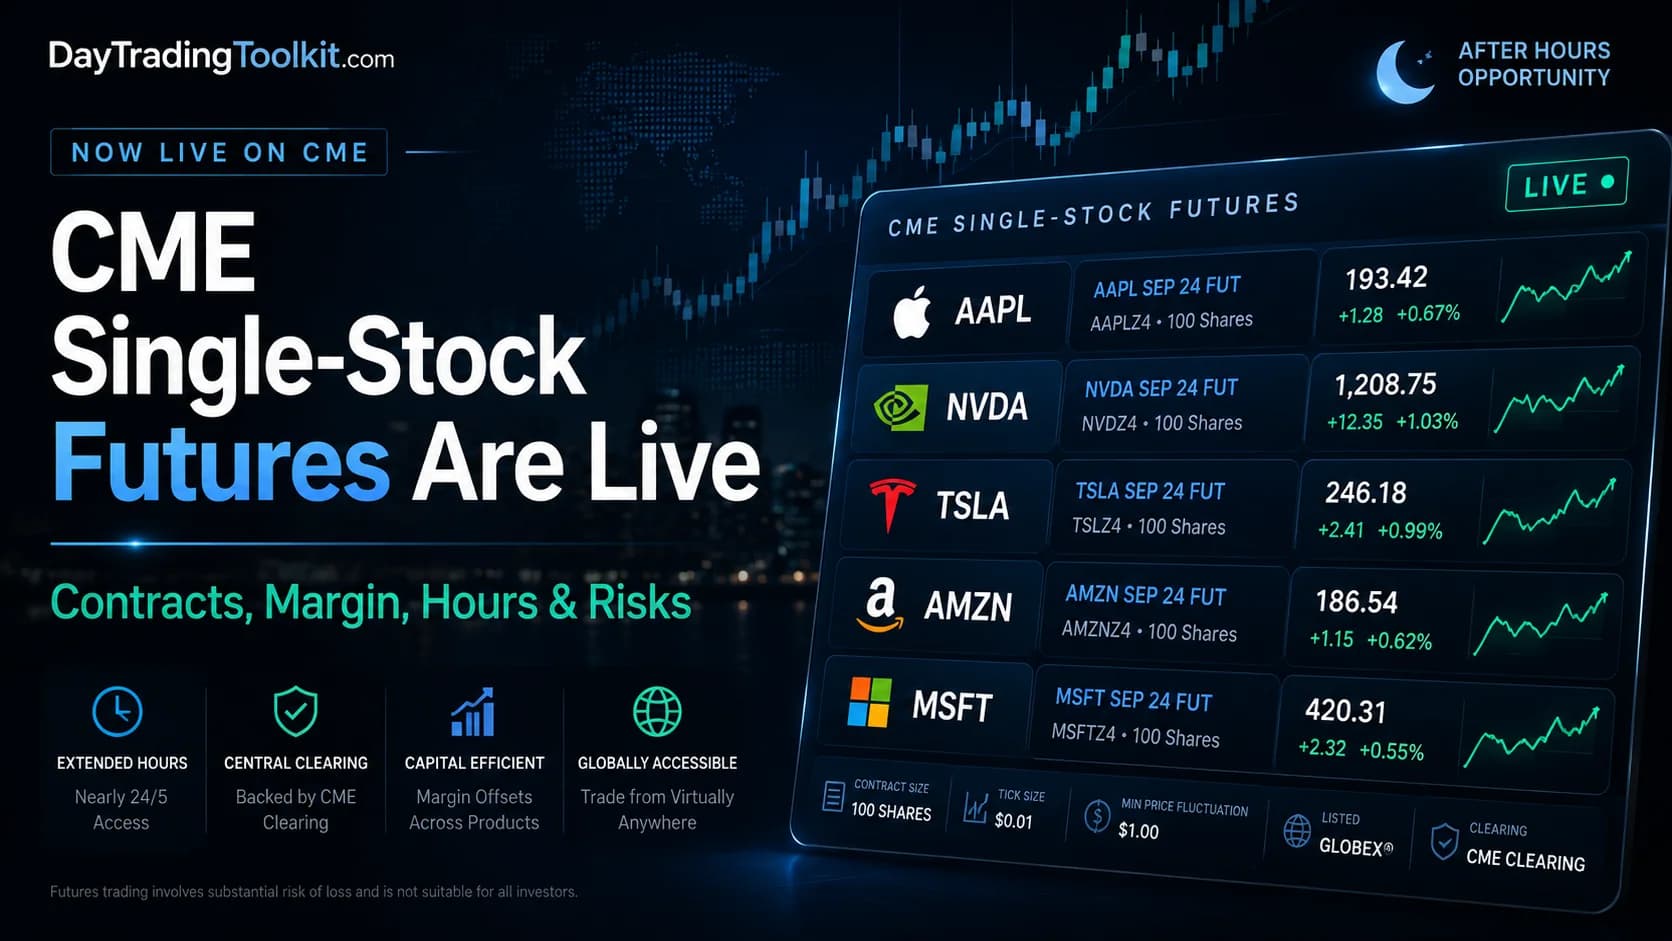
CME single-stock futures featured image showing AAPL, NVDA, TSLA, AMZN, and MSFT futures contracts with margin, trading hours, and risk themes.

CME Single-Stock Futures Are Live—But Liquidity Will Decide Whether They Matter

CME single-stock futures now trade nearly 23 hours a day. Learn how contract size, margin, basis, liquidity and expiration actually work.

Aug 2, 202647
Premium featured image showing a rising market chart passing through an opened barrier for starting day trading this fall.

Starting Day Trading This Fall? What's Different Now

Every fall brings a wave of new day traders. This year, the old $25,000 PDT minimum that used to block most of them is gone, replaced by a ~$2,000 risk-based framework. Here's what's actually changed and what hasn't.

Jul 30, 2026193
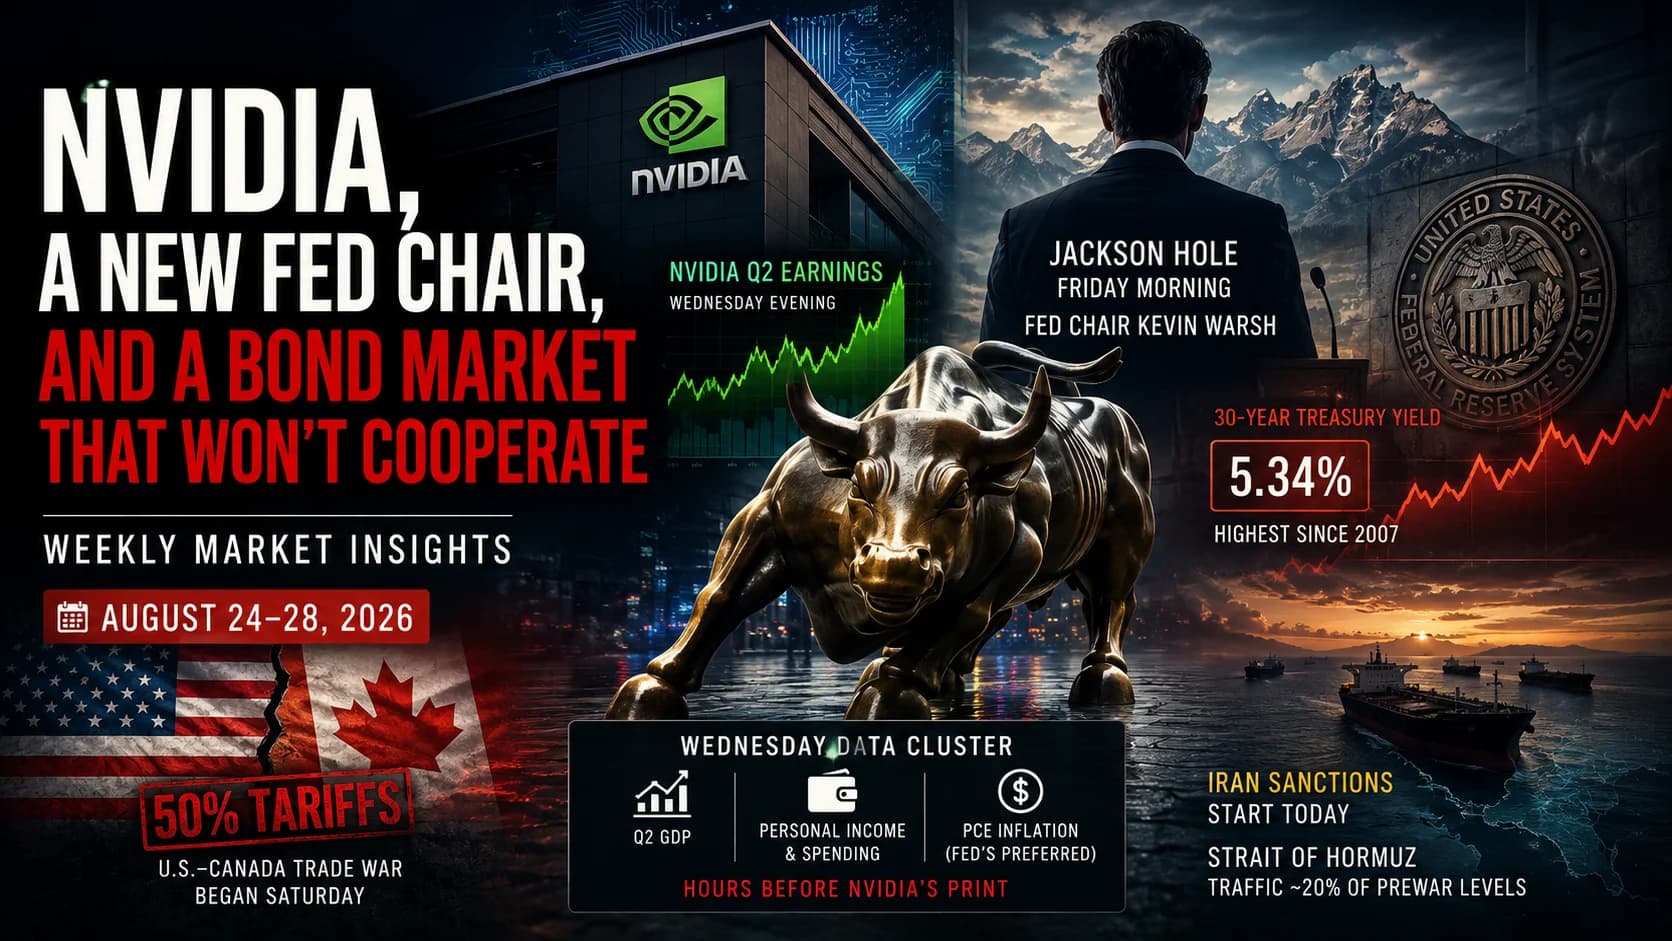
Jackson Hole market preview featuring a central-bank speech microphone, prepared remarks, mountain backdrop, and two-sided market reaction.

Jackson Hole 2026: What Day Traders Should Watch

Kevin Warsh delivers his first Jackson Hole address as Fed chair August 27-29, weeks after three regional presidents dissented for a rate hike. Here's the setup, the history, and how day traders should prepare.

Jul 30, 2026710
SpaceX lockup expiration illustrated by an open lock releasing insider shares into a declining stock chart.

SpaceX Lockup Expiration: The $123B Unlock Explained

SpaceX's first Q2 earnings report on August 4 triggers a staggered lockup release starting August 6 — up to $123B in insider shares. Here's the mechanics, the historical precedent, and how day traders should approach it.

Jul 30, 20262,390
Federal Reserve building merging with AI data-center infrastructure for Weekly Market Insights covering Big Tech earnings and market volatility.

Weekly Market Insights July 27–31, 2026: The Fed Is Wednesday. This Week’s Watchlist Starts Before Then.
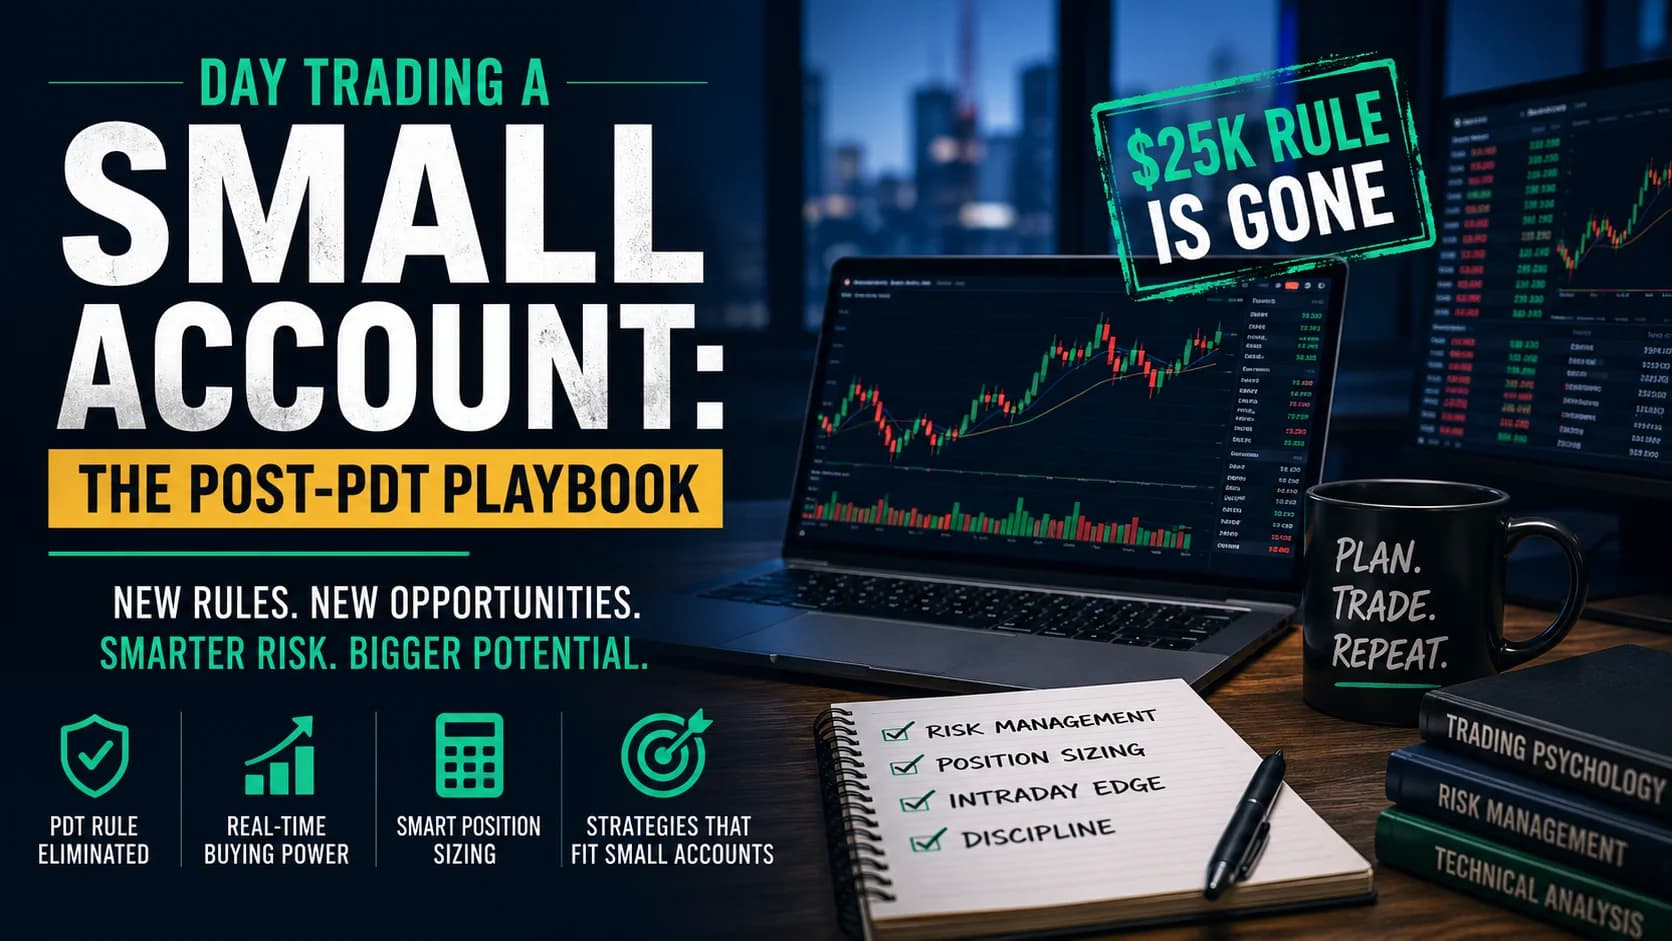
Plan July 27–31 with exact Fed, GDP and PCE times, plus eight catalyst-driven stocks to watch across AI, fintech, semiconductors and crypto.

Jul 27, 2026288
Index rebalancing featured image showing passive fund flows concentrating into the closing auction, creating a sharp volume spike near the market close.

Why Index Rebalancing Days Break Volume Records—and Why Chasing the Addition Still Fails

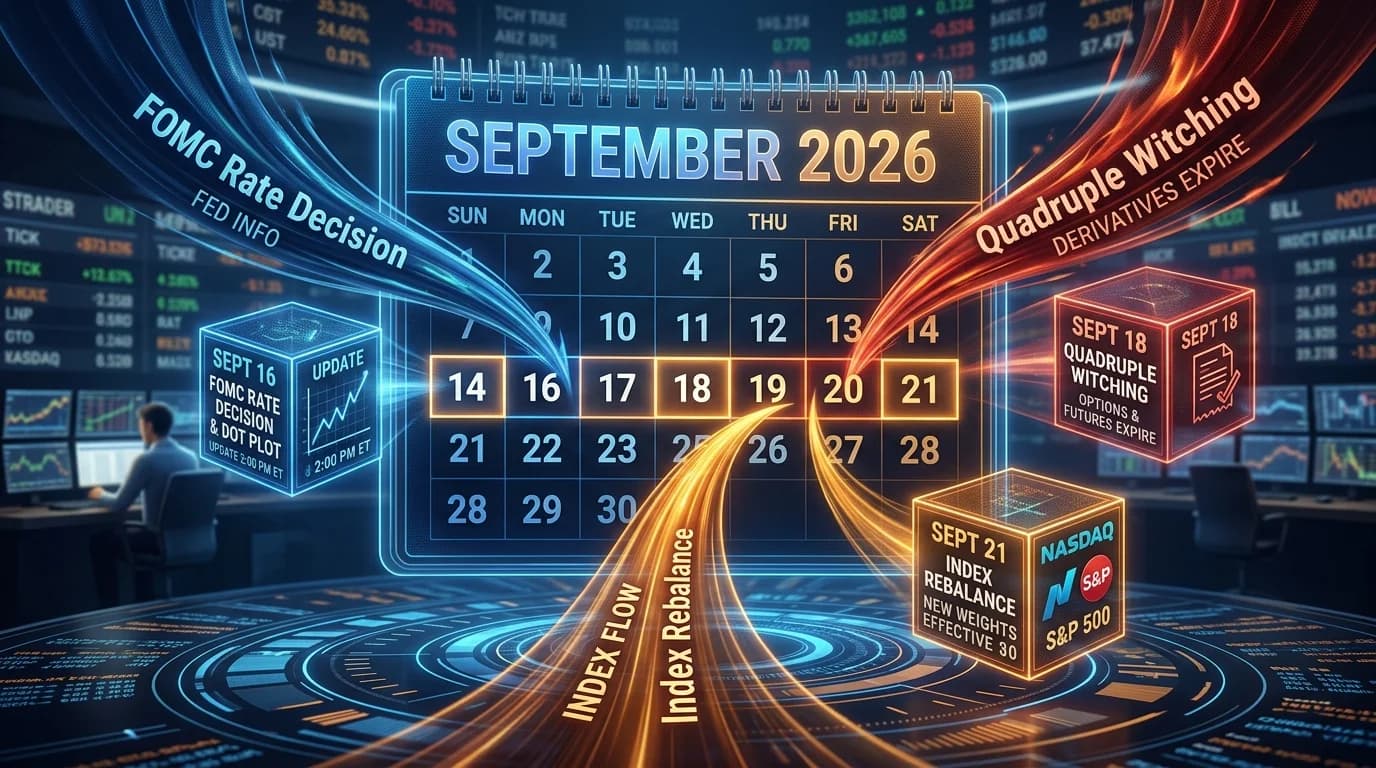
Index rebalancing forces price-insensitive buying and selling into the closing auction, sometimes 40%+ of a stock's daily volume. The mechanics, the September 2026 dates, and why forced buying doesn't guarantee a price pop.

Jul 22, 2026242
AI capex vs software stocks featured image showing enterprise budget flows shifting toward AI infrastructure, data centers, and hardware while software spending faces pressure.

IBM Just Gave the AI Capex Story a Number—Here's How to Test If It's Real

IBM's Q2 2026 warning tied a $660M revenue miss to clients shifting budget toward AI hardware. Here's the five-point test for whether that's one company's quarter or a real software-sector rotation.

Jul 22, 202658
Illustration of Cboe's planned premarket options trading session showing the 7:30 a.m. to 9:25 a.m. ET trading window, market data screens, and the August 17 launch timeline for eligible sing
Cboe Plans Premarket Options Trading—But It Will Not Feel Like the Regular Session

Cboe's C1 exchange plans a 7:30-9:25 a.m. ET session for select single-stock options starting August 17, 2026. Here's which contracts qualify, how the opening works, and why an early quote isn't the same as a fair one.

Jul 22, 202682
Big Tech earnings face oil-driven market volatility as AI stocks, crude prices, and Treasury yields shape the trading week.

Weekly Market Insights July 20–24, 2026: Can Big Tech Earnings Repair the AI Trade—or Will Oil Keep Control?

Prepare for Alphabet, Tesla, Intel, the ECB, flash PMI, and oil-driven volatility with a focused July 20–24 market map, watchlist, scenarios, and risks.

Jul 20, 2026305
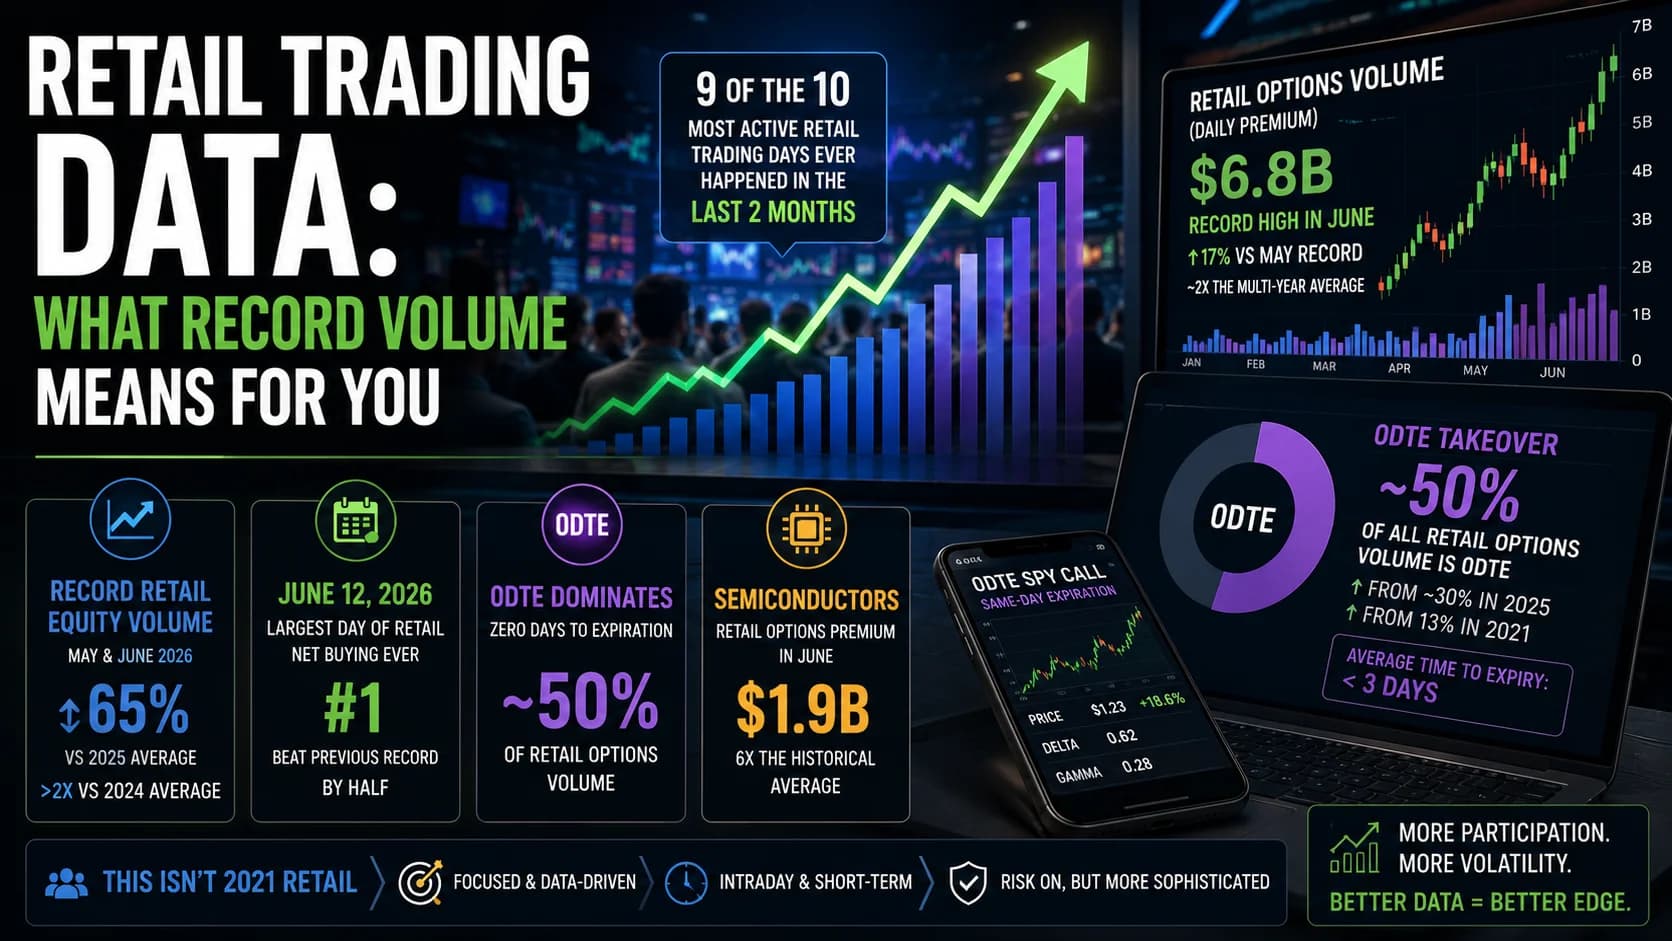
Retail trading volume infographic showing record equity and options activity, 0DTE options growth, semiconductor trading concentration, and market data trends affecting day traders.

Retail Trading Just Broke Every Volume Record — Here's What the Data Shows

Citadel Securities data shows retail traders just posted record volume, with 0DTE options now nearly half of all retail options activity. Here's what the numbers actually mean for day traders heading into Q2 earnings.

Jul 16, 2026154
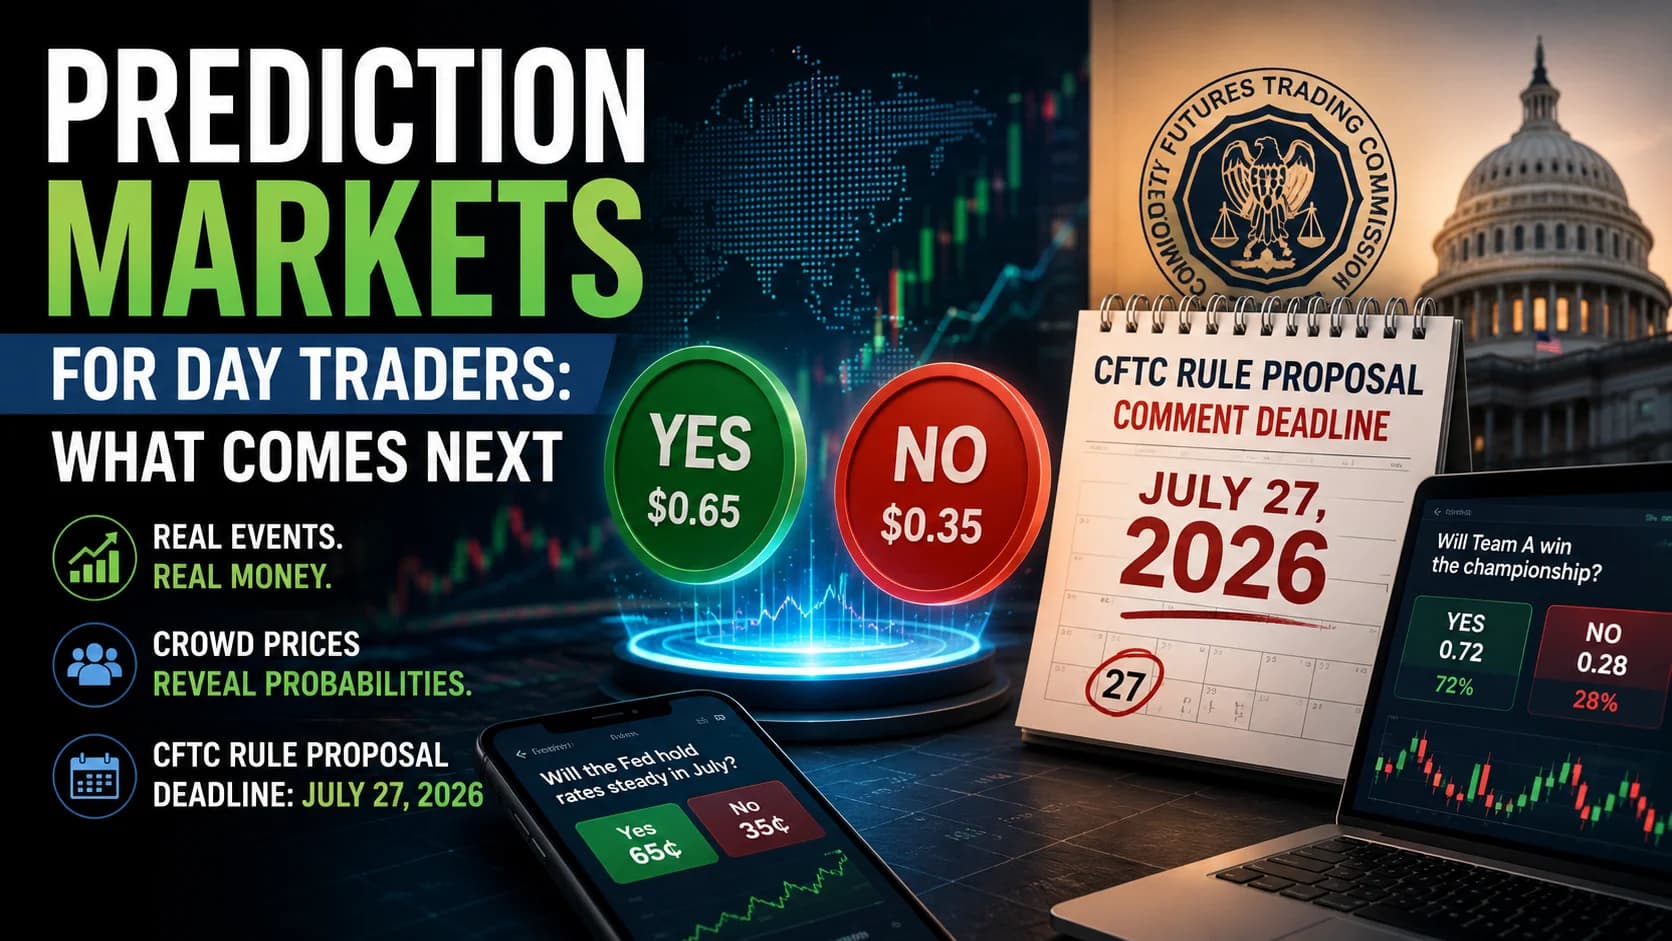
Prediction markets for day traders featuring event contracts, probability-based YES/NO trading interface, market charts, and CFTC regulatory oversight ahead of the event contract rule proposa

Prediction Markets Are Booming — And a CFTC Deadline Could Decide What's Tradable

Kalshi, Polymarket, and Robinhood's Rothera just posted record volume — and a CFTC rule proposal closing for comment July 27, 2026 will decide which event contracts stay tradable. Here's the day-trader's guide to what's actually happening.

Jul 16, 2026119
Weekly Market Insights featured image highlighting July 13–17 market outlook with CPI inflation data, major bank earnings, Federal Reserve testimony, and oil market volatility.

Weekly Market Insights: Week of July 13–17, 2026

Iran and the US traded strikes over Hormuz, oil jumped 4%, and Tuesday brings CPI, five bank earnings, and Warsh's first testimony. The full week ahead for active traders.

Jul 13, 202668
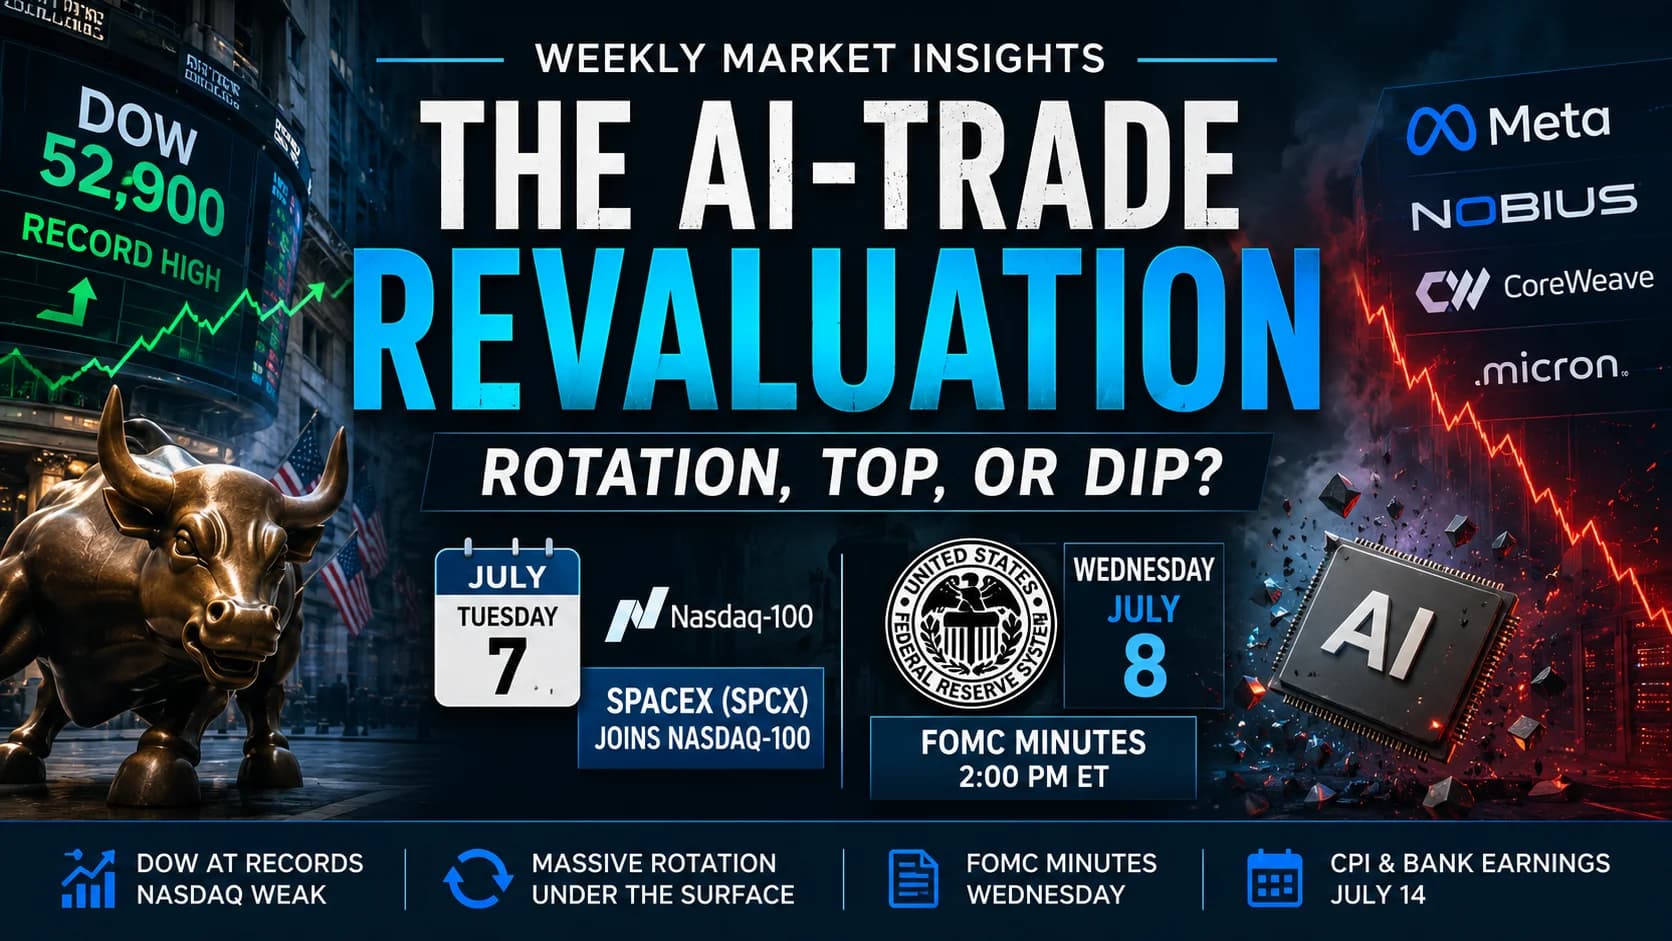
Weekly Market Insights for July 6–10, 2026 featuring Wall Street, stock market charts, AI trade revaluation, sector rotation, FOMC minutes, and key market events for the week.

Weekly Market Insights: Week of July 6–10, 2026

The Dow hit a record while semis and AI-cloud names cracked. Is the AI-trade revaluation a rotation, a top, or a buyable dip? Plus FOMC minutes and the week.

Jul 6, 2026409
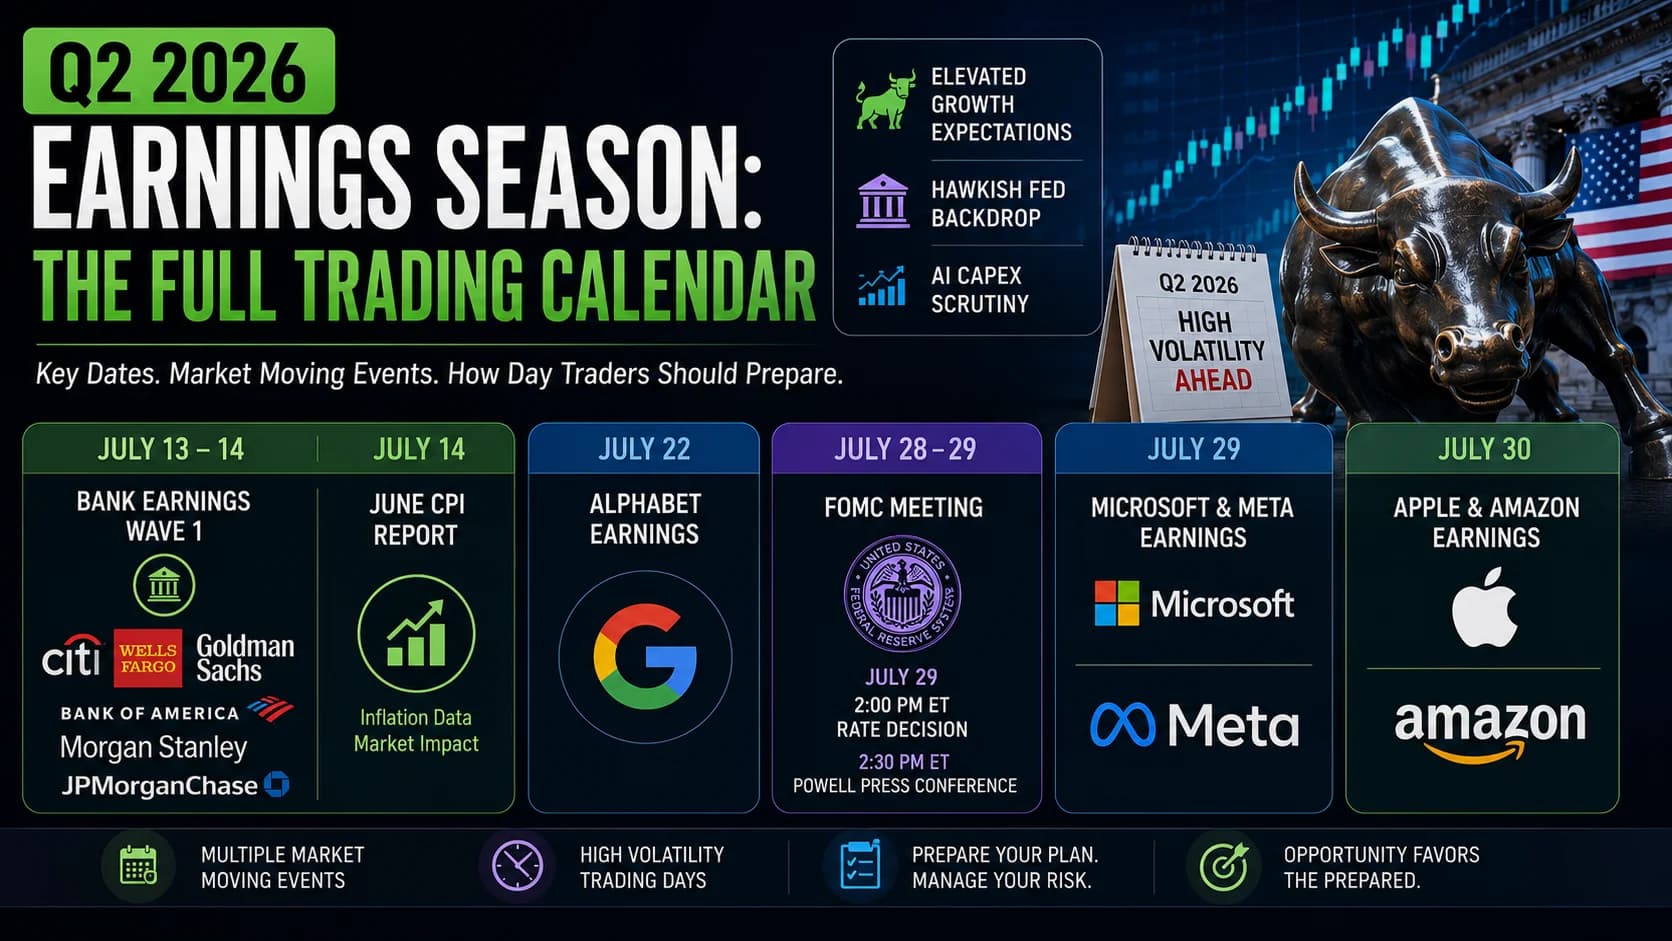
Q2 2026 earnings season featured image showing the July earnings calendar, Federal Reserve meeting, Big Tech earnings, and key market events for day traders.

Q2 2026 Earnings Season: The Full Trading Calendar

Q2 2026 earnings season collides with a hawkish Fed and heavy AI capex scrutiny. Full date-by-date calendar for July's key days and how day traders should prepare.

Jul 4, 20262,110
SpaceX Nasdaq-100 inclusion featured image showing a SpaceX rocket, Nasdaq market display, stock charts, and the July 7 index addition event for day traders.

SpaceX Joins the Nasdaq-100: How to Trade July 7

SpaceX joins the Nasdaq-100 July 7, forcing roughly $4.3B in passive buying. Here's the mechanics, the real history, and how day traders should approach it.

Jul 4, 202677
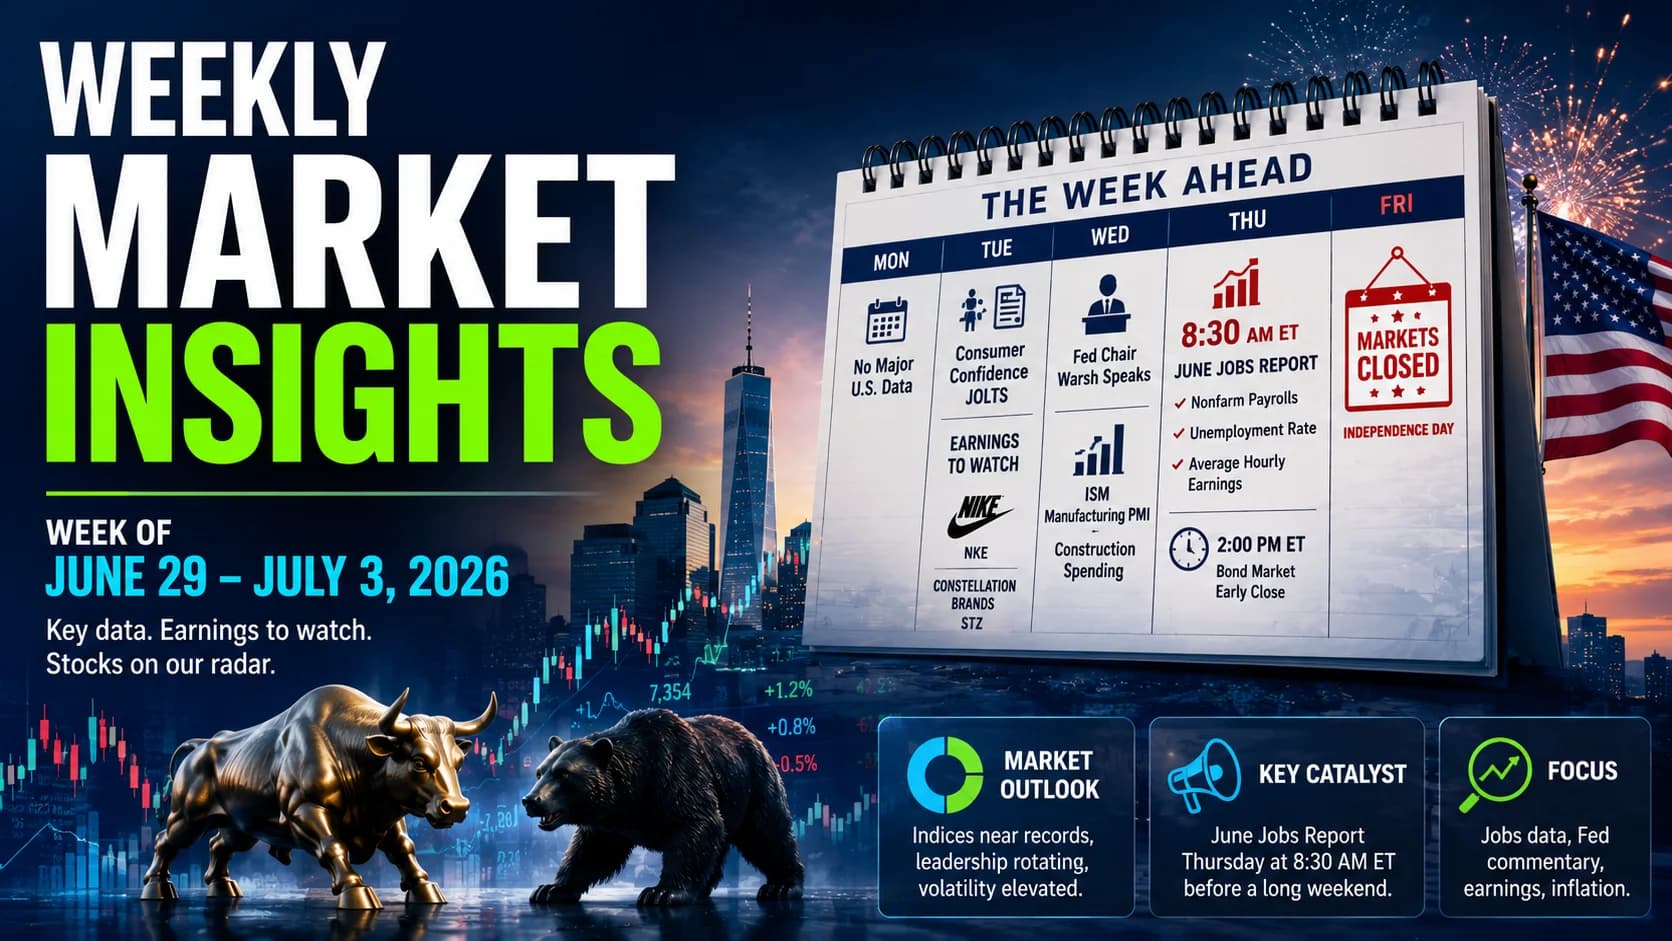
Weekly Market Insights for June 29 to July 3, 2026 featuring the U.S. stock market outlook, economic calendar, jobs report, earnings week, and bullish versus bearish market sentiment.

Weekly Market Insights: Week of June 29 – July 3, 2026

June's jobs report lands Thursday before a closed Friday, and under a hawkish Warsh Fed a strong print could pressure stocks. Plus Nike, Micron and more.

Jun 29, 2026291
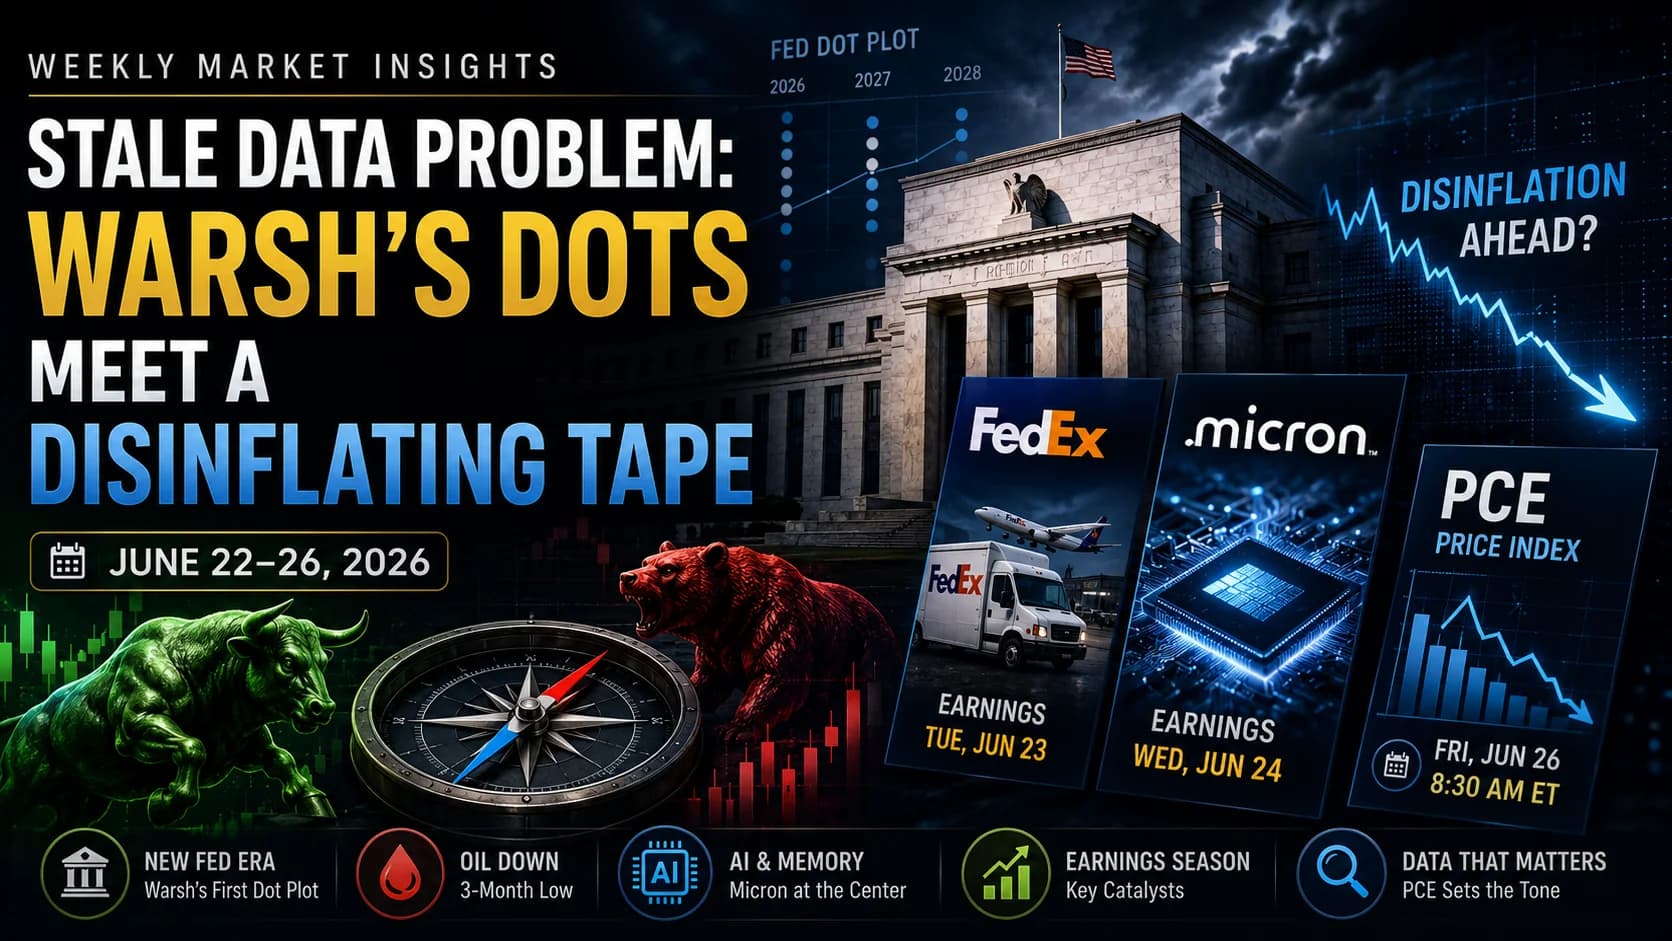
Weekly Market Insights June 22–26, 2026 featuring Fed policy, PCE inflation, Micron earnings, and major market catalysts.

Weekly Market Insights: Week of June 22–26, 2026

A full week ahead: Micron's ±17% earnings, FedEx, Friday's PCE print, and what Warsh's hawkish first dot plot means now that forward guidance is gone.

Jun 22, 2026107
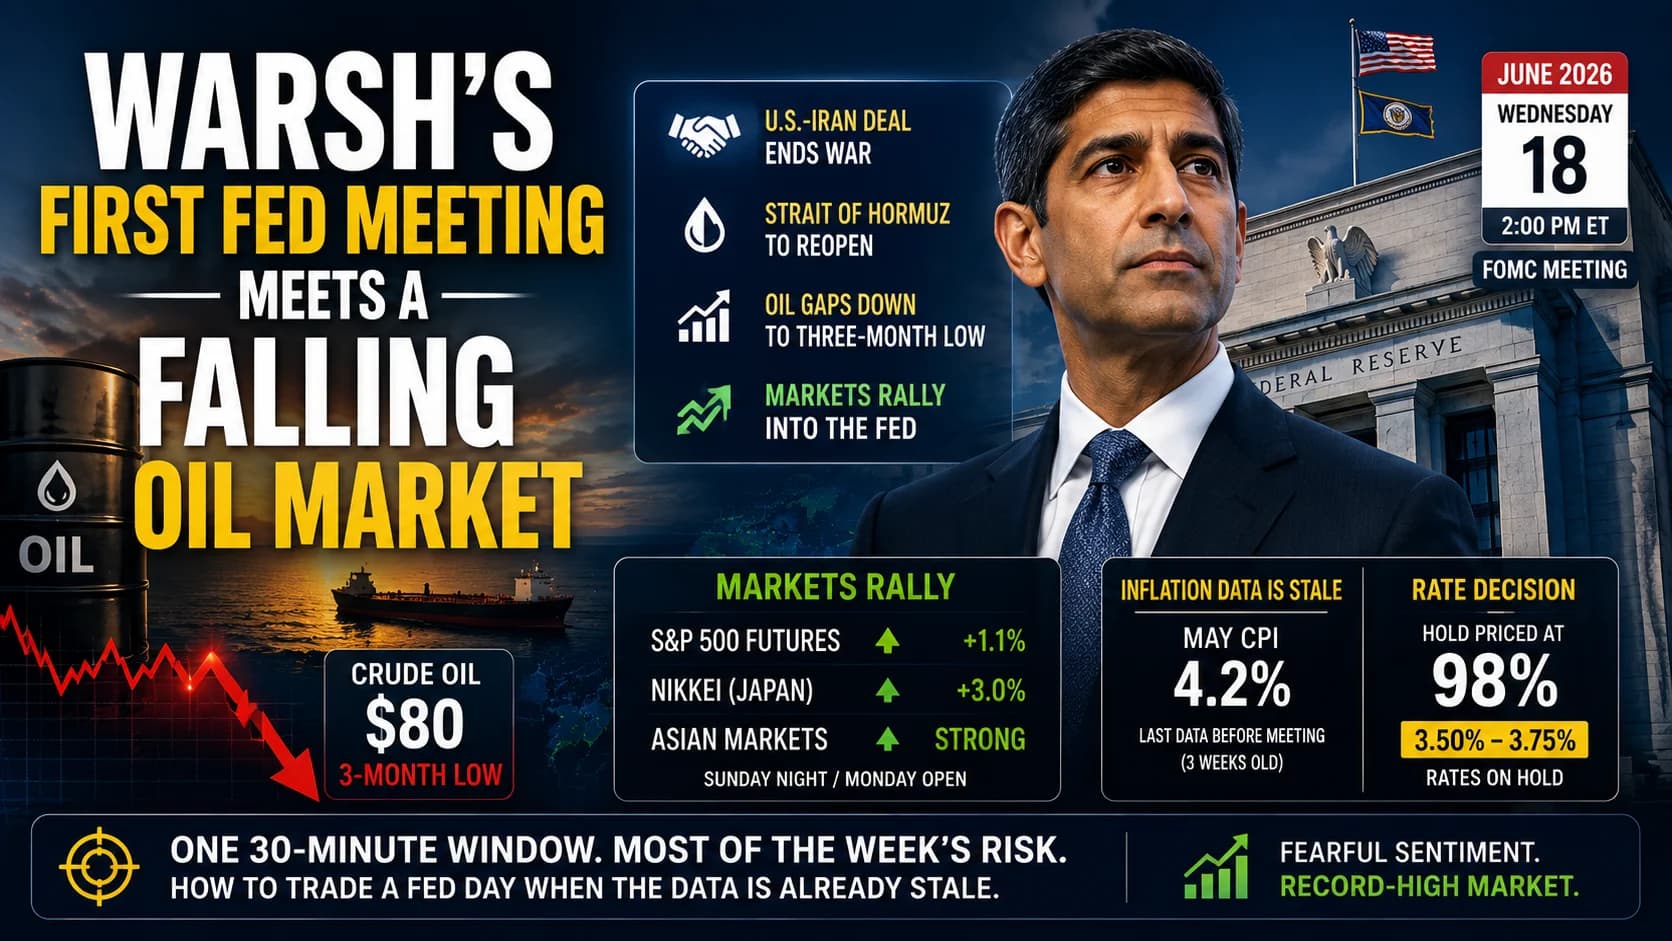
Featured image for a weekly market insights article showing Kevin Warsh’s first FOMC meeting, falling crude oil prices, the U.S.-Iran deal, stale inflation data, and market rally risk.

Warsh's First Fed Meeting Meets a Falling Oil Market: Weekly Market Insights— June 15–19, 2026

The U.S.-Iran deal sent oil to a three-month low days before Kevin Warsh's first FOMC meeting. Here's what we're watching when the Fed's data is already stale.

Jun 15, 2026136
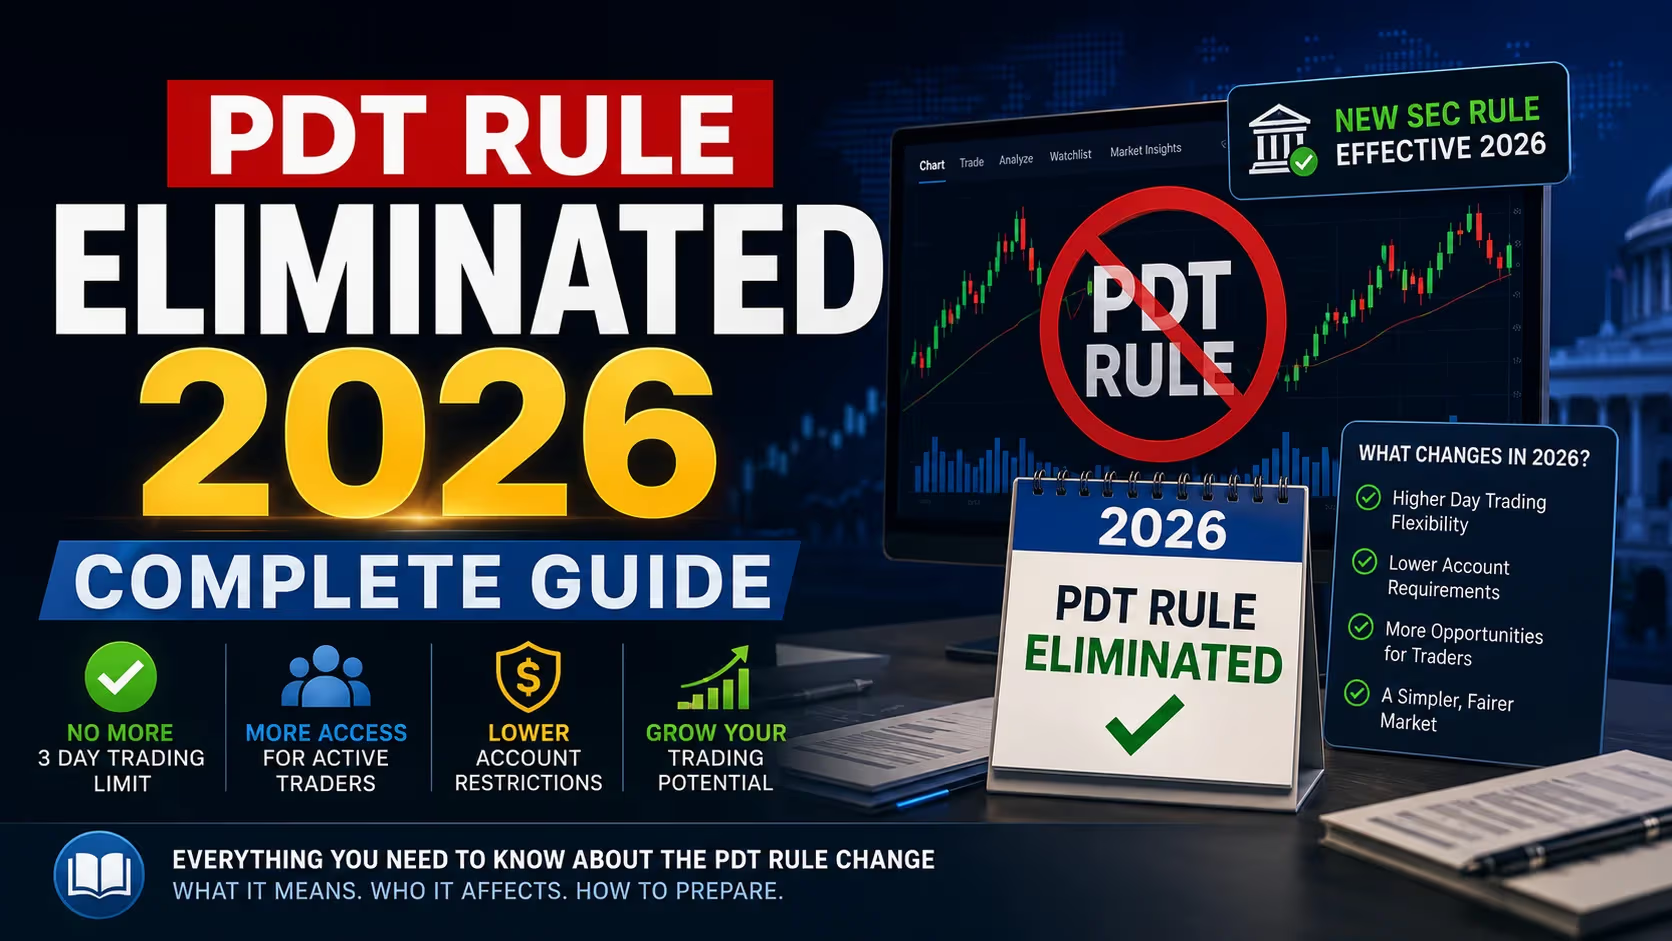
PDT rule gone featured image showing the $25K day trading wall breaking down with stock market charts in the background

The $25,000 Wall Is Down: What the PDT Rule Change Means for Day Traders Now

The $25,000 PDT minimum ended June 4, 2026. Here's what the rule change means for day traders — and how to capitalize on the new access.

Jun 6, 2026105
Weekly Market Insights featured image showing stock charts, Federal Reserve imagery, oil market risk, and geopolitical tension for the May 26–May 29 trading week.

Warsh Just Took Over The Fed. Now The Hard Week Starts: Weekly Market Insights May 26 - May 29

Kevin Warsh was sworn in as Fed chair Friday. An Iran peace deal is pending. PCE drops Thursday. Here's the 4-day gauntlet day traders need this week.

May 24, 202662

Frequently Asked Questions

How do you separate important market news from noise as a day trader?

The filter is whether the news changes something a significant number of market participants will act on — and whether that action will show up in price within your trading timeframe. A Fed rate decision moves every rate-sensitive stock in the market within minutes. A mid-tier analyst note on an obscure small-cap may move one stock for one morning. The difference is scope and the number of participants who are forced to respond.

For intraday traders, the most reliable signal is price and volume response to news — not the news itself. A headline that looks significant but produces no volume and no sustained move tells you the market already knew or does not care. A headline that looks minor but immediately causes a stock to trade 5x its normal volume tells you participants are responding, regardless of whether the fundamental importance seems obvious.

Market insight articles here cover specific events and catalysts from a trader's perspective — what moved, how much, for how long, and what the setup looked like — so you build a reference library for how similar events have behaved rather than interpreting each new event in isolation.

What types of market events create the best conditions for day trading?

The best conditions combine elevated volatility, high volume, and a clear directional catalyst. Earnings seasons, FOMC decision days, major economic data releases, and geopolitical events that create genuine uncertainty all increase intraday range and participation. When more participants are active and ranges are wider, skilled traders have more opportunities to find setups with favorable risk-reward profiles.

The worst conditions for day trading are low-volume, low-volatility sessions with no catalysts — typically summer holiday weeks, the week between Christmas and New Year, or sessions where the market is waiting on an event the following day and participants are not committing. Chasing setups in these conditions produces smaller moves, more false breakouts, and worse fills.

Market insight articles here analyze upcoming event-heavy weeks in advance — covering what is on the calendar, which events historically produce the most intraday volatility for equities, and how to calibrate your expectations and position sizing going into a high-event week versus a quiet one.

How do you adapt your trading when broader market conditions shift significantly?

The first step is recognizing that conditions have shifted — which sounds obvious but is harder in practice. Most traders notice a strategy is not working and attribute it to execution errors or bad luck before recognizing that the market environment itself changed. A momentum strategy that worked in high-VIX, high-volume conditions will underperform in a low-VIX, low-volume grind — not because the strategy is broken but because the environment no longer favors it.

Adaptation starts with reducing size until you understand the new regime, not with immediately switching to a different strategy. Experimenting with multiple new approaches simultaneously in a changed environment is a reliable way to produce losses while confused. Staying small, observing, and identifying which setups are still working — even if fewer of them — is the more controlled response.

Market insight articles here provide weekly context on what kind of environment is developing — trend days versus range days, high-volatility event weeks versus quiet consolidation periods — so you have the situational awareness to calibrate before conditions reveal themselves in your P&L.

How does Fed policy direction affect day trading conditions beyond just FOMC days?

Fed policy direction sets the background risk appetite that shapes day trading conditions across every session, not just on decision days. A rate-cutting cycle tends to support risk appetite, push capital toward growth and momentum stocks, and create an environment where breakout setups follow through more reliably. A rate-hiking cycle tends to compress multiples, increase sector rotation volatility, and make trend-following harder as rates create headwinds for the largest index components.

The market's interpretation of Fed direction also matters more than the rates themselves. A Fed that markets believe is done hiking creates different conditions than one still perceived as hawkish — even at the same rate level. Trading around Fed communication — statements, speeches, meeting minutes — requires understanding not just what was said but how it shifted the market's expectations relative to what was already priced in.

This hub tracks Fed-related developments as they occur — new chair transitions, policy language shifts, dot plot revisions — and translates them into what they mean for the intraday conditions day traders are operating in, week by week.

How often do market structure changes affect how day traders operate?

More often than most traders expect, and usually with less warning than you would want. The PDT rule elimination in June 2026 changed the account requirements and buying power mechanics for margin accounts. Extended trading hours to 23 hours a day changed when price discovery happens and when liquidity is actually available. SEC enforcement actions, exchange rule updates, and broker policy changes all alter the practical conditions of trading.

The traders who get caught off-guard by these changes are the ones who treat their trading rules as permanent infrastructure rather than policies that respond to a changing regulatory environment. What worked under the PDT rule may need adjustment now that the rule is gone. A strategy built around specific margin assumptions needs review when FINRA updates those calculations.

This hub tracks the regulatory and market structure changes that affect active day traders — covering not just what changed but what you specifically need to review, update, or reconsider in your own setup as a result.

How do regulatory changes like the PDT rule elimination actually affect trading strategy?

The PDT rule elimination removes the $25,000 minimum equity requirement for day trading in margin accounts, which changes who can participate and how accounts under that threshold need to be managed. Traders who previously used cash accounts to avoid the PDT restriction can now access margin without the equity hurdle — but need to understand the new intraday margin deficit rules that replaced it.

Strategically, the change opens certain position types to smaller accounts that were previously restricted: short selling, intraday leverage, and same-day capital recycling across multiple trades. But it also introduces new failure modes — specifically the 90-day trading restriction triggered by an unresolved intraday margin deficit — that cash account traders never had to think about.

This hub covered the PDT elimination in detail as it unfolded, including what the new FINRA margin framework actually requires, which broker implementations differ from the standard, and the specific checklist traders should run to ensure their account setup is correctly configured under the new rules.

What is the difference between a market event mattering for investors versus day traders?

An event matters for investors when it changes the fundamental valuation of a business — earnings that miss long-term growth expectations, a regulatory ruling that affects a company's addressable market, or a macro shift that reprices an entire sector over months. These events matter over weeks and quarters, and the initial market reaction often overshoots in both directions before the true fundamental impact is priced in.

For day traders, the same event matters in a completely different way — specifically whether it creates intraday volatility and volume within the trading session. A stock that gaps up 10% on earnings and then consolidates at that level for the rest of the day has created one type of opportunity. A stock that gaps up 10% and immediately starts reversing creates a different one. The fundamental question of whether the earnings were "good" is almost irrelevant to how the intraday setup plays out.

Market insight analysis here is written specifically for the intraday perspective — covering how events have historically affected same-day volatility, volume, and price behavior rather than what they mean for the business or the stock over the next quarter.

How do you use weekly market previews to prepare for the trading week?

A useful weekly preview answers three specific questions before Monday's open: what are the highest-impact scheduled events this week and on which days, what sectors or stocks are most likely to be in play around those events, and what is the current market context — trend, volatility regime, and any unresolved catalysts from the prior week that are still affecting positioning.

The mistake is treating market previews as general background reading rather than specific preparation. Reading that "earnings season is busy this week" is less useful than knowing which specific days the highest-market-cap companies report, which sectors those reports will move, and what the options market is implying about expected move magnitude. Specificity is what makes a preview actionable rather than atmospheric.

Market insight previews in this hub are written from a trader's perspective — covering the specific events, the relevant stocks, and the historical context for how similar setups have played out — so you start each week with a framework rather than waiting for the market to tell you what matters.