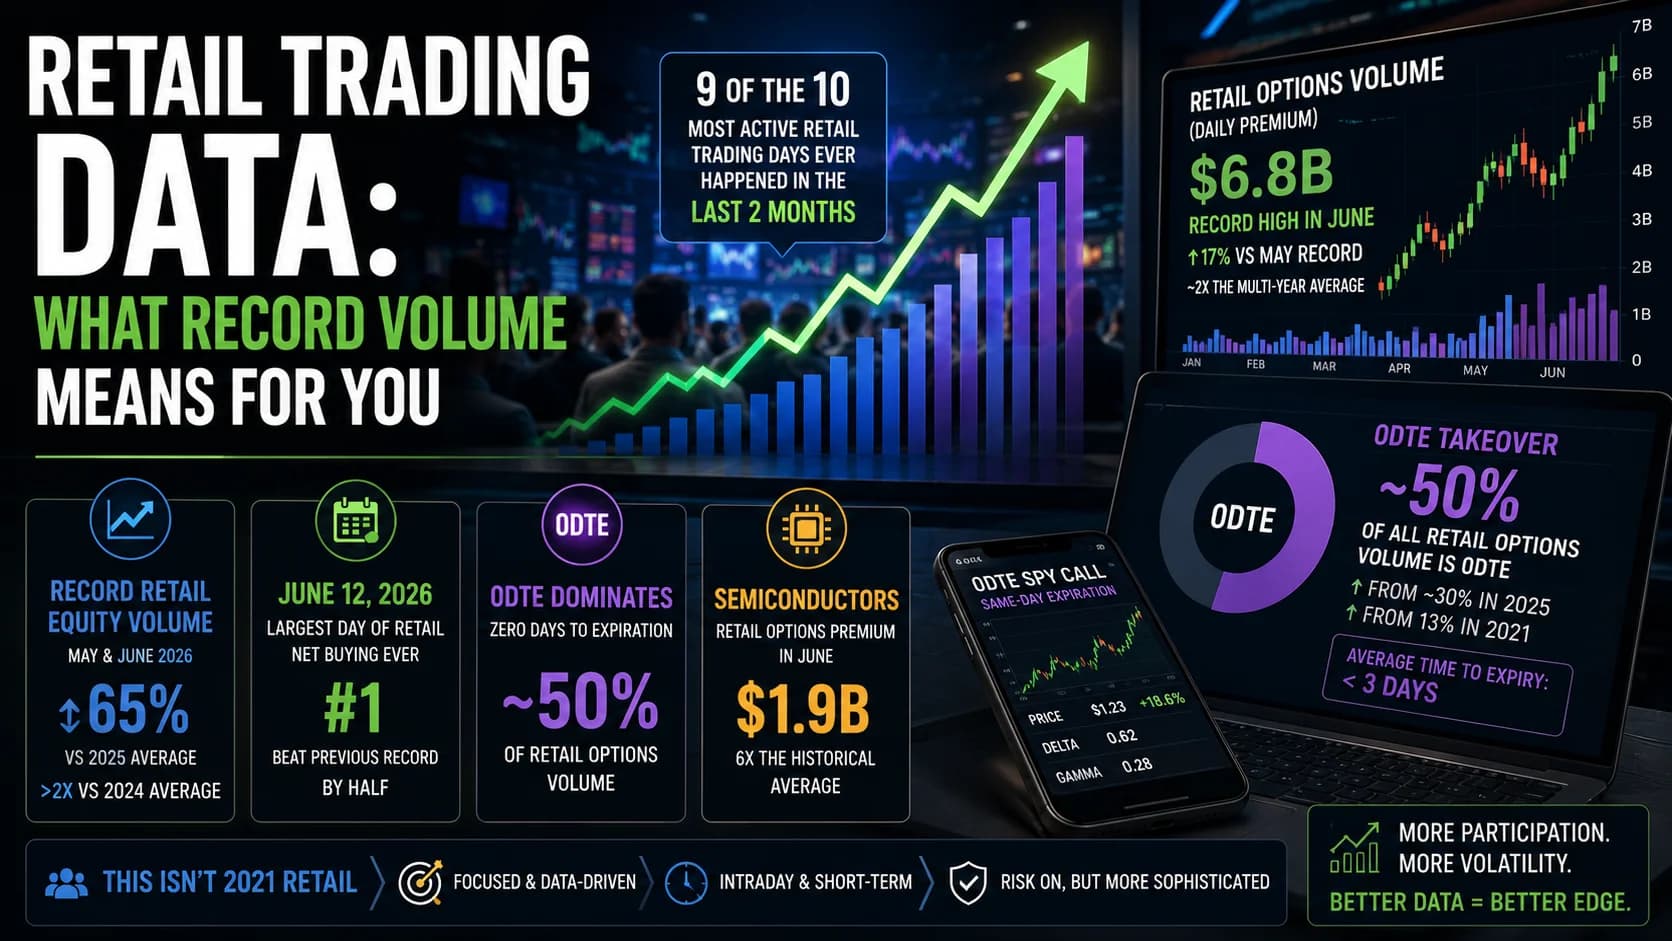
Nine of the ten most active retail trading days ever recorded happened in the last two months. Not the last two years — the last two months. And nearly half of every retail options trade placed right now expires before the closing bell the same day it was opened.
Those aren't estimates. They come from Citadel Securities, the market maker that executes roughly 35% of all U.S.-listed retail VolumeVolume is the total number of shares (or contracts) traded during a given time period — it's the primary confirmation tool for all price action, because a price move accompanied by high volume indicates genuine market participation, while tRead definition → — meaning it has a better view of what retail traders are actually doing, in real time, than almost anyone outside a handful of exchanges. Its research desk publishes a regular flow briefing, and the last few editions describe a retail trader who behaves nothing like the one from 2021.
What does 0DTE mean? 0DTE stands for zero days to expiration — an options contract that expires the same trading day it's bought or sold. There's no overnight decay to manage and no multi-day thesis required; the entire trade lives and dies within a single session.
The Headline Numbers: Retail Trading Just Broke Every Record It Had
Start with the plain volume. Retail cash equity trading in May and June 2026 ran roughly 65% above 2025's average and more than double the 2024 average, according to Citadel's semiannual market structure review published June 30. Nine of the ten busiest retail trading days the firm has ever logged occurred during that same two-month stretch, seven of them in June alone. June 12 stands out specifically — Citadel recorded it as the single largest day of retail net buying in its dataset, beating the prior record by half.
Options tell a similar story, except louder. Retail traders moved a record $6.8 billion of options premium per day in June, 17% above May's own record and roughly double the multi-year historical average. This isn't a one-month spike, either — Citadel's mid-June flow note, published while the month was still in progress, already had daily retail options volume tracking 20% above May's then-record pace before June even finished.
Where This Data Actually Comes From
Worth pausing on the source before going further, because it shapes how much weight to put on any of this.
Citadel Securities isn't a government agency or an academic research shop — it's a for-profit market maker publishing proprietary flow data, and roughly 35% of retail volume, however large, is still a sample, not the whole market. The firm has an obvious commercial interest in being seen as the authority on retail behavior. That said, its scale is genuinely unmatched for this specific question: no FINRA report or academic study gets same-week visibility into tens of millions of retail orders the way a top retail market maker does. Treat these numbers the way you'd treat any single, well-positioned data provider — informative, directionally reliable, and not the final word.
The 0DTE Takeover: Half of All Retail Options Volume
This is the single most important number in the entire dataset for anyone who trades intraday.
Zero-days-to-expiration contracts now account for close to half of all retail options volume, up from roughly 30% in 2025 and just 13% in 2021, per Citadel's June data. Average time to expiry across the retail options book has fallen to under three days. Our 0 DTE options trading guide covers the mechanics in depth — the short version is that 0DTE options carry extreme GammaGamma is the options Greek that measures the rate of change in delta for every $1 move in the underlying stock — high gamma means delta shifts rapidly as price moves, making the option increasingly sensitive to further price movement, and iRead definition → sensitivity, meaning small moves in the underlying stock produce outsized, fast-compounding swings in the option's value as expiration approaches.
What that means at the index level: a meaningful and growing share of the options market is now dominated by contracts that behave almost like lottery tickets rather than instruments with a multi-day thesis behind them. Market makers hedging that flow have to buy and sell the underlying stock throughout the day to stay neutral, and that hedging activity itself can accelerate intraday moves in either direction. The retail options desk isn't a side story anymore — it's become a genuine driver of same-day price action in the names it concentrates in.
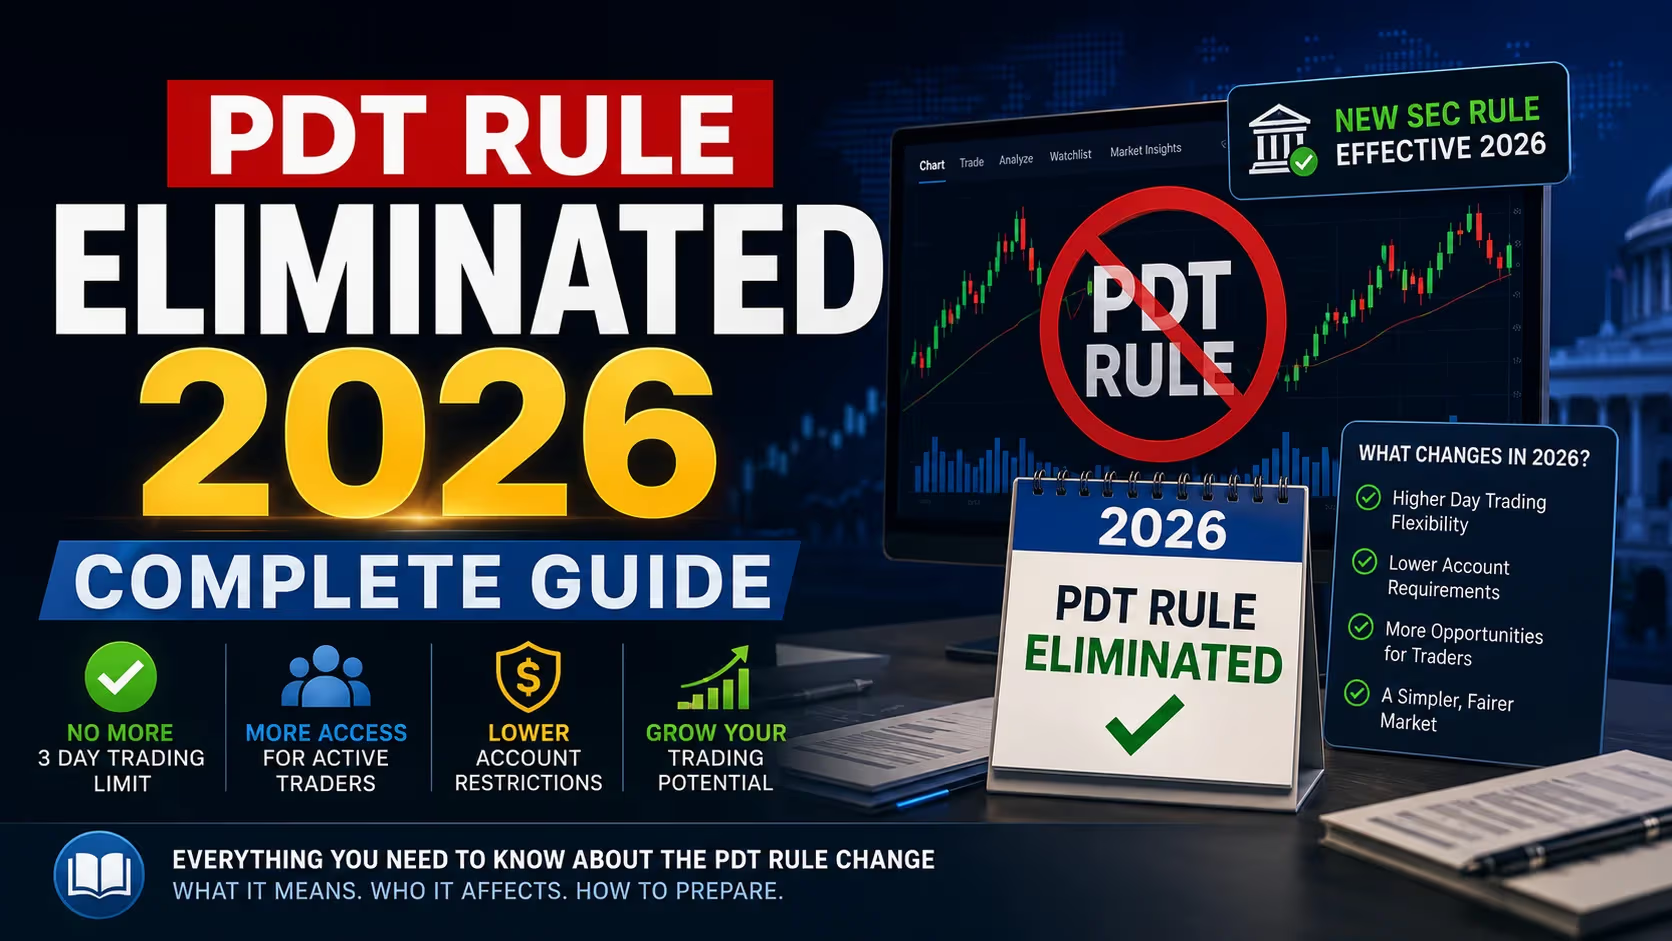
Cboe's own exchange-wide numbers, published in its Q2 2026 State of the Options Industry report, back up what Citadel is seeing on the retail side and push the story further. 0DTE contracts made up roughly 65% of total SPX index options volume as of May 2026, up from just 22% back in 2022, and Cboe's own materials draw a direct line between that acceleration and the PDT rule's elimination in June 2026. With the old $25,000 pattern day trader minimum gone, a meaningful chunk of the friction that used to keep smaller accounts out of same-day options activity disappeared at the same time 0DTE adoption was already climbing. Individual investor participation in 0DTE trading reached 65% of retail customer average daily volume by May, essentially matching the SPX-wide figure — the retail-specific and market-wide numbers are now telling the same story from two different vantage points.
Why Semiconductors Are Absorbing Almost All of It
And it does concentrate. Retail traded roughly $1.9 billion a day in semiconductor options premium in June — six times the historical average, with about three-quarters of that activity sitting in calls, according to Citadel. Nasdaq rallies in May came paired with rising Implied VolatilityImplied volatility (IV) is the market's forward-looking estimate of how much a stock will move, derived from current option prices — high IV means options are expensive because the market expects big moves, low IV means options are cheap beRead definition → around 70% of the time, the highest monthly reading since 2005 and more than triple the long-run average — the opposite of how volatility normally behaves in a calm uptrend, and a sign that traders were paying up for continued upside rather than treating the rally as safe.
The concentration shows up in the index math too. Semiconductor companies made up about 18% of the S&P 500 as of July 2026, up from 12% a year earlier, 5% five years ago, and just 3% a decade ago, per Citadel's July 13 note. Three-month implied volatility across the ten largest chip names has climbed from 29% in 2016 to nearly 73% now — the options market has effectively re-rated the entire SectorA broad grouping of companies that operate in the same segment of the economy — such as Technology, Healthcare, Energy, or Financials. Stocks within a sector tend to move together in response to shared economic, regulatory, and sentiment faRead definition → as structurally more volatile, not just temporarily hot.
This Isn't 2021 Retail — Here's What's Actually Different
Anyone who traded through the 2021 meme-stock period will recognize the volume numbers but not the pattern underneath them, and that distinction matters more than the headline stats do.
2021's retail surge concentrated in idiosyncratic, high-short-interest small caps — the trade was finding the next overlooked name before the crowd did. Today's retail flow, by Citadel's own framing, increasingly mirrors institutional positioning: the same mega-cap and semiconductor names that dominate index returns are also where retail options premium is piling up. That's a fundamentally different behavioral pattern. It's less "find the hidden gem" and more "pile into the trade everyone already agrees on" — which changes the risk profile entirely. A crowded idiosyncratic trade can blow up one stock. A crowded consensus trade concentrated in the names that already drive the index can amplify moves across the entire market at once.
It's part of a broader pattern, too — the same retail appetite for fast, concentrated bets shows up in prediction markets and event contracts, which posted their own record volume this same stretch. Whether it's a same-day options contract or a binary event contract, the through-line is a retail trader increasingly drawn to short-dated, high-conviction bets rather than longer-horizon positioning.
One statistic captures just how unusual the current setup is: three-month implied correlations between individual stocks fell to their lowest level in 15 years, per the June 30 report. Read literally, that says stocks are moving less like a herd and more independently of each other — genuinely good news for anyone whose edge is picking individual names rather than betting on index direction. Read alongside the semiconductor concentration data, though, it also means a huge and growing share of retail dollars is betting heavily on outcomes for a fairly narrow list of related companies, even while the broader market fragments into more independent stories.
What's Happening Right Now, and Why the Next Two Weeks Matter
Citadel's freshest note, published July 13, adds real-time texture to the TrendA trend is a sustained directional movement in price over time — an uptrend is characterized by a sequence of higher highs and higher lows, a downtrend by lower highs and lower lows — and correctly identifying the current trend direction isRead definition → rather than just more of the same records. As of that date, the firm's retail platform had not logged a single net-sell day for the entire month of July. Daily net buying was running at roughly 3.2 times the historical monthly average, putting July 2026 on pace as the second-strongest month for retail net buying since January 2020 — and the strongest July the firm has on record. The final week of June into the first week of July produced the two strongest weeks of momentum-factor retail buying the platform has ever measured, with July 1 alone seeing net buying run nearly 12 times the trailing one-year average.
There's a genuine crack worth watching, though, and it's the first one in months. Retail sold semiconductor and hardware names on the SOX's two most recent down days — a real break from the buy-every-dip pattern that had defined the entire cycle up to that point. Both selloffs were followed by sharp rebounds, so it hasn't cost anyone money yet. But it's the first sign that the semiconductor trade, the single most crowded corner of this entire retail surge, might have a limit to how automatically it gets bought on weakness.
Some of the mechanical pressure that built up earlier in the summer is also easing, which matters for anyone worried this rally is purely a leverage story. Leveraged ETF assets had swelled to a record $218 billion by late June, but had already contracted to roughly $198 billion by mid-July — a pullback of about 10%, concentrated mostly in semiconductor-linked products, which fell closer to 20%. Smaller leveraged ETF assets mean less forced, mechanical rebalancing at the close each day, which typically means fewer artificial end-of-day price swings. Financing costs have eased too: one-month equity financing spreads, which had spiked to 138 basis points over SOFR, had come back down to around 60 basis points by mid-July, making it cheaper to hold long positions on margin.
The next two weeks carry real event risk on top of all this. Roughly 36% of S&P 500 weight and 33% of Nasdaq 100 weight are scheduled to report earnings between July 27 and July 31, including four of the Mag 7 — Citadel's own framing calls it the heaviest single week of the entire earnings season. Consensus sits at 22.4% year-over-year EPS growth for the quarter, a number that would rank among the strongest readings outside a recession recovery if it holds. Semiconductor companies, unlike most sectors, report throughout the calendar rather than in one concentrated week, which means the elevated implied volatility in that corner of the market isn't going away once late July passes — it stays elevated into August.
What This Means for Your Trading
Three practical things fall out of all this if you're actually trading intraday rather than just reading about it.
First, liquidity and spread behavior in mega-cap and semiconductor names is now shaped as much by retail options flow and market-maker hedging as it is by traditional institutional order flow. If your setups depend on reading volume and price action in names like the largest chipmakers, you're increasingly reading a market where a meaningful slice of the volume is same-day options hedging rather than directional conviction. Our relative volume guide is worth revisiting with that context in mind — a volume spike in a heavily 0DTE-traded name doesn't necessarily mean what it used to.
Second, the correlation breakdown is a real opportunity for anyone whose edge is stock selection rather than macro direction. When individual stocks move more independently of each other, strategies built around finding the right name — not just riding the tape — get more room to work. Our guide to identifying the market regime covers how to read whether you're in a stock-picker's market or a macro-driven one; right now, by Citadel's own correlation data, it's clearly the former.
Third, the leadership broadening documented in the July 13 note is worth tracking on its own. Since early June, a majority of S&P 500 constituents have finished higher on the index's down days noticeably more often than the trailing-year norm — a sign that money rotating into previously lagging sectors like Communication Services and Financials is cushioning broad selloffs rather than every stock falling together. If you scan for sector rotation setups, this is exactly the environment our sector rotation strategy guide is built for, and a scanner that can flag relative strength shifts across sectors in real time — something a platform like Trade Ideas is built to do — earns its keep in a market moving like this one.
The Real Risks in a Retail-Driven Market
None of this is a reason to chase the trend blindly, and it's worth being direct about why.
A market this concentrated in a handful of retail-favorite names carries a specific kind of fragility. When a huge share of trading activity is chasing the same semiconductor names, wrapped in the same short-dated option structures, a single disappointing earnings print or guidance cut in one of those names can trigger outsized, correlated selling across the whole group — precisely because so many traders are positioned the same way. The two recent SOX down days where retail actually sold, rather than bought the dip, are a small preview of what that looks like when the pattern breaks.
0DTE concentration carries its own behavioral risk independent of the market structure story. A contract that lives and dies in a single session rewards constant checking and fast reflexes, and it punishes hesitation just as fast. If you already recognize overtrading tendencies in your own history, a market environment saturated with same-day options activity is not the place to test new limits — the instrument is specifically built to compound impulsive decisions quickly, in both directions.
And a general caution applies to leaning too hard on any single data provider's framing, however good the access. Citadel's numbers describe what already happened through mid-July. They don't guarantee the pattern continues through the earnings gauntlet at the end of the month, and a firm with a business interest in an active, liquid retail market has no reason to frame the data any way other than constructively.
Frequently Asked Questions
Is retail trading volume actually at an all-time high right now?
Citadel executes roughly 35% of all U.S.-listed retail volume, giving it one of the best available vantage points on retail behavior, though it's still a sample rather than the entire market. Cash equity volumes in May and June ran about 65% above the 2025 average, and the firm logged its single largest day of retail net buying ever on June 12, 2026.
Key Takeaway: Take "all-time high" claims from any single data provider as directionally strong but not definitive — Citadel's numbers are the best publicly available proxy, not a government census of the whole market.
What percentage of options trades are 0DTE right now?
Average time to expiry across the retail options book has fallen under three days. That's a structural shift in how retail traders are using options — increasingly as same-day directional bets rather than multi-week positions, which changes both the risk profile of individual trades and the hedging behavior of market makers in the underlying stocks. Cboe has tied the acceleration directly to the PDT rule's elimination in June 2026, which removed a major barrier that used to keep smaller accounts out of frequent same-day trading.
Key Takeaway: If you trade options at all, assume same-day expiring contracts are now shaping intraday price action in a way they weren't even two years ago.
Why are semiconductor stocks absorbing so much retail options activity?
The sector's implied volatility has repriced structurally alongside that growth — three-month implied volatility on the ten largest chip names has risen from 29% in 2016 to nearly 73% now. Retail activity in the space is roughly 75% calls, reflecting a persistent bullish lean rather than balanced two-sided positioning.
Key Takeaway: Semiconductor options are no longer a niche corner of the market — they're increasingly a proxy for overall retail sentiment and index direction alike.
How is today's retail trader different from the 2021 meme-stock trader?
That's a meaningfully different risk pattern. A crowded small-cap trade can blow up in isolation without moving the broader market. A crowded trade concentrated in names that already carry heavy index weight can amplify moves across the whole market simultaneously when it unwinds.
Key Takeaway: Don't assume today's "retail is back" headlines describe the same behavior as 2021 — the concentration and the instruments have both changed meaningfully.
What does the drop in stock correlation actually mean for day traders?
That's generally favorable territory for strategies built around picking individual names rather than betting on broad index direction, since stock-specific catalysts matter more when correlations are low. Our guide to identifying the market regime covers how to recognize and adapt to this kind of environment specifically.
Key Takeaway: Low correlation rewards genuine stock selection — this is a better backdrop for scanning individual setups than for trading the index as a single proxy.
Is retail still buying every dip, or is that changing?
Both selloffs were followed by sharp rebounds, so the break hasn't been costly so far. But it's worth watching as a potential early signal, since the semiconductor trade is also the single most crowded corner of the entire retail surge.
Key Takeaway: The buy-the-dip reflex is still largely intact, but the one sector where it just cracked is also the sector carrying the most retail concentration risk.
What's the significance of the week of July 27–31, 2026?
Consensus expects 22.4% year-over-year EPS growth for the quarter. Given how concentrated current retail options activity is in the same mega-cap and semiconductor names reporting that week, the results have outsized potential to move both individual stocks and the broader index at once.
Key Takeaway: Plan your risk sizing around this specific week if you trade any of the Mag 7 or major semiconductor names — the combination of heavy retail positioning and concentrated earnings risk is unusual even by earnings-season standards.
Are leveraged ETFs still fueling this rally, or is that fading?
Smaller leveraged ETF assets translate directly into less forced, mechanical rebalancing activity at the market close each day, which tends to reduce artificial end-of-day price swings tied purely to fund rebalancing rather than genuine buying or selling interest. Financing conditions have also eased, with one-month equity financing spreads falling from a peak of 138 basis points over SOFR to around 60 basis points by mid-July.
Key Takeaway: The leverage-driven part of this rally has cooled somewhat even as plain retail buying has accelerated — worth separating the two forces when judging how sustainable current price action is.
Should I change my day trading strategy based on this data?
This is descriptive market structure data, not a trading signal on its own. It tells you how the crowd is currently positioned and why certain names are moving the way they are — it doesn't tell you which direction any individual stock goes next.
Key Takeaway: Use this as context for interpreting price action you're already watching, not as a standalone reason to enter or avoid any specific trade.
Disclaimer
Article Sources
- 1H 2026 Market Structure & Flows - Citadel Securities, June 30, 2026. The semiannual review; source for the headline retail volume, 0DTE, semiconductor options, and correlation data.citadelsecurities.com
- July - Citadel Securities, June 17, 2026. Source for the ETF inflow, buyback, and July seasonality data.citadelsecurities.com
- After the Reset: Time to Focus on Fundamentals - Citadel Securities, July 13, 2026. The most current note; source for the July-to-date retail buying pace, the semiconductor selling exception, and the Q2 earnings calendar data.citadelsecurities.com
- State of the Options Industry: Options Market Continued to Break Records in Q2 2026 - Cboe Global Markets, July 2026. Exchange-wide source for the 65% SPX 0DTE volume share and its link to the PDT rule's elimination.cboe.com