Warsh's First Fed Meeting Meets a Falling Oil Market: Weekly Market Insights— June 15–19, 2026

In this article9 sections
Oil just had its worst stretch in three months, and the timing could not be stranger.
Over the weekend, the U.S. and Iran reached a deal to end the war that started in late February — the same war whose energy shock pushed inflation back up to 4.2%. The Strait of Hormuz is set to reopen, the naval blockade is being lifted, and crude gapped down toward $80 Sunday evening, its lowest level since early March. Asian shares jumped about 3% overnight. Japan's Nikkei headed for a record close. U.S. equity futures opened the week up more than 1%.
A clean relief rally. Three days before the Federal Reserve meets.
And not just any meeting. Wednesday is Kevin Warsh's first FOMC as Fed Chair. The decision itself is close to a lock — markets are pricing a hold at the current 3.50%–3.75% range at roughly 98%. But the rate was never going to be the story. The story is that the inflation data Warsh and the committee are reacting to — May CPI at 4.2%, released last Wednesday — is the bill from a war that may have just ended. The market is already pricing the peace dividend in real time. The Fed is working off a number that's three weeks old and pointing the other way.
That gap — between a fast-moving disinflationary shock and the slow-moving official data the Fed actually responds to — is the whole week. If you only learn how to trade one kind of setup this year, learning how to trade a Fed day when the data is already stale is a good one to add to the list.
Here's the part that makes it interesting. With the S&P 500 sitting at 7,431, only about 2.5% below its all-time high, you'd expect sentiment to be euphoric. It isn't. CNN's Fear & Greed Index closed Friday at 34 — squarely in "fear." A market near record highs, with fearful participants, heading into a new Fed chair's first meeting, in a holiday-shortened week. That's an unusual combination, and it's worth understanding before the open.
Our view: the easy trade was Friday into Monday — long anything as oil fell and the deal firmed up. The hard part starts Wednesday at 2:00 PM, and most of the risk this week is concentrated in a single 30-minute window. Let's walk through where we are, what's actually on the calendar, and how we're thinking about a Fed day with a brand-new chair and a dot plot that might not even survive the meeting.
What Happened Last Week
Last week was a tug-of-war between fear and relief, and relief won by a nose.
The week opened ugly. Stocks sold off hard in the first two sessions as the administration signaled more strikes in Iran, and the Dow dropped roughly 900 points on Tuesday. Then the tone flipped. By midweek, reports that the U.S. and Iran had agreed on the text of a memorandum of understanding started circulating, oil began sliding, and Treasury yields cooled. By Friday's close, the S&P 500 had clawed back to 7,431.46 (+0.50% on the day), the Dow finished at 51,202.26 (+0.70%), the Nasdaq Composite closed at 25,888.84 (+0.31%), and the small-cap Russell 2000 led the majors at 2,943.99 (+0.79%).
Two things from last week matter more than the index prints.
First, the inflation data was hot. May CPI came in at 4.2% headline and 2.9% core. The Producer Price Index, out Thursday, rose 1.1% month-over-month and 6.5% year-over-year, with core PPI up 0.4% on the month. Those are the hottest readings since 2022, and they're the last major inflation prints the Fed sees before Wednesday's decision. The energy shock from the Iran war is written all over them.
Second, the SpaceX IPO landed Friday. Priced at $135, it opened at $150 and closed near $161 — up roughly 19% — at a valuation around $1.75 trillion, the largest IPO in history. We mention it not because it moves your tape on Monday, but because it tells you something about the split personality of this market: white-hot demand for a marquee IPO sitting right next to a Fear & Greed reading of 34. Froth in one corner, anxiety in another. We'll come back to what that split usually means.
Underneath all of it, breadth quietly improved. Both the S&P equal-weight index and the Russell 2000 hit fresh all-time highs last week, even as the cap-weighted Nasdaq was working off a roughly 7% drawdown. When the average stock is doing better than the headline index, that's usually a healthier tape than the nervous mood suggests.
The Current Market Regime
Regime: range-bound near the highs, sentiment fearful, with one binary event dead ahead.
Start with the indices. The S&P 500 closed Friday at 7,431.46. The 52-week high is 7,620.90, so we're about 2.5% off the top. The Nasdaq Composite at 25,888.84 is the laggard of the group, having just absorbed a roughly 7% pullback over about seven trading days that carried it right down to its 50-day moving average — where buyers stepped in more than once. The Russell 2000 at 2,943.99 and the S&P equal-weight both notched fresh records. So the "market" isn't one thing right now. Mega-cap tech consolidated; almost everything else firmed up.
Volatility says calm. The VIX closed Friday at 17.68, down about 9% on the day. Here's the thing about a 17-handle VIX two days before a Fed meeting: it tells you options traders aren't bracing for a shock from the decision itself, which makes sense given a hold is 98% priced. But a low VIX into a binary event also means there isn't much of a cushion if Warsh surprises on tone. Cheap protection and complacency look identical right up until they don't.
Now the part that's actually moving: commodities and rates. WTI crude finished Friday around $84.88 after sliding all week, then gapped down toward $80–81 Sunday evening on the deal — a three-month low. Brent fell toward $83. To keep perspective, even at $80, oil is still up more than 20% since the war started in late February and more than 40% since the start of the year. The relief is real, but the energy market is unwinding a spike, not collapsing into a glut. The 10-year Treasury yield sits around 4.48%. Gold firmed over the weekend toward the $4,240–4,325 area as the dollar softened, and Bitcoin pushed to its highest level in about two weeks. Risk-on, dollar-down, oil-down — a textbook geopolitical relief setup.
Then there's sentiment, and this is where we'd point your attention. CNN's Fear & Greed Index closed Friday at 34 — fear — with the index near its highs. That combination is unusual. Fear near the lows is normal; that's capitulation. Fear near the highs is a wall of worry, and walls of worry have a habit of being climbed. We're not going to pretend a single sentiment gauge is a crystal ball. But when you see fearful positioning into record-ish prices, the path of least resistance is often higher than the mood implies, because there's dry powder on the sidelines waiting for a reason. The Iran deal may have just handed it one.
What kind of regime is this, then? Our read: a range-bound, late-cycle tape that's quietly broadening, priced for calm, and sitting on a binary event. The energy unwind is a genuine tailwind for risk and a genuine disinflationary force over time. The offsetting risk is entirely Fed-shaped, and it's concentrated in Wednesday afternoon. If you want a framework for thinking about which setups work in a tape like this, our best trading strategies hub breaks down how range-bound versus trending conditions change the playbook.
The Week Ahead and What Actually Matters
This is a four-day week — U.S. markets are closed Friday, June 19, for Juneteenth — and the data calendar got squeezed accordingly. Almost everything that matters lands Wednesday. We're going to be honest about what moves the tape and what doesn't, because pretending every release matters is how newsletters waste your time.
Wednesday, June 17, 2:00 PM ET — FOMC decision, Summary of Economic Projections, and Warsh's first press conference (2:30 PM). This is the week. A hold at 3.50%–3.75% is roughly 98% priced, so the decision is not the catalyst — the projections and the tone are. Two specific things we're watching. First, the dot plot. June is a Summary of Economic Projections meeting, which normally means an updated chart of where each official expects rates to go. There's a live possibility Warsh reshapes or even scraps the dot plot as soon as this meeting. Second, the directional bias. Coming into 2026, the market expected more cuts. After the energy-driven inflation reacceleration, fed funds futures have flipped: a rate hike is now seen as the more likely year-end move than a cut, with the odds of a quarter-point hike by December running in the low-40s percent. If the median dot shows even one hike for 2026, that's a hawkish surprise relative to a market that's been told "higher for longer" but still half-hopes for relief.
Wednesday, June 17, 8:30 AM ET — May Retail Sales. This drops about five and a half hours before the Fed, and it's the last big read on the consumer the market digests before the decision. A hot number complicates the dovish case; a soft one gives the doves something to point to. Either way, the morning session Wednesday is the appetizer and the 2:00 PM print is the main course.
Monday and Tuesday — the regional and housing data. Monday brings the Empire State Manufacturing Index, Industrial Production, and the NAHB Housing Market Index. Tuesday brings Housing Starts and Building Permits, plus import/export prices and the start of the two-day FOMC meeting. None of these are tape-movers on their own this week. They're context. With a Fed meeting in progress, the bar for a regional survey to move the S&P is very high.
Thursday, June 18 — jobless claims (pulled forward a day because of the holiday) and the Philadelphia Fed Index. Claims rose to 229,000 in the most recent week, the highest since early February. Not alarming, but worth watching for any post-Fed read on whether the labor market is the thing that finally cracks.
On earnings, we'll be blunt: this is a light week, and earnings are not the story. The names worth a glance are Jabil (JBL), reporting Wednesday before the open, where consensus is around $3.10 in EPS on roughly $8.61 billion in revenue — a useful tell on AI data-center hardware demand — and Accenture (ACN) and Kroger (KR) on Thursday. If you were expecting FedEx, it reports next week (June 23), not this one. Double-check any earnings date against the company's own investor relations page before you hold a position into a print; dates move, and we've all been burned assuming otherwise.
One last calendar note that isn't on most economic calendars: the Iran MOU is slated to be signed Friday, June 19, in Switzerland, the same day U.S. markets are closed for Juneteenth, and the G7 summit runs June 15–17. Headline risk into a closed tape is its own kind of risk. If the signing slips or the deal wobbles over a long weekend — and there's already been friction, with fresh Israeli strikes in Lebanon complicating the diplomacy — you could gap into next Monday before you can do anything about it.
When the Fed's Data Is Already Stale: Trading the Lag Between an Oil Shock and the Dot Plot
Here's the puzzle at the center of this week, and we don't think anyone else is framing it this way.
The Fed sets policy by reacting to data. The data is, by definition, backward-looking. Most of the time that lag doesn't matter much, because the world changes slowly. But every so often a fast catalyst moves the real economy faster than the statistics can capture it — and the Fed gets caught reacting to a world that no longer exists.
That's exactly the setup Wednesday. The May CPI print of 4.2% is, in large part, an energy story. The Iran war shut down or threatened the Strait of Hormuz — a waterway through which something like a fifth of the world's oil moved before the conflict — and crude spiked. That spike fed into gasoline, into shipping, into the prices of a thousand things, and it showed up in the official inflation data with the usual delay. Now the war is ending. Oil is at a three-month low. The single biggest driver of the inflation scare is unwinding in real time, in front of our eyes, on the tape.
But the Fed doesn't get to react to Sunday's oil price. It reacts to May's CPI. And the dot plot the committee publishes Wednesday will be built, at least partly, on inflation forecasts that were locked in before the weekend deal. So you can get a genuinely hawkish-looking projection landing in a week where the underlying inflation impulse has already started to fade. The map and the territory diverge.
We've seen a version of this movie before. Go back to the Gulf War in 1990–91. Iraq invaded Kuwait, oil roughly doubled over a few months on supply fears, and inflation anxiety ran hot. Then, once the conflict's outcome became clear in January 1991, oil collapsed almost overnight — a single session erased a huge chunk of the spike — and the inflation scare evaporated far faster than the lagging data had implied. Traders who anchored to the scary headline number got run over by the speed of the reversal. The pattern repeats because the cause is structural: geopolitical oil shocks spike fast and resolve fast, but the data that measures their inflation impact moves slow.
So how do you actually trade the gap? A few things we keep in mind, none of which are instructions about what you should do with your money — just how we frame it on our own desk.
Separate the two clocks. There's the fast clock (oil, the deal, futures, the relief rally) and the slow clock (CPI, the dot plot, the Fed's forecast). When they're pointing in opposite directions, the market usually trades the fast clock first and the slow clock second. The danger is getting whipsawed when the slow clock briefly grabs the wheel — like a hawkish dot plot at 2:00 PM Wednesday — even though the fast clock is the better read on where things are actually heading.
Respect the knee-jerk, fade the knee-jerk's certainty. The first move after a Fed statement is often the wrong one, or at least the incomplete one. Algorithms parse the statement in milliseconds and react to keyword changes before any human has read a full sentence. The presser, starting at 2:30, frequently reverses or complicates the 2:00 reaction. We're not saying fade the open; we're saying the 2:00–2:45 window is where overconfidence gets punished.
Know what's already priced. A hike being more likely than a cut for year-end is not a secret — it's in the futures. So a hawkish dot plot isn't automatically a hawkish surprise. The surprise would be Warsh going out of his way to sound more hawkish than a market that's already braced for higher-for-longer, or conversely, leaning on the oil relief to open a door the market has closed. Surprise is measured against expectations, not against zero.
If you want the deeper mechanics of how positioning and expectations interact around scheduled events, we go further in our strategies hub. The short version for this week: the oil unwind is the signal, the May data is the noise, and the Fed is going to spend Wednesday afternoon talking about the noise. Plan accordingly.
Key Levels on the Indices
We'll keep this to observation and if/then scenarios — never a directive. Levels are where decisions get made, not where outcomes are guaranteed.
S&P 500 (SPX) — 7,431.46
- Resistance: 7,456 (Friday's intraday high), then the 7,620.90 record. A push through Friday's high on the gap-up open keeps the all-time high in play.
- Support: roughly 7,247 at the 50-day moving average, then around 7,118, which marks the first Fibonacci retracement of the March-through-June rally. Below that, the round 7,000 level — prior horizontal resistance that becomes the line in the sand for the broader uptrend.
- 52-week context: range of 5,943.23 to 7,620.90. We're in the top quarter of the year's range.
Nasdaq Composite — 25,888.84
- This is the index that did the most repair work last week, bouncing off its 50-day moving average after a ~7% drawdown. Our read: as long as it holds that 50-day on any pullback, the dip-buying reflex stays intact. Lose it decisively and the "is the AI trade tired?" conversation gets loud again.
Russell 2000 — 2,943.99
- Small caps printed a fresh all-time high last week and are arguably the cleanest chart of the majors right now. Small caps are rate-sensitive, so the Russell's reaction to the dot plot Wednesday will tell you a lot about how the market is reading the Fed's path. If small caps shrug off a hawkish dot, that's a tell that the oil relief is winning.
VIX — 17.68
- A 17-handle into a Fed meeting is calm. We're watching whether it stays under 20 through Wednesday. A VIX that's already elevated going into a Fed day behaves very differently from one starting low — low-and-rising tends to amplify the post-statement swing.
If SPX holds 7,247 on any pullback this week, the consolidation-near-the-highs read stays intact and dips likely get bought. A clean break of 7,118 would shift the conversation back toward "how deep does this pullback go," and 7,000 is where the bigger uptrend would actually be in question. Frame your own plan around those lines rather than around the headlines; the levels don't care what Warsh says.
The Teaching Moment: Why the Dot Plot Exists (and What a Fed Day Without One Looks Like)
There's a real chance the most important chart in macro disappears this week, so let's make sure you understand what it is before it potentially goes away.
The dot plot — formally the Summary of Economic Projections — is a chart the Fed publishes four times a year. Each dot represents one FOMC official's anonymous forecast for where the federal funds rate should be at the end of the current year and the next couple of years. The "median dot," the middle forecast, is the one everyone fixates on, because it's read as the committee's collective best guess about its own future. When the median dot moves up between meetings, that's a tightening signal. When it moves down, that's easing.
Think of it like a weather forecast issued by the people who control the weather. It's not a promise — officials stress that constantly — but it's the closest thing markets get to forward guidance in chart form, and traders treat it as gospel for about 48 hours after each release.
Here's how traders typically get it wrong. They read the dot plot as a commitment rather than a snapshot of opinion on a single day, built on assumptions that go stale the moment new data arrives. The classic mistake is anchoring hard to a hawkish or dovish dot and then refusing to update when the world changes. This week is the perfect example: a dot plot built on pre-weekend inflation forecasts could look hawkish even as the oil shock behind that inflation is actively reversing. Trading the dot as if it's the final word, rather than one input that's already partly outdated, is how people end up offside.
The correct application is to treat the dot plot as a distribution of opinion, not a verdict. What's the spread between the dots? Is the committee tightly clustered or wildly split? A divided committee — and this one has been described as deeply divided — produces a median that can swing on one or two members changing their minds, which makes it less reliable as guidance. You're reading consensus and its fragility at the same time.
Now, what happens if Warsh actually scraps it? A Fed day without a dot plot is a Fed day where the statement language and the press conference carry all the weight. The market loses its favorite cheat sheet and has to parse tone in real time. Practically, that tends to mean a choppier, more headline-driven reaction — more weight on individual phrases in the statement, more volatility around specific questions in the 2:30 presser, and a longer time for the market to "settle" on an interpretation. If you've built your Fed-day routine around waiting for the dots, and the dots don't come, you need a different routine. New traders especially should understand that a Fed day is one of the few scheduled events that can turn a calm tape violent in seconds — we cover how to size and prepare for high-volatility events in our day trading for beginners guide.
The meta-lesson here is bigger than this one meeting. Markets build crutches — favorite indicators, reliable patterns, trusted forecasts — and then a regime change kicks the crutch away. The traders who adapt are the ones who understood why the crutch worked in the first place, not just that it worked. Knowing why the dot plot matters is exactly what lets you trade the week it might vanish.
The Mindset Note
This is a week to do less, not more.
When the calendar bunches all the risk into one 30-minute window on Wednesday afternoon, the temptation is to position big for the event — to "have a view" on what Warsh will say and bet it. We get the pull. A new Fed chair's first meeting feels momentous, and momentous feels like it deserves a big swing.
But here's the uncomfortable truth about event trades: you are not being paid for your macro opinion. You are being paid for your execution and your risk control. The smartest desks we know don't try to predict the Fed. They prepare for multiple outcomes, keep their size modest into the print, and let the reaction tell them what's real. Predicting the binary is a coin flip with extra steps. Reacting to the binary, with a plan for each branch, is a skill.
If you came into this week with a good month, that's exactly when the danger is highest — confidence is a position-sizing drug. Don't let a strong stretch talk you into treating Wednesday like a sure thing. Keep your size the same as any other week. If anything, going into a Fed day with a new chair and a possibly-vanishing dot plot, a little smaller is the honest move.
The discipline that gets people through weeks like this is mostly psychological, not technical. If you find yourself itching to size up because "this one's obvious," that's the signal to step back. Our trading psychology hub has more on managing the urge to over-trade around big events. The one behavioral note for this week: decide your maximum risk for Wednesday before Wednesday, and write it down where you can see it at 1:59 PM.
Your Week Ahead Checklist
A few preparation items — all about getting ready, none about what to buy or sell:
- Know your maximum daily loss number before Monday's open, and a separate, smaller number for Wednesday specifically.
- Mark the SPX levels that matter on your own chart: 7,456, 7,247, 7,118, 7,000. Decide what you'll do if each breaks, before it breaks.
- Block your calendar for 8:30 AM Wednesday (Retail Sales) and 2:00 PM Wednesday (FOMC). Decide now whether you're trading the 2:00 reaction or staying flat through it.
- If you hold anything overnight into Wednesday, know your exposure to a sharp post-Fed move in either direction.
- Pre-commit to skipping the first few minutes after the 2:00 PM statement. The knee-jerk is the least reliable move of the day.
- Watch how small caps (Russell 2000) and oil react to the dot plot — those two tell you whether the market is trading the fast clock or the slow clock.
- Have a scanner ready so you can see which sectors are actually moving once the statement drops, rather than guessing — Trade Ideas is the one we lean on for fast post-event sector reads.
- Remember Friday is closed for Juneteenth. Plan your Thursday so you're not stuck holding something you can't manage over a three-day weekend with the Iran signing pending.
- Keep the rest of the free tools we use bookmarked in the Day Trading Toolkit so you're not assembling your workflow at 1:55 PM Wednesday.
Frequently Asked Questions
Will the Fed raise or cut rates at the June 2026 meeting?
The June 16–17 meeting is widely expected to leave rates unchanged. What's genuinely up for debate is the forward guidance: the Summary of Economic Projections (the dot plot) and Chair Warsh's tone. After the energy-driven inflation reacceleration, fed funds futures now see a rate hike as the more likely year-end move than a cut, which is a notable shift from where the market started 2026.
Key Takeaway: Don't trade the decision — trade the projections and the press conference, where the actual new information lives.
Why does it matter that this is Kevin Warsh's first FOMC meeting?
Warsh was sworn in on May 22, 2026, and inherited a committee described as deeply divided. The chair holds just one vote like everyone else, but they shape the agenda and speak for the group. His first press conference is where traders will look for early signals about how he plans to communicate — and whether he intends to lean hawkish, as his track record suggests.
Key Takeaway: The decision is continuity; the tone is the wild card. First meetings under new chairs have historically been watched closely for exactly this reason.
What is the dot plot and why might it disappear?
Each dot is one policymaker's anonymous rate forecast, and the median dot is read as the committee's collective expectation. It's the closest thing the market has to forward guidance in visual form. If it's scrapped, Fed days become more dependent on the statement's exact wording and the press conference, which tends to make the reaction choppier.
Key Takeaway: Understand the dot plot as a snapshot of opinion, not a promise — and have a plan for a Fed day that doesn't include one.
How does the U.S.-Iran deal affect inflation and the Fed?
The war drove an energy shock that pushed inflation to 4.2%. With a deal reached and the Strait of Hormuz reopening, oil fell to a three-month low. That's a real tailwind for cooling inflation in the months ahead. But the Fed's Wednesday projections lean on data and forecasts locked in before the weekend, so there's a timing gap between the relief and the official numbers.
Key Takeaway: The oil unwind is the better read on where inflation is heading; the May data is where the Fed is still looking.
Why is market sentiment fearful if stocks are near record highs?
CNN's Fear & Greed Index read 34 (fear) on Friday even with the S&P about 2.5% from its record. Fearful positioning into strong prices usually means participants are under-invested and skeptical, which is a different — and frequently more bullish — setup than the euphoria you see at genuine tops.
Key Takeaway: Sentiment is a context tool, not a timing tool; fear near the highs tells you the rally hasn't been fully embraced yet. For more on reading sentiment alongside other signals, see our ongoing coverage in the Market Insights hub.
Should I trade through the FOMC announcement or stay flat?
Fed announcements produce some of the fastest, least predictable moves of any scheduled event. Many experienced traders either stay flat through the initial reaction or trade only after the dust settles, because the knee-jerk move is so often reversed during the press conference. The right choice depends on your strategy, experience, and risk tolerance.
Key Takeaway: Decide before Wednesday, size honestly, and never let "this one's obvious" talk you out of your own rules.
Disclaimer
The information provided in this article is for educational purposes only and should not be considered financial advice. Day trading involves substantial risk and is not suitable for every investor. Past performance is not indicative of future results. Market conditions can change rapidly, and what worked in historical analogs may not work going forward.
For our complete disclaimer, please visit: https://daytradingtoolkit.com/disclaimer
Article Sources
- Yahoo Finance — S&P 500 (^GSPC) - Friday closing levels and 52-week ranges for the major U.S. indices and the VIX.
- Cboe Global Markets — VIX - official volatility index reference for the week's VIX reading.
- Bloomberg — Markets Wrap, June 14, 2026 - overnight global rally, oil's three-month low, and futures levels following the Iran deal.
- NBC News — U.S.-Iran agreement to reopen the Strait of Hormuz - details of the weekend peace deal, oil's reaction, and the memorandum of understanding.
- Encyclopaedia Britannica — 2026 Iran War - timeline of the conflict, ceasefire, and the June 19 signing schedule.
- Kraken Economic Brief — CPI, FOMC, and the SpaceX IPO - FOMC date and expectations, the hike-versus-cut repricing, and the dot plot question.
- Kiplinger — Economic Calendar for the Week of June 15 - retail sales, jobless claims timing, and the Juneteenth market closure.
- Charles Schwab — Weekly Trader's Outlook - technical levels on the S&P 500, the Nasdaq drawdown, and the week's data schedule.
- Kiplinger — Earnings Calendar for the Week of June 15-19 - earnings dates and consensus estimates for Jabil, Accenture, and Kroger.
- CNN Business — Fear & Greed Index - market sentiment reading heading into the week.
Was this helpful?
Be the first to weigh in

Written by
Kazi Mezanur RahmanFounder, independent researcher, and editor of DayTradingToolkit, a one-person publication focused on risk-first trading education, documented tool research, and clear explanations.
Keep Reading
Market Analysis & Insights
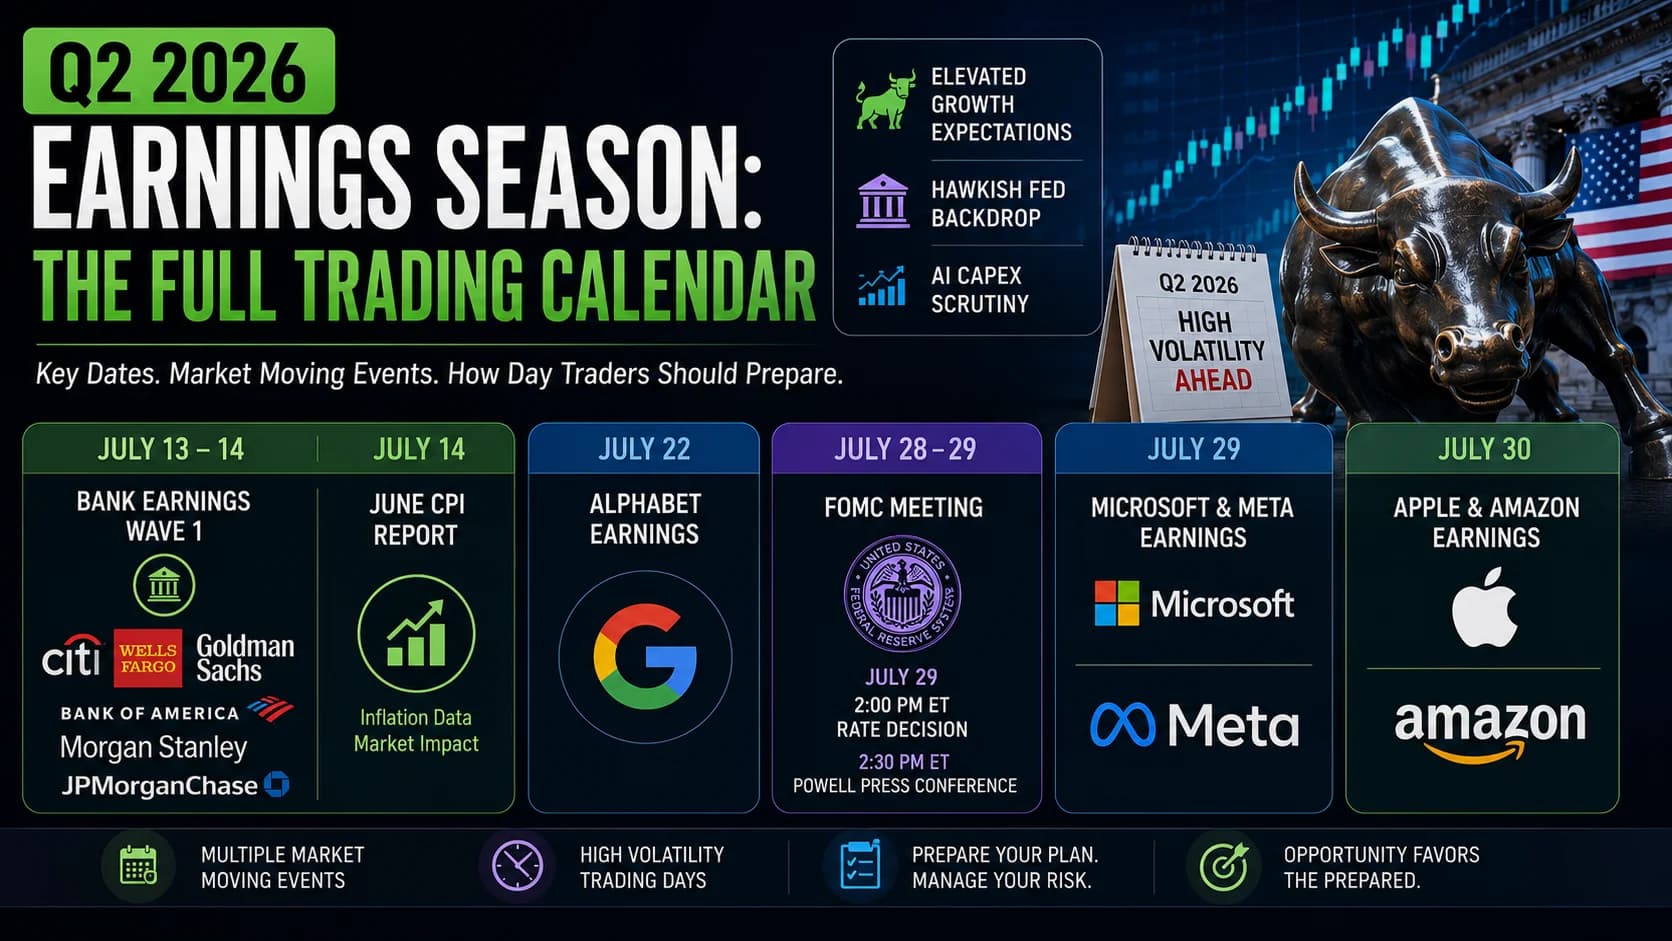
Q2 2026 Earnings Season: The Full Trading Calendar
Q2 2026 earnings season collides with a hawkish Fed and heavy AI capex scrutiny. Full date-by-date calendar for July's key days and how day traders should prepare.

Market Analysis & Insights
Weekly Market Insights: Week of July 6–10, 2026
The Dow hit a record while semis and AI-cloud names cracked. Is the AI-trade revaluation a rotation, a top, or a buyable dip? Plus FOMC minutes and the week.

Market Analysis & Insights
Weekly Market Insights July 20–24, 2026: Can Big Tech Earnings Repair the AI Trade—or Will Oil Keep Control?
Prepare for Alphabet, Tesla, Intel, the ECB, flash PMI, and oil-driven volatility with a focused July 20–24 market map, watchlist, scenarios, and risks.
Market Analysis & Insights
Weekly Market Insights: Week of June 29 – July 3, 2026
June's jobs report lands Thursday before a closed Friday, and under a hawkish Warsh Fed a strong print could pressure stocks. Plus Nike, Micron and more.
Comments
No comments yet. Be the first to share your thoughts.