
Weekly Market Insights: Week of June 29 – July 3, 2026

The first half of 2026 ends with the strangest setup of the year: the major indices sit within range of records, yet the fear gauge reads outright fear, and market leadership has quietly flipped from the Magnificent Seven to small caps and the Dow. The S&P 500 closed Friday at 7,354, pinned to its 50-day moving average near 7,356 — a line it has defended since early April but has threatened for three straight sessions. Underneath the calm index level, money is rotating hard: semiconductors fell more than 7% on the week while the small-cap Russell 2000 held near its highs. And the whole thing funnels into one mispriced event. Because Friday, July 3 is closed for Independence Day, the June jobs report has been pulled forward to Thursday at 8:30 AM ET — a top-tier catalyst dropped into thin pre-holiday liquidity, under a new Fed chair who has made it clear he is worried about inflation, not growth. That combination is why a strong jobs number could be the week's biggest risk, not its relief. Here's the full map.
The Week at a Glance
Times are Eastern. Bolded rows are the genuine market-movers. Everything else is context, and we'll tell you what to skip.
| Day | Time (ET) | Event | Why It Matters |
|---|---|---|---|
| Monday, Jun 29 | — | No major U.S. data | A quiet positioning day before a front-loaded week. Watch overnight oil after any weekend Iran headlines |
| Tuesday, Jun 30 | 10:00 AM | Consumer Confidence (June) + JOLTS Job Openings (May) | Two labor and consumer reads that set the table for Thursday's payrolls |
| Tuesday, Jun 30 | AMC | Nike (NKE) and Constellation Brands (STZ) earnings | A beaten-down consumer bellwether and a beer-and-spirits read on the consumer, back to back |
| Wednesday, Jul 1 | 8:15 AM | ADP Employment (June) | Private-payrolls warm-up for Thursday. Often a poor predictor of NFP, but it moves the tape |
| Wednesday, Jul 1 | 9:30 AM | Fed Chair Warsh speaks (Portugal) | His second appearance since the hawkish debut. Any inflation emphasis loads the spring under Thursday's jobs print |
| Wednesday, Jul 1 | 10:00 AM | ISM Manufacturing PMI (June) + Construction Spending | Activity check; ISM prices-paid is the inflation wrinkle to watch |
| Thursday, Jul 2 | 8:30 AM | June Nonfarm Payrolls, Unemployment, Average Hourly Earnings | The week. Released a day early. Consensus near +172K jobs, ~4.3% unemployment. Wage growth is the line that matters most |
| Thursday, Jul 2 | 2:00 PM | Bond market early close | Treasuries shut at 2:00 PM ET. Equities trade a full session, but liquidity thins through the afternoon |
| Friday, Jul 3 | Closed | U.S. STOCK AND BOND MARKETS CLOSED | Independence Day observed. No session to digest Thursday's jobs number — any surprise sits over a 3-day weekend |
Bottom line on the calendar: the week is back-loaded and compressed. Monday is quiet, Tuesday and Wednesday are warm-ups, and then everything resolves into Thursday's 8:30 AM payrolls print before the market goes dark for a long weekend. If you circle one moment, circle Thursday at 8:30. Our read: the structure of this week matters as much as the data, and we break down why in the deep dive. For the mechanics of how the jobs report tends to trade, our NFP playbook walks through the session minute by minute.
Earnings This Week
A lighter earnings week than last, but two consumer names genuinely move the tape, and both report Tuesday night.
| Company | Ticker | Date | When | Est. EPS | Est. Revenue | Implied Move |
|---|---|---|---|---|---|---|
| Nike | NKE | Tue, Jun 30 | After Close | ~$0.12 | ~$10.85B | ±8.5% |
| Constellation Brands | STZ | Tue, Jun 30 | After Close | ~$3.28 | — | — |
| General Mills | GIS | Wed, Jul 1 | Before Open | — | — | — |
Consensus figures from broker estimates and company guidance; Nike's implied move is from options pricing as of late last week. Implied moves drift daily — re-check before each print. Constellation's revenue and implied move, and General Mills' figures, are left blank rather than guessed. Note: Micron (MU) already reported last Wednesday, June 24, and now trades on its post-earnings read, covered below.
Stocks to Watch This Week
Six names with a real catalyst this week. Framing is observation only — what's on our radar and why, never a recommendation. No price levels, because this publishes Monday and we don't know Thursday's prices.
NKE — Nike
📅 Catalyst: Earnings Tuesday after the close. Options are pricing roughly a ±8.5% move, below Nike's four-quarter average post-earnings move of about 12%.
🔍 Why it's on the radar: Nike enters the print down roughly 35% year-to-date, with a wave of analyst caution into the report — multiple price-target cuts and at least one downgrade in the days before earnings. The story isn't growth anymore; one Street note framed this quarter as less about expansion and more about "finding a floor." There's also a CFO transition in motion. That's the setup: a deeply out-of-favor name where expectations have already been gutted.
📊 What the options market is pricing: ±8.5% on the reaction. Consensus sits near $0.12 EPS on roughly $10.85B revenue, with analysts broadly modeling a low-single-digit revenue decline.
👁️ What to watch: Gross-margin guidance and any color on the China business and the turnaround timeline. With sentiment this washed out, how management frames the path forward tends to matter more than the backward-looking quarter.
🌐 Broader tape read: Nike is a consumer bellwether. Its reaction, alongside Tuesday's Consumer Confidence and JOLTS data, feeds the running debate about whether the consumer is holding up as the labor market cools.
STZ — Constellation Brands
📅 Catalyst: Earnings Tuesday after the close. The Corona and Modelo importer reports fiscal Q1.
🔍 Why it's on the radar: Constellation has lagged the market over the past year on worries about slowing beer growth and margin pressure from packaging and input costs. As the dominant U.S. importer of Mexican beer, it also sits at the intersection of consumer demand and the trade-and-tariff conversation.
📊 What the options market is pricing: Consensus is near $3.28 EPS. We're not citing an implied move we couldn't verify cleanly — check current options pricing before the print.
👁️ What to watch: Beer depletion trends and any commentary on pricing and the U.S. Hispanic consumer, which is core to the franchise.
🌐 Broader tape read: A second, independent consumer read the same night as Nike. Two consumer-facing prints into a jobs week give a real-time gut check on demand.
MU — Micron Technology
📅 Catalyst: No earnings this week. Micron reported a blowout last Wednesday and now trades on the read-through.
🔍 Why it's on the radar: The numbers were staggering — revenue of roughly $41.5 billion against estimates near $35.8 billion, with the company guiding the current quarter toward roughly $50 billion. Memory is in a genuine super-cycle, and it's the same force pushing Apple and Microsoft to raise hardware prices. Yet the stock gave back nearly 7% Friday after running on the print. That give-back is the tell.
👁️ What to watch: Whether Micron stabilizes and holds its post-earnings range, or keeps bleeding alongside the broader semiconductor unwind. A blowout that can't hold its gains is information about how much good news is already in the group.
🌐 Broader tape read: Micron is the bellwether for the entire AI-memory complex. How it digests its own blowout tells you whether the semiconductor selling is profit-taking or the start of something heavier.
NVDA — Nvidia
📅 Catalyst: No earnings. It's the anchor read on the whole AI trade as the capital-spending debate intensifies.
🔍 Why it's on the radar: The week's defining storyline isn't a single stock — it's the question of whether the hyperscalers' enormous AI capital expenditure is going to keep compounding. A reported delay in OpenAI's IPO and price hikes tied to memory costs put that question front and center. Nvidia is where the market votes on it.
👁️ What to watch: Whether Nvidia and the broader semis find a floor after a brutal week, or whether any fresh capex-doubt headline opens another leg lower.
🌐 Broader tape read: Nvidia is the single best gauge of whether the AI trade is still being bought on dips or is starting to wobble. As it goes, so goes the Nasdaq 100's relationship to the rest of the market.
ORCL — Oracle
📅 Catalyst: Fresh news driver. Reports that OpenAI may push its IPO into next year pressured AI-infrastructure names late last week.
🔍 Why it's on the radar: Oracle has been a primary beneficiary of the AI build-out narrative, which makes it sensitive to any sign that infrastructure spending plans are slipping. When the market starts questioning the timeline, the most narrative-dependent names move first.
👁️ What to watch: Whether the IPO-delay overhang fades or whether more headlines question the durability of AI infrastructure demand.
🌐 Broader tape read: Oracle is a clean proxy for "is the AI capex story intact?" — the exact question driving the rotation out of Big Tech.
IWM — iShares Russell 2000 ETF
📅 Catalyst: The jobs report Thursday. Small caps are the most rate-sensitive corner of the market and the vehicle for the rotation that defined the back half of June.
🔍 Why it's on the radar: Small caps led the half, outperforming the Nasdaq 100 year-to-date as money rotated out of mega-cap tech. That makes IWM the cleanest expression of the week's central tension — and the most exposed to how the bond market reads Thursday's payrolls.
👁️ What to watch: How IWM trades in the minutes after the 8:30 jobs print. Small caps tend to give the fastest, most honest read on whether the market is pricing more Fed pressure or less.
🌐 Broader tape read: If small caps hold up through a firm jobs number, the rotation is real and orderly. If they crack on a hot print, the "higher-for-longer" fear is back in control.

Sectors to Watch This Week
| Sector | ETF | Direction | Catalyst This Week | What to Watch |
|---|---|---|---|---|
| Semiconductors / Memory | SMH / SOXX | In play | AI-capex doubt; Micron's post-blowout read | Whether the group finds a floor after falling 7%+ last week, or keeps unwinding |
| Small Caps | IWM | In play | Jobs report Thursday; the rotation trade | The reaction to payrolls is a real-time vote on the Fed path |
| Energy | XLE / USO | Two-sided | Fragile Iran ceasefire; oil near recent lows | A weekend escalation could reprice crude fast; a calm tape keeps the war premium draining |
| Biotech / Healthcare | XBI / XLV | Strengthening | Emerging leadership; Eli Lilly jumped ~7% Friday on an EU approval | Whether the defensive-growth bid in healthcare keeps absorbing money leaving tech |
| Consumer | XLY / XLP | Watching | Nike + Constellation earnings; Consumer Confidence + JOLTS | A three-part read on whether the consumer is still spending as the labor market cools |
Market Snapshot
Last full session was Friday, June 26.
| Indicator | Level (Fri Jun 26 close) | Context |
|---|---|---|
| S&P 500 | 7,354.02 (−0.05% Fri) | Pinned to its 50-day MA (~7,356); down ~3% in June |
| Nasdaq Composite | 25,297.62 (−0.24% Fri) | Nasdaq 100 fell ~1.1% Friday on the tech unwind |
| Dow | 51,876.11 (−0.09% Fri) | Near a record; up a third straight week as money rotated in |
| Russell 2000 | 3,010.08 (+0.07% Fri) | Outperformed the Nasdaq 100 year-to-date — the rotation in one number |
| VIX | 18.41 (−2.5% Fri) | Mild compression, but a thin cushion into a binary jobs print |
| 30-Year Treasury | ~4.86% | Long end stays elevated; the 2-year remains the Fed-path decoder |
| WTI Crude | ~$69–70 | Near recent lows despite a Strait-of-Hormuz incident; tankers kept flowing |
| Gold | ~$4,100 | Firmed Friday on a softer inflation read |
| CNN Fear & Greed | 25 (Fear) | Sentiment in fear even as the indices sit near highs |
Regime: record-adjacent indices, fearful sentiment, and a market being pulled in two directions under the surface. The S&P sits near records, but the Fear & Greed Index reads 25 — fear — because the gauge is dragged down by the mega-cap unwind even as the Dow and small caps hold firm. That split is the story. The most important shift of the past two weeks is that leadership left Big Tech: the Russell 2000 outran the Nasdaq 100 year-to-date, semiconductors fell more than 7% on the week, and money rotated toward small caps, financials, industrials, and healthcare. Our read: this is a market quietly changing its leadership while the headline index masks it — and the catalyst that decides whether the rotation continues or snaps back arrives Thursday morning. For a framework on reading which regime you're actually trading, our guide on how to identify the market regime is the place to start.
The Big Question: Why a Strong Jobs Report Could Sink Stocks
Let's start by owning last week. We argued the chart that mattered most was the 2-year Treasury yield, and that the May PCE print would set the tone. PCE did come in softer than the hot consensus, which was the right side of the call. But the week's real swing factor wasn't the rate path at all — it was the rotation out of Big Tech, driven by a reported OpenAI IPO delay and memory-cost-driven price hikes at Apple and Microsoft. The market told us the story is the rotation. So this week, we follow the rotation to its referee.
That referee is Thursday's jobs report, and here's why it's a trap rather than a relief valve.
In a normal cycle, a strong jobs number is good news. More jobs, more spending, more earnings — stocks rally. But the market's reaction function has flipped, and it flipped the moment Kevin Warsh's Fed raised its dot plot in mid-June with core inflation still running near 3.4% year-over-year, the hottest since late 2023. When a hawkish Fed is openly worried about inflation and roughly half the committee is penciling in a hike, the logic inverts: a hot economy means more inflation pressure, which means a higher chance of tighter policy, which is a headwind for stocks — especially the long-duration mega-cap tech names that are most sensitive to interest rates. That's the "good news is bad news" regime, and we think it's firmly in place right now.
So a genuinely strong payrolls print — say, well above the ~172,000 consensus, with hot average hourly earnings — wouldn't be a green light. It would most likely push rate-hike fears higher, pressure the same Magnificent Seven names that have been distributing for two weeks, and accelerate the rotation into small caps, value, and defensives. The wage number inside the report matters more than the headline jobs count, because wages are what the Fed watches for inflation persistence.
Now layer on the structure, because this is the part most coverage will ignore. The report lands Thursday, a day early, into a market that closes Friday for the holiday. Liquidity thins through Thursday afternoon as desks empty out ahead of the long weekend, and the bond market shuts at 2:00 PM. That means any surprise has to be absorbed in a single, increasingly illiquid session — and then it sits, unhedged and undigested, over a three-day weekend before the market reopens Monday, July 6. Thin liquidity plus a binary catalyst plus no next-day session is a recipe for an outsized move and gap risk. The way a holiday-shortened week trades is its own skill set, and our playbook for trading into a 3-day weekend covers how the tape behaves when the calendar compresses.
So here's how we're framing the branches, as observation and not prediction:
If payrolls run hot (well above consensus, firm wages): expect the 2-year yield to push up, hike fears to strengthen, and the heaviest pressure to land on long-duration tech. The rotation into small caps and value likely accelerates — though if the print is hot enough to revive "higher-for-longer" rate fears across the board, even small caps can eventually get caught, since they carry more floating-rate debt. A hot number is not automatically good for the rotation; past a certain point it's bad for everyone.
If payrolls come in near consensus: the most likely outcome is a low-conviction, low-liquidity drift into the long weekend. Quiet, but the kind of quiet where a single large order can move a thin tape further than it should.
If payrolls come in soft (clear miss, cooler wages): mega-cap tech could catch a relief bid as hike fears ease and duration gets bought — but a weak labor read also revives the growth-slowdown worry, which can bleed into cyclicals and small caps. There's no clean "good number" this week. Both tails carry a sting.
What we're watching for the real verdict is the 2-year yield and IWM in the first few minutes after 8:30. In a no-easy-answer setup like this, the fast-reacting instruments tell you which fear the market is pricing before the headlines catch up. If you want to understand how a Fed in this posture changes the way every data point trades, our FOMC and Fed-announcement playbook lays out the mechanics, and our piece on the sector rotation strategy covers how to track leadership as it moves. As leadership rotates week to week, the names in play change fast — a real-time scanner like Trade Ideas earns its keep when the leadership board is being reshuffled and yesterday's movers are no longer today's.
The Teaching Moment: When Two Sentiment Gauges Disagree
This week hands us a perfect lesson, because two of the most-cited sentiment readings are flatly contradicting each other. The CNN Fear & Greed Index sits at 25 — fear. The AAII investor survey, released last week, showed bullishness jumping more than eight points to nearly 45%, above its long-run average for the first time in six weeks — optimism. So which is it: are investors fearful or greedy?
The answer is that they're measuring two different things, and learning the difference makes you better at reading sentiment for the rest of your career.
The Fear & Greed Index is built from market data — price momentum, breadth, the put-call ratio, volatility, safe-haven demand, junk-bond spreads. It reads the behavior of the cap-weighted market in real time. And right now that market is being dragged down by the Magnificent Seven unwind. When the biggest, most-weighted stocks are selling off, the breadth and momentum components sag even though the average stock is fine — so the gauge prints "fear." It's reflecting the mega-caps more than the median stock.
AAII is the opposite kind of measure. It's a forward-looking opinion survey — it simply asks individual investors where they think the market goes over the next six months. Those investors are looking at the Dow near records, small caps leading, and a broadening rally, and they feel optimistic. The survey captures sentiment about the broad market and the rotation; the Fear & Greed Index captures the price action of the cap-weighted index. Same market, two honest answers.
The skill is reading them as a pair, not in isolation. When a price-based gauge and a survey diverge like this, the divergence itself is the signal: it's telling you the headline index and the median stock are telling different stories — exactly the split we described in the snapshot. Neither reading is "wrong." Each is a different lens on the same tape. For the deeper psychology of how fear and greed actually drive your decisions at the screen, our guide on managing fear and greed in trading goes further than any single index can.
Mindset for the Week
The trap this week is sizing up into a coin flip you can't see the result of for four days.
A jobs report is binary and unknowable in advance. Drop it into a Thursday session that thins out into a long weekend, with no Friday to react and the market dark until July 6, and you have the textbook setup for handing your account to a single number you don't control. The temptation cuts both ways: some traders feel the urge to oversize a directional bet ahead of the print; others, bored by a slow Monday and Tuesday, force marginal trades in dead, pre-holiday chop just to feel active. Both are how a green June becomes a red start to July.
The action item: decide before Thursday whether you're trading the payrolls reaction or sitting it out, and write the number down. If you trade it, size for thin liquidity, not normal conditions — spreads widen and fills get worse as the session empties out. And set a smaller daily max-loss for the half-of-a-week that this really is. Sometimes the best trade is the one you don't take, and our piece on when to sit out makes the case better than a slow holiday tape will.
Your Week Ahead Checklist
- Circle Thursday 8:30 AM ET — June payrolls — as the single key risk window for the week
- Note the closure: Friday, July 3 is fully closed; there is no session to digest Thursday's print before the long weekend
- Watch the wage number in the jobs report, not just the headline jobs count — it's what the Fed cares about
- Mark Tuesday's two earnings prints: Nike and Constellation, both after the close
- Add the 2-year Treasury yield and IWM to your screen as the fastest reads on Thursday's reaction
- Decide now whether you're trading the payrolls reaction or sitting flat through it — don't decide at 8:29
- Keep crude on the radar both ways: the Iran ceasefire is fragile and a weekend headline could gap oil
- Run a clean pre-market routine Tuesday through Thursday and set a smaller max-loss for this compressed week
Frequently Asked Questions
Why is the jobs report on Thursday this week instead of Friday?
The monthly payrolls report normally lands on the first Friday of the month, but the BLS shifts it earlier when that Friday is a market holiday. With July 4 falling on a Saturday in 2026, the holiday is observed Friday, July 3, so the report comes Thursday instead. For a primer on how releases like this move markets, our guide on economic reports for day traders covers CPI, NFP, and FOMC together.
Key Takeaway: The jobs report arrives a day early, landing into a shortened, lower-liquidity week.
Is the U.S. stock market open on July 3, 2026?
Because July 4 falls on a Saturday, the holiday is observed the preceding Friday, so there is no regular equity session that day. The bond market also closes early, at 2:00 PM ET, on Thursday, July 2. There is no stock-market early close on Thursday — equities trade a full session — but liquidity tends to thin out into the afternoon ahead of the long weekend.
Key Takeaway: Plan around a four-day trading week, with Thursday's jobs print as the last major event before markets go dark.
Why would a strong jobs report be bad for stocks right now?
This is the "good news is bad news" dynamic. With core inflation still running near 3.4% and roughly half the Fed projecting a hike, a hot labor market signals more inflation pressure, not just healthy growth. That can push bond yields and rate-hike fears higher and accelerate the rotation out of Big Tech that has defined recent weeks.
Key Takeaway: In the current regime, the wage number inside the report can matter more than the headline jobs count.
What are the most important events for traders this week?
The week is back-loaded: a quiet Monday and warm-up data Tuesday and Wednesday build toward the payrolls print, after which the market closes for a three-day weekend. Warsh's remarks Wednesday could set the tone for how the market reads Thursday's data.
Key Takeaway: Everything funnels into Thursday at 8:30 — structure your risk around that window.
Why did Micron fall on Friday after a blowout earnings report?
Micron reported roughly $41.5 billion in revenue and guided the current quarter toward about $50 billion, confirming a genuine memory super-cycle. But the stock had run hard into and immediately after the print, and a "sold-the-news" reaction set in alongside a reported OpenAI IPO delay that pressured AI-infrastructure names. A blowout that can't hold its gains often signals that a lot of good news was already priced in.
Key Takeaway: How Micron stabilizes this week is a read-through for the entire AI-memory complex.
Should I trade earnings like Nike's aggressively this week?
An ±8.5% implied move on Nike means the options market itself is signaling real uncertainty. Many experienced traders prefer to trade the reaction the next morning, with the result in hand, rather than gamble on the print. The right approach depends entirely on your strategy and risk tolerance, and for the mechanics our earnings playbook breaks down how these reactions tend to unfold.
Key Takeaway: Decide your earnings-night and jobs-day exposure before the events, size honestly, and let your rules — not the adrenaline — make the call.
The Scorecard: How Last Week's Calls Played Out
The receipts from our June 22–26 edition.
What we flagged: Micron's Wednesday earnings as "the defining catalyst of the week," with a wide implied move and read-through to the entire AI-memory complex; Western Digital and SanDisk as the high-beta tells. What happened: Micron blew past even the bull case, posting roughly $41.5B in revenue versus the ~$34.7B we cited and guiding the current quarter near $50B. It ran double digits on the print, SanDisk confirmed with a sharp rally, and then the whole complex gave it back Friday — exactly the "sold-the-news on a good-but-not-perfect tape" risk we flagged, just one day later. Grade: ✅ On target The lesson: When a leader blows out and the group still fades within 48 hours, that's the market telling you how much good news was already priced.
What we flagged: Friday's PCE inflation print as the week's macro hinge, with a scenario where a softer read lets the market look through to the disinflation already visible in oil. What happened: Core PCE came in around 0.3% month-over-month and 3.4% year-over-year — cooler than the firm consensus we'd anchored to — and gold rallied on the softer number, just as our soft-side scenario described. Grade: ✅ On target, with a caveat The lesson: Our scenario design held, but the specific consensus figure we cited was too hot. Anchor to the range, not a single number.
What we flagged: That the 2-year Treasury yield was "the chart that matters most," with the week's action hinging on the rate path. What happened: The week's real swing factor wasn't the rate path. It was the rotation out of Big Tech — driven by a reported OpenAI IPO delay and memory-cost-driven price hikes at Apple and Microsoft — while small caps and the Dow led. Grade: ⚠️ Partial The lesson: This is the honest miss, and it shapes this week's deep dive. We were looking at the bond market when the story was a leadership change in equities. We've followed the rotation to its catalyst — Thursday's jobs report.
What we flagged: Energy as a two-sided setup and small caps (IWM) as the fastest read on the macro. What happened: Crude kept sliding even through a Strait-of-Hormuz incident, as tankers kept flowing and the squeeze risk we emphasized never fired. Small caps didn't just react — they led the entire half. Grade: ✅ On target The lesson: Direction on oil was right; the squeeze stayed a risk, not an event. And small-cap leadership turned out to be the single most important tell of the period.
Disclaimer
Article Sources
- Charles Schwab — Market Update - the week-ahead calendar, Friday's session detail, and the rotation and AI-capex narrative.
- Kiplinger — Economic Calendar and Market Holidays - the jobs report timing, Warsh's speech, and the 2026 holiday schedule.
- IG — Week Ahead - the small-cap-versus-Nasdaq divergence, core PCE detail, and the Warsh hawkish-debut context.
- Yahoo Finance - Friday closing levels for the major indices, VIX, gold, crude, and the 30-year yield.
- SEC EDGAR — Micron 8-K - Micron's fiscal Q3 revenue, EPS, and guidance figures from the primary filing.
- TipRanks — Nike earnings preview - Nike's consensus estimates and the options-implied move into earnings.
- AAII Investor Sentiment Survey - the latest bullish, neutral, and bearish readings and historical averages.
- CNN Business — Fear & Greed Index - the current sentiment reading and its component methodology.
- NYSE — Holidays and Trading Hours - confirmation of the July 3 full closure and the 2026 early-close schedule.
Was this helpful?

Written by
Kazi Mezanur RahmanFounder, independent researcher, and editor of DayTradingToolkit, a one-person publication focused on risk-first trading education, documented tool research, and clear explanations.
Keep Reading

Market Analysis & Insights
The PDT Rule Is Dead: Everything That Changed, When It Takes Effect, and What Every Trader Needs to Do Now
The SEC eliminated the $25K Pattern Day Trader rule on April 14, 2026. Effective June 4. Here's exactly what changed, the new margin rules, and what every broker is doing.

Market Analysis & Insights
Extended Stock Market Hours — What 23-Hour Trading Means for Day Traders
NYSE, Nasdaq, and Cboe are extending to 23-hour trading. Here's what day traders need to know about overnight sessions, broker support, and strategy changes.

Market Analysis & Insights
New Fed Chair Kevin Warsh: What Day Traders Need to Know
Kevin Warsh takes over as Fed Chair this week. Here's what the leadership change means for volatility, interest rates, and how to trade the June 2026 FOMC meeting.
Market Analysis & Insights
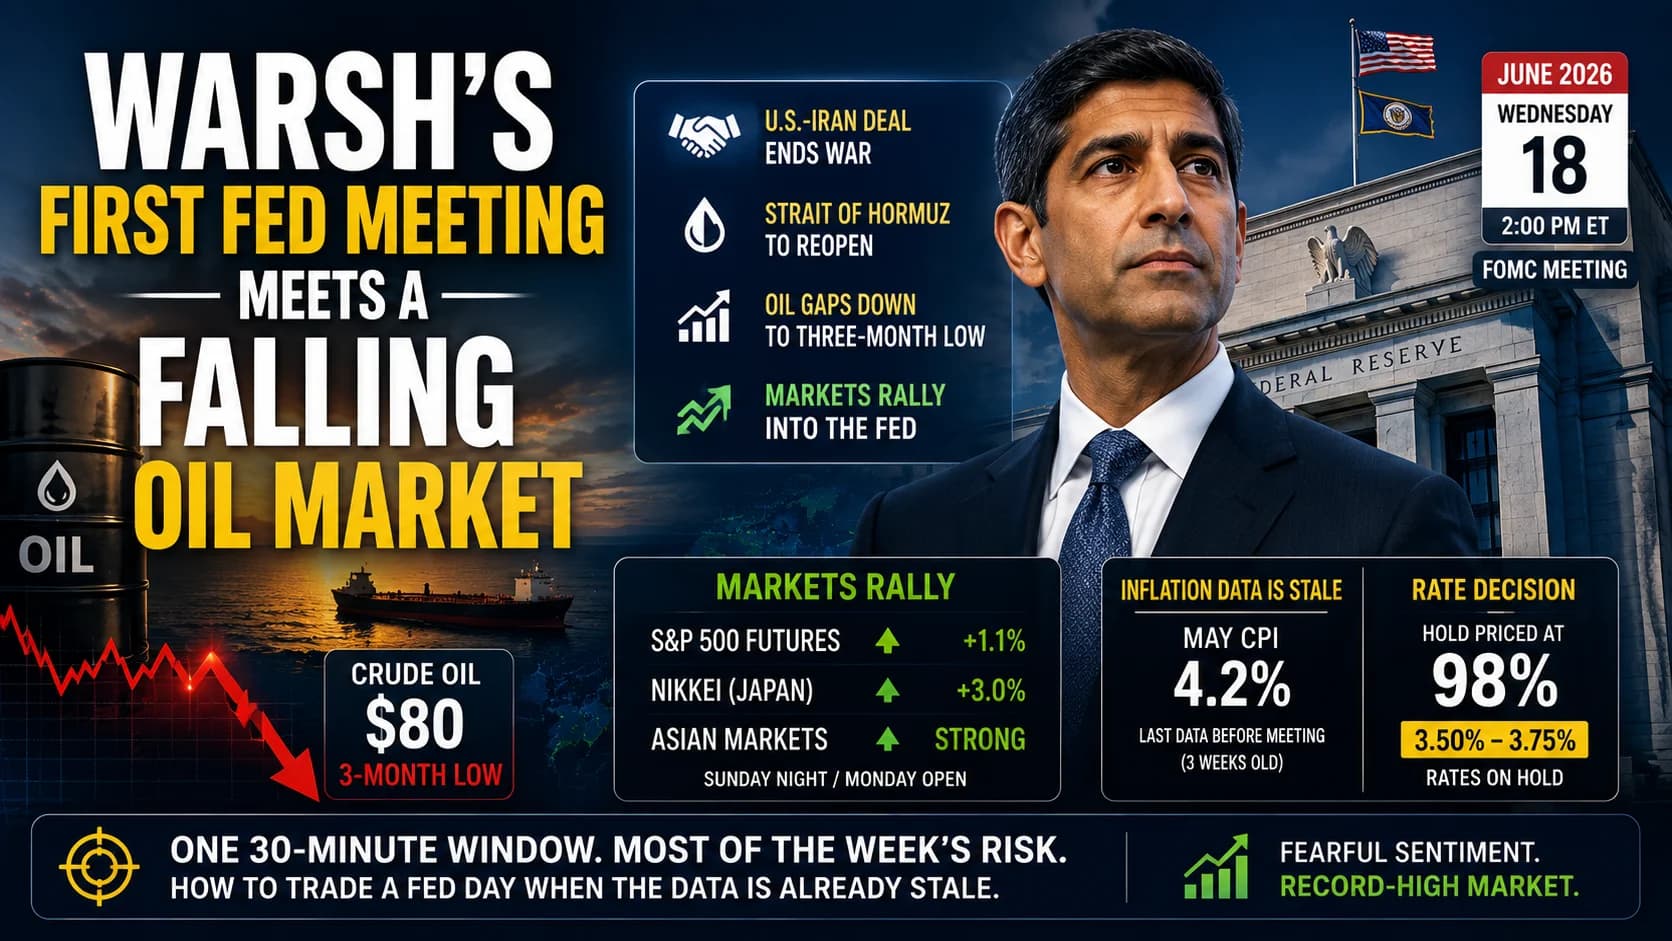
Warsh's First Fed Meeting Meets a Falling Oil Market: Weekly Market Insights— June 15–19, 2026
The U.S.-Iran deal sent oil to a three-month low days before Kevin Warsh's first FOMC meeting. Here's what we're watching when the Fed's data is already stale.
Comments
No comments yet. Be the first to share your thoughts.