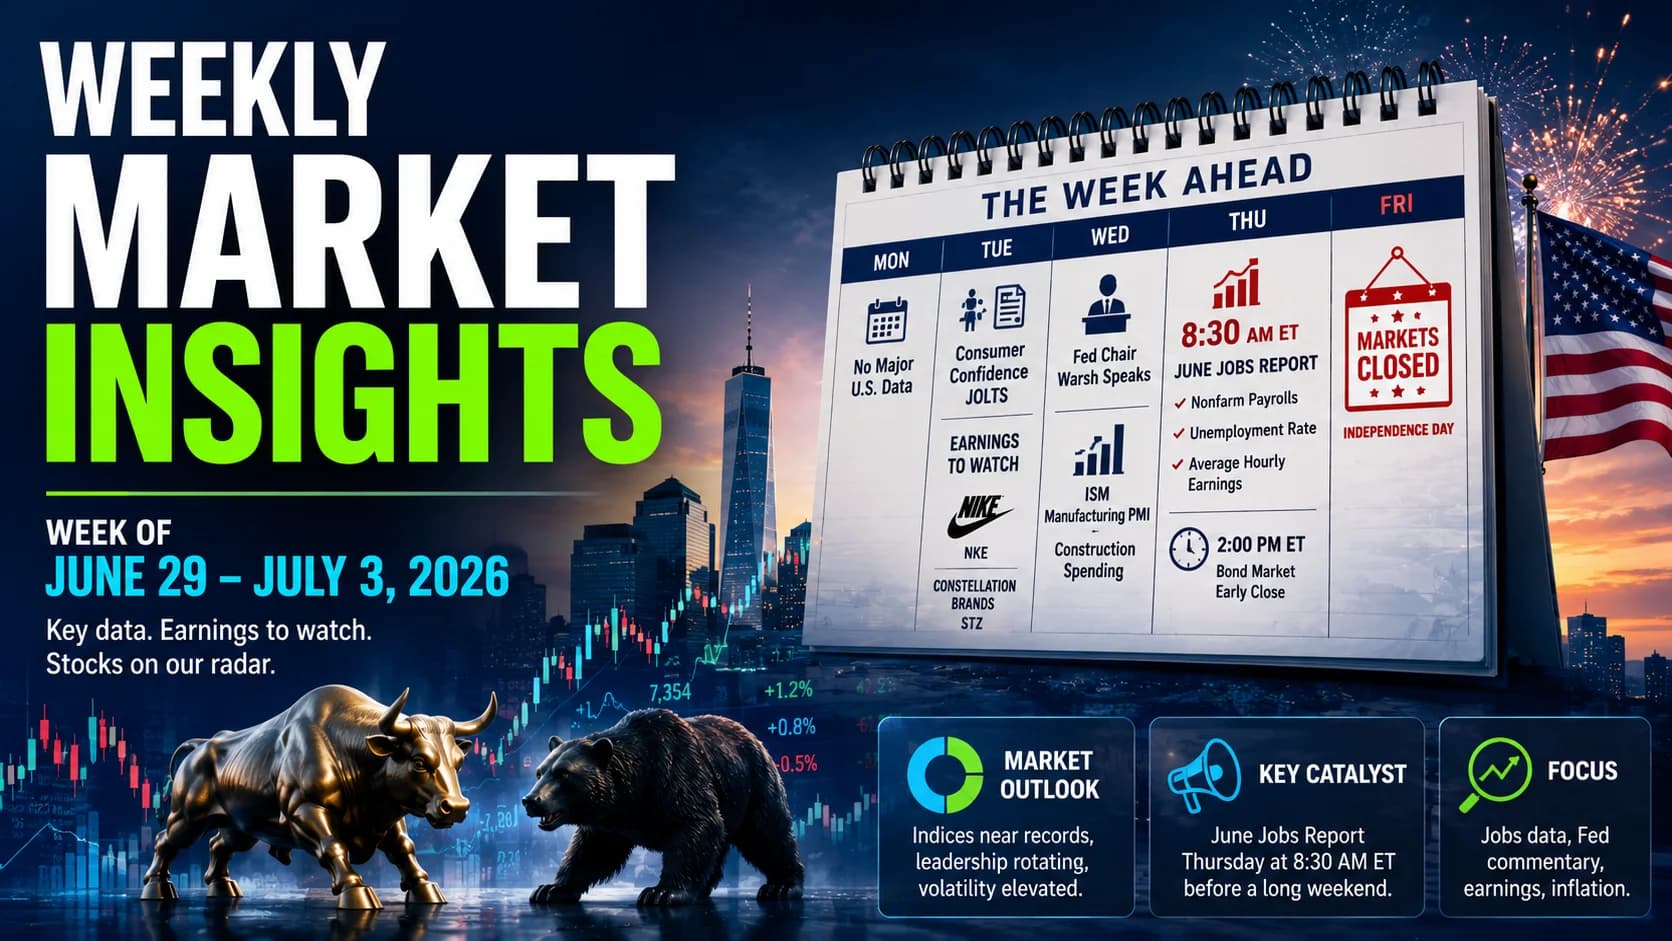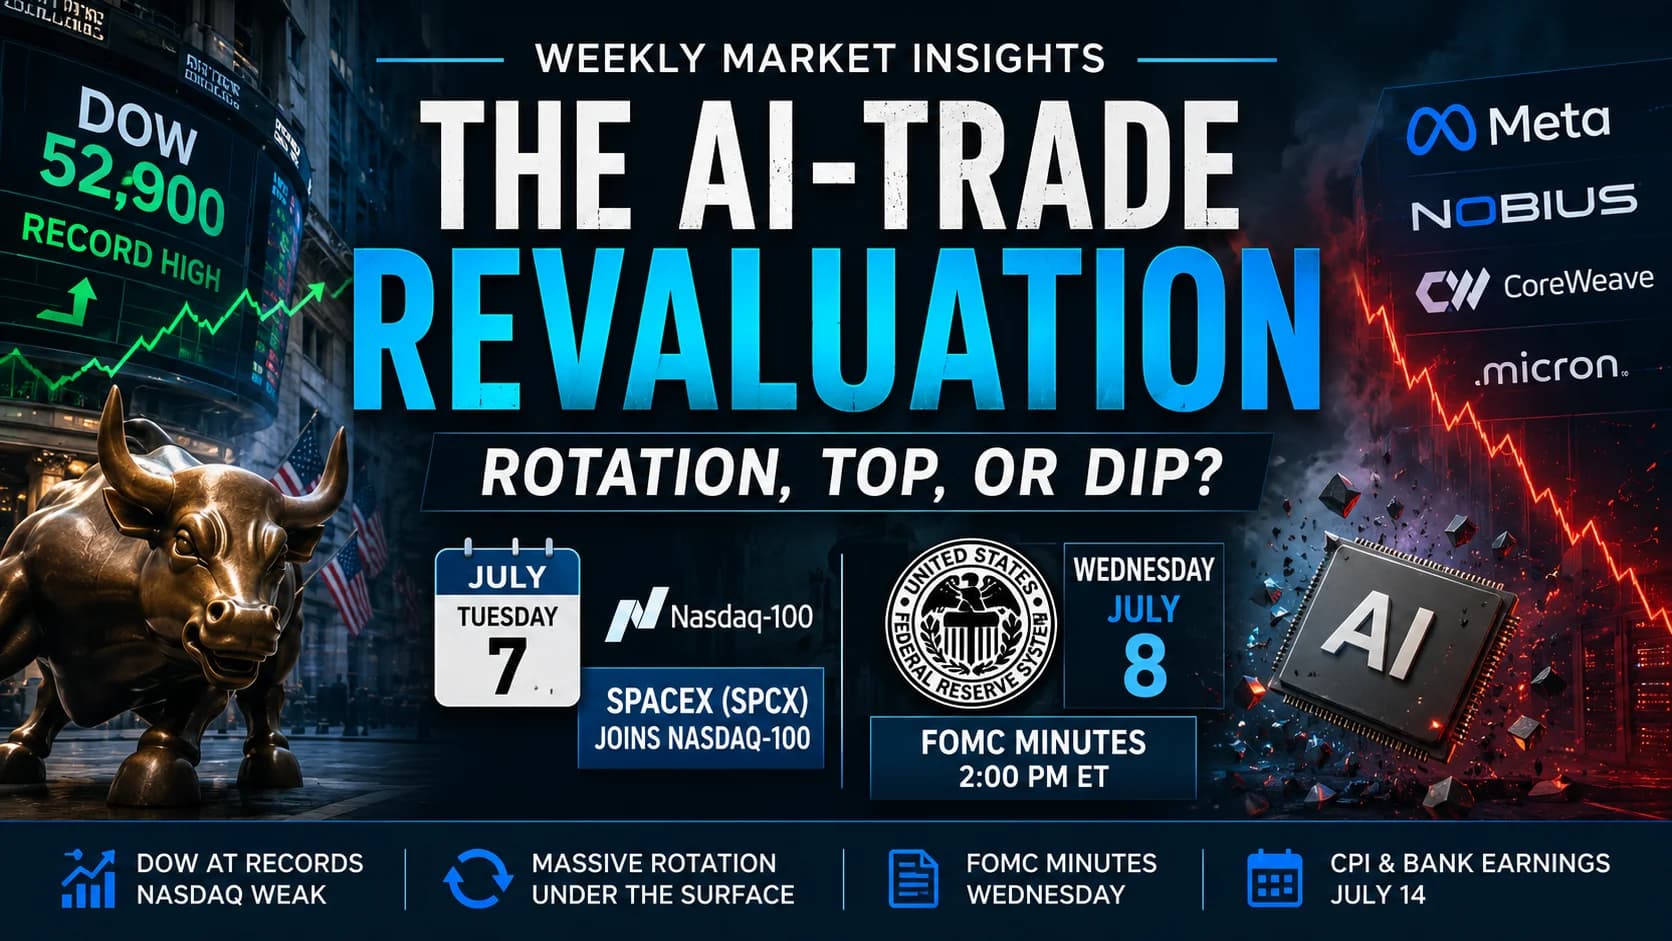
The first half of 2026 closed as one of the best on record, and the way it ended tells you everything about the tape you're walking into this week. On Thursday, the Dow ripped to a record 52,900 while the S&P 500 sat dead flat at 7,483 and the Nasdaq fell. Under that calm surface, the market was violent: a single Bloomberg report that Meta will start selling its excess AI cloud capacity re-priced an entire corner of the market in one session, the "neoclouds" cratered, Micron gave back double digits, and the Magnificent Seven shed roughly $2.3 trillion in value across June. A weak jobs report on July 2 barely moved the needle. The story isn't the Fed or the labor market right now. It's a live re-pricing of the AI trade, and this week hands us two catalysts that could tip it: the first FOMCThe Federal Open Market Committee (FOMC) is the Federal Reserve committee that sets U.S. monetary policy — most importantly, the target federal funds rate — at eight scheduled meetings per year.Read definition → minutes of the Warsh era on Wednesday, and a mechanical index event on Tuesday. Here's the full map.
The Week at a Glance
Times are Eastern. Bolded rows are the genuine market-movers.
- Day
- Monday, Jul 6
- Time (ET)
- 10:00 AM
- Event
- ISM Services PMI (June)
- Why It Matters
- Shifted to Monday by the holiday; the larger share of the economy. Prior read 54.5. Watch the prices sub-index after manufacturing's plunge
- Day
- Tuesday, Jul 7
- Time (ET)
- Open
- Event
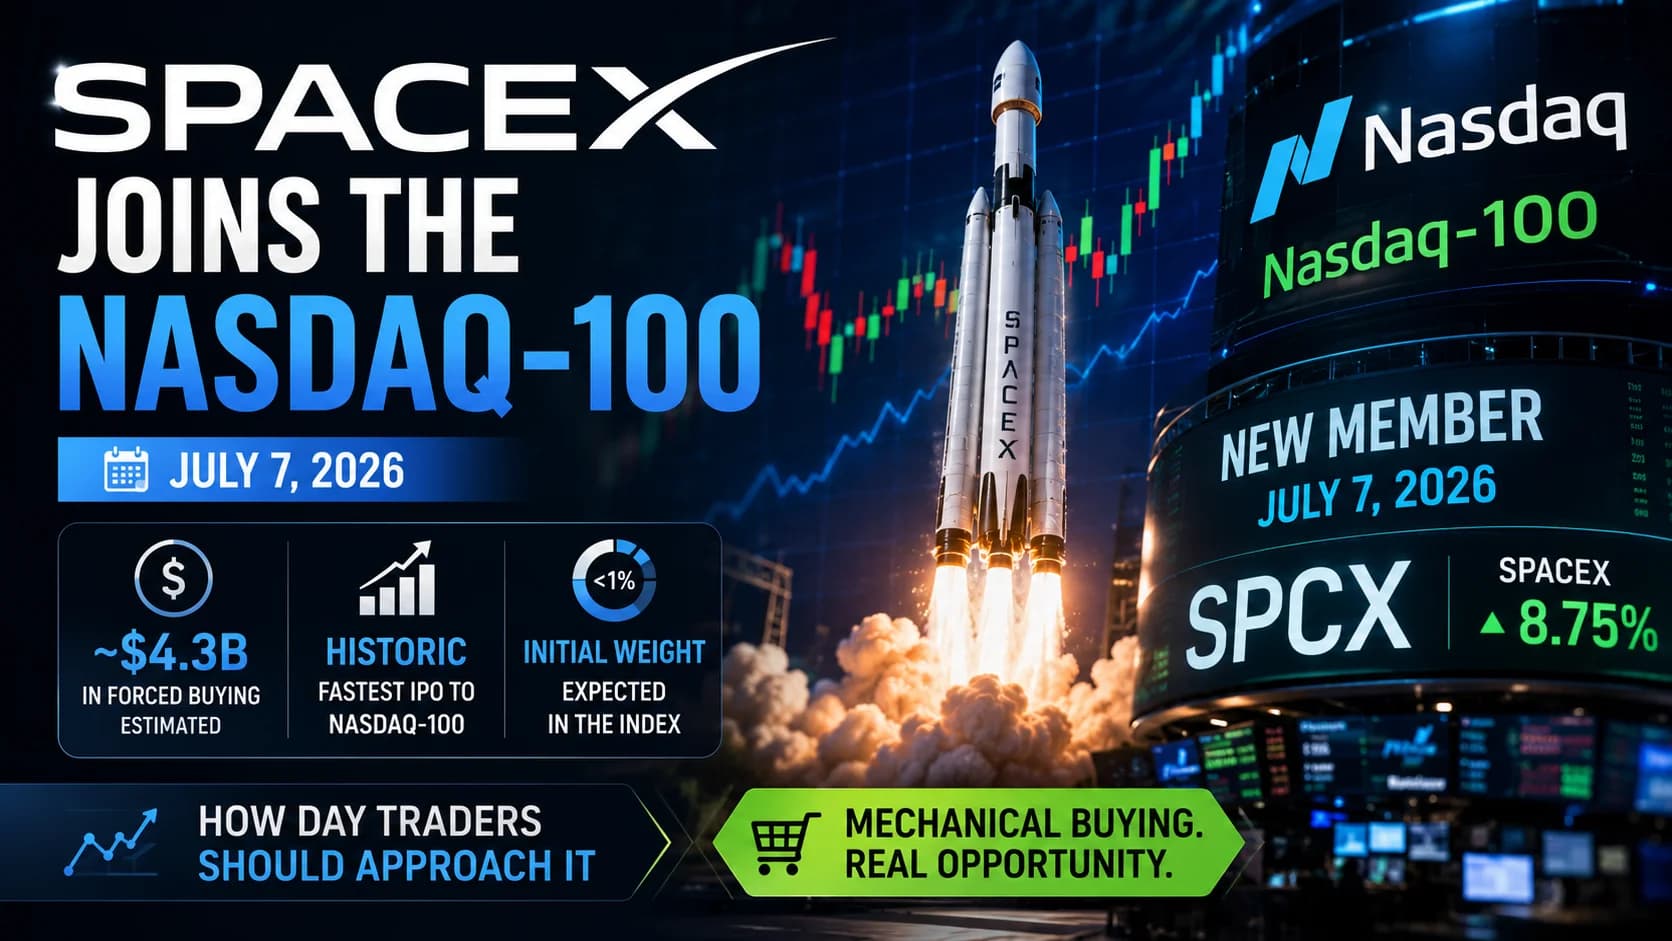
- SpaceX (SPCX) joins the Nasdaq-100
- Why It Matters
- Index funds buy after Monday's close; forced mechanical demand hits a top-6 company, and QQQ rebalances around it
- Day
- Wednesday, Jul 8
- Time (ET)
- 2:00 PM
- Event
- FOMC Minutes (June 17 meeting)
- Why It Matters
- The first inside look at the Warsh Fed's HawkishHawkish describes a monetary policy stance favoring higher interest rates, reduced money supply, or tighter financial conditions to control inflation — the opposite of dovish.Read definition → hold and dot-plot shift. The catch: these minutes predate the soft jobs report, so they read stale-hawkish
- Day
- Thursday, Jul 9
- Time (ET)
- 8:30 AM
- Event
- Initial jobless claims
- Why It Matters
- Prior 215K. The weekly labor pulse now that monthly payrolls have cooled
- Day
- Friday, Jul 10
- Time (ET)
- —
- Event
- Quiet
- Why It Matters
- No major U.S. data; a light EarningsAn earnings report is the quarterly financial disclosure a public company files with the SEC, revealing revenue, earnings per share (EPS), profit margins, and forward guidance — it's the most significant regular catalyst for individual stocRead definition → week overall
| Day | Time (ET) | Event | Why It Matters |
|---|---|---|---|
| Monday, Jul 6 | 10:00 AM | ISM Services PMI (June) | Shifted to Monday by the holiday; the larger share of the economy. Prior read 54.5. Watch the prices sub-index after manufacturing's plunge |
| Tuesday, Jul 7 | Open | SpaceX (SPCX) joins the Nasdaq-100 | Index funds buy after Monday's close; forced mechanical demand hits a top-6 company, and QQQ rebalances around it |
| Wednesday, Jul 8 | 2:00 PM | FOMC Minutes (June 17 meeting) | The first inside look at the Warsh Fed's HawkishHawkish describes a monetary policy stance favoring higher interest rates, reduced money supply, or tighter financial conditions to control inflation — the opposite of dovish.Read definition → hold and dot-plot shift. The catch: these minutes predate the soft jobs report, so they read stale-hawkish |
| Thursday, Jul 9 | 8:30 AM | Initial jobless claims | Prior 215K. The weekly labor pulse now that monthly payrolls have cooled |
| Friday, Jul 10 | — | Quiet | No major U.S. data; a light EarningsAn earnings report is the quarterly financial disclosure a public company files with the SEC, revealing revenue, earnings per share (EPS), profit margins, and forward guidance — it's the most significant regular catalyst for individual stocRead definition → week overall |
The bottom line on the calendar: this is a quiet-data, light-earnings week wedged between two heavyweight weeks. The real fireworks (June CPIThe Consumer Price Index (CPI) is a monthly U.S. government report measuring the average change in prices paid by consumers for goods and services — it's the most closely watched inflation indicator in the market.Read definition → and the first big bank earnings from JPMorgan and Goldman) both land next Tuesday, July 14. That makes this week's tape more about positioning and the AI-trade re-pricing than about any single scheduled print, with Wednesday's minutes as the one true macro event. For how a Fed in this posture changes the way every data point trades, our FOMC and Fed-announcement playbook breaks down the mechanics.
Market Snapshot
Last full session was Thursday, July 2 (Friday was the Independence Day holiday).
- Indicator
- S&P 500
- Level (Thu Jul 2 close)
- 7,483.24 (flat)
- Context
- Within about 140 points of its record; pulled between a strong Dow and weak Nasdaq
- Indicator
- Dow
- Level (Thu Jul 2 close)
- 52,900.07 (+1.14%)
- Context
- A fresh record close on a rotation into old-economy value
- Indicator
- Nasdaq Composite
- Level (Thu Jul 2 close)
- 25,832.67 (−0.80%)
- Context
- Dragged by a second straight day of semiconductor selling
- Indicator
- Russell 2000
- Level (Thu Jul 2 close)
- 2,996.11 (−0.55%)
- Context
- Hit an all-time high midweek; +~22% in H1, its best first half since 1991
- Indicator
- VIXThe CBOE Volatility Index — a real-time measure of the market's expectation for 30-day volatility in the S&P 500, derived from the prices of S&P 500 options. Widely called the "fear gauge," a rising VIX indicates increasing uncertainty and Read definition →
- Level (Thu Jul 2 close)
- 15.81
- Context
- Compressed, and completely hiding the rotation underneath
- Indicator
- WTI Crude
- Level (Thu Jul 2 close)
- ~$68
- Context
- Lowest since the Iran war began; down ~20% in two weeks on the "peace dividend"
- Indicator
- Gold
- Level (Thu Jul 2 close)
- ~$4,187
- Context
- Firm, but coming off its worst quarter in 13 years
- Indicator
- CNN Fear & Greed
- Level (Thu Jul 2 close)
- 32 (Fear)
- Context
- Still fear, with the Dow at records, because the gauge is dragged by the mega-cap unwind
| Indicator | Level (Thu Jul 2 close) | Context |
|---|---|---|
| S&P 500 | 7,483.24 (flat) | Within about 140 points of its record; pulled between a strong Dow and weak Nasdaq |
| Dow | 52,900.07 (+1.14%) | A fresh record close on a rotation into old-economy value |
| Nasdaq Composite | 25,832.67 (−0.80%) | Dragged by a second straight day of semiconductor selling |
| Russell 2000 | 2,996.11 (−0.55%) | Hit an all-time high midweek; +~22% in H1, its best first half since 1991 |
| VIXThe CBOE Volatility Index — a real-time measure of the market's expectation for 30-day volatility in the S&P 500, derived from the prices of S&P 500 options. Widely called the "fear gauge," a rising VIX indicates increasing uncertainty and Read definition → | 15.81 | Compressed, and completely hiding the rotation underneath |
| WTI Crude | ~$68 | Lowest since the Iran war began; down ~20% in two weeks on the "peace dividend" |
| Gold | ~$4,187 | Firm, but coming off its worst quarter in 13 years |
| CNN Fear & Greed | 32 (Fear) | Still fear, with the Dow at records, because the gauge is dragged by the mega-cap unwind |
Regime: a record-setting index masking the most violent rotation of the year. The H1 scoreboard was broad and strong (Dow +8.9%, S&P +9.6%, Nasdaq +12.8%, Russell 2000 +~22%). But the last two weeks flipped the leadership: money is leaving the Magnificent Seven and the AI complex and flowing into the Dow's value names, small caps, biotech, and even crypto-beta. Entering this week, futures point higher (Nasdaq 100 futures up around 0.8% Monday morning), oil sits at multi-month lows, and after Friday's report the market trimmed its Fed-hike bets, though it hasn't erased them. Our read: the tape is quietly changing its leadership while a flat index and a 15-handle VIX hide it. For a framework on reading which regime you're actually trading, our guide on how to identify the market regime is the place to start.
The Big Question: The AI-Trade Revaluation, Rotation, Top, or Buyable Dip?
For three straight weeks we've argued the same thing in this space: the market's real engine is the rotation out of Big Tech, not the Fed or the jobs number. That call has kept paying off, and last Thursday it went from a slow bleed to a full re-pricing. So this week we go straight at the question every active trader is now asking: is the AI-trade revaluation a healthy rotation, the start of a real top, or a dip in the leaders you're supposed to buy?
Start with what actually happened, because the details matter. Bloomberg reported that Meta plans to sell its excess AI cloud capacity to outside developers, essentially turning itself into a cloud provider. Meta jumped roughly 8.8%. But the read-through torched the "neocloud" names that had been renting compute to the hyperscalers: Nebius fell about 17% and CoreWeave about 13.9%. The reason isn't just new competition, it's customer concentration. Nebius reportedly carries a $27 billion Meta deal and CoreWeave a $21 billion agreement, and when your single biggest customer becomes your biggest rival, the multiple the market will pay for your revenue changes overnight. That is a re-pricing of risk, not a panic.
Now layer in the scale of what's being questioned. Alphabet, Amazon, Microsoft, and Meta plan roughly $725 billion in capital expenditure in 2026, up about 77% from last year, and AI-infrastructure beneficiaries account for roughly half of the S&P 500's earnings growth this year. Estimates suggest something like $1.5 trillion of that build-out will be financed with new debt. That last number is the thread that ties this whole story to Wednesday's FOMC minutes: debt-financed capex is rate-sensitive, so a hawkish Fed and an AI-spending boom are on a collision course. With the Shiller CAPE ratio at 41.6, its second-highest reading in over 140 years, the "is this a top?" question is not hysterical. It's legitimate.
Here's the nuance most coverage will miss, and it's the heart of our read. This is not a uniform collapse. On the same days the neoclouds and Micron were getting hit, Applied Materials was upgraded and rose sharply on analyst calls for 30%-plus growth in AI-equipment spending. Micron's roughly 10.6% drop came on no bad news at all, with the CEO reiterating that memory demand is exceeding expectations and supply is constrained beyond 2027. That is a 260%-plus year-to-date winner giving ambitious holders a reason to ring the register at the first sign of turbulence, which is profit-taking mechanics, not a broken thesis. So what we're watching looks less like a wholesale AI top and more like a re-sorting inside the AI trade (equipment and real-demand winners getting bought, concentration-risk and priced-for-perfection names getting sold) layered on top of a broader rotation out into value, small caps, and biotech. When leadership sorts itself out this fast, a real-time scanner like Trade Ideas earns its keep, because the names in play change day to day.
So here's how we're framing the three branches, as observation and not prediction:
The rotation case (healthy broadening). Money leaving a handful of over-owned mega-caps and spreading into the other 493 stocks, small caps, and defensives is what a widening bull market looks like. The Dow at records, the Russell's best first half since 1991, and biotech catching a bid all support this reading. If it holds, you follow the money rather than fight it, and our sector rotation strategy is the toolkit for tracking where it goes.
The top case (the risk you can't dismiss). The Magnificent Seven lost about $2.3 trillion in June alone as investors began questioning whether all that capex will ever earn its return. With CAPE near a 140-year high and $1.5 trillion of build-out riding on debt, a genuinely hawkish set of minutes on Wednesday could accelerate a de-rating of the entire AI complex, and the rotation destinations would not be big enough to absorb that.
The buyable-dip case. If the secular AI thesis is intact (demand real, supply tight, as Micron's CEO insists), then profit-taking in the leaders is exactly the pullback that patient traders wait for, and the re-sorting is the market handing you a shopping list of which names to want and which to avoid.
Our honest read: the evidence leans toward rotation plus internal re-sorting over a wholesale top, but the top risk is real and Wednesday's minutes are the nearest catalyst that could change the answer. What we're watching for the verdict is breadth (does the advance keep broadening, or does the selling spread from AI into everything?) and the reaction in the neocloud names to whatever Meta clarifies next.
Stocks to Watch This Week
Seven names carrying a real catalyst this week. Framing is observation only, what's on our radar and why, never a recommendation. No price levels, because this publishes Monday and we don't know the week's prices.
META — Meta Platforms
📅 Catalyst: The "Meta Compute" story. The reported plan to sell excess AI cloud capacity re-priced the entire AI-infrastructure group in a day.
🔍 Why it's on the radar: This is the single most important stock in the market right now, because its next move defines the neocloud trade. The open question is whether Meta offers raw computing power or hosted AI models, and how aggressively. Any management clarification could move the whole complex again.
👁️ What to watch: Follow-up headlines and any official framing of the cloud business. The market is trying to decide if this is a new revenue engine or a signal that hyperscaler capacity is being overbuilt.
🌐 Broader tape read: As Meta goes on this story, so goes sentiment on the entire AI-infrastructure build-out.
NBIS / CRWV — Nebius and CoreWeave (the neoclouds)
📅 Catalyst: Direct casualties of the Meta news, down roughly 17% and 13.9% respectively last week.
🔍 Why it's on the radar: These names crystallize the customer-concentration risk. Nebius reportedly carries a $27 billion Meta deal and CoreWeave a $21 billion agreement, and the market just repriced what that revenue is worth now that the customer is becoming a competitor.
👁️ What to watch: Whether they stabilize and find buyers at the new, lower valuations, or whether Meta's next comments confirm the breakdown.
🌐 Broader tape read: The clearest gauge of whether the "AI capex is overbuilt" narrative is taking hold or fading.
MU — Micron Technology
📅 Catalyst: A roughly 10.6% drop last week on profit-taking, plus reports that Apple is exploring Chinese memory suppliers.
🔍 Why it's on the radar: The decline came on no bad news. The CEO reiterated that AI-memory demand is exceeding expectations and supply is constrained beyond 2027, and the stock is still up more than 260% year-to-date. This is the cleanest test of the "buyable dip versus broken thesis" question.
👁️ What to watch: Whether dip buyers defend the stock, and whether the Apple-supplier headline proves overblown. Micron is the bellwether for the entire memory complex.
🌐 Broader tape read: If the strongest fundamental story in semis can't hold a dip, that says something about how much profit-taking is left in the group.
NVDA — Nvidia
📅 Catalyst: No earnings, but it's the anchor read on the whole AI-spending narrative as the capex debate intensifies.
🔍 Why it's on the radar: With hyperscalers planning $725 billion in 2026 capex, Nvidia is where the market votes on whether that spending continues. The re-sorting nuance matters here: equipment names like Applied Materials were upgraded even as other AI names sold off.
👁️ What to watch: Whether Nvidia and the broader semis find a floor, or whether a hawkish set of FOMC minutes reopens the valuation debate.
🌐 Broader tape read: The single best gauge of whether the AI trade is still being bought on dips or starting to wobble.
ORCL — Oracle
📅 Catalyst: Ongoing overhang from a reported OpenAI IPO delay and softening AI-token pricing, both of which cloud Oracle's AI backlog.
🔍 Why it's on the radar: Oracle has been a primary beneficiary of the AI build-out narrative, which makes it sensitive to any sign that infrastructure demand or pricing is slipping.
👁️ What to watch: Any news on U.S. government support for OpenAI, which would likely change Oracle's narrative quickly, in either direction.
🌐 Broader tape read: A clean proxy for whether the "AI capex story is intact" question is resolving up or down.
SPCX — SpaceX
📅 Catalyst: Officially joins the Nasdaq-100 before Tuesday's open, with index funds buying after Monday's close.
🔍 Why it's on the radar: Index inclusion creates mechanical, forced demand from every fund that tracks the Nasdaq-100. SpaceX went public June 12 at a record valuation and is already a top-six company by market cap, so the rebalance is significant. We covered the mechanics in detail in our SpaceX Nasdaq-100 inclusion breakdown.
👁️ What to watch: Whether the index-buying bid holds after inclusion, or whether it becomes a "buy the rumor, sell the news" event once the mechanical demand is spent.
🌐 Broader tape read: A live case study in how index mechanics move a stock independent of fundamentals, landing right in the middle of an AI re-pricing.
MRNA — Moderna (the rotation destination)
📅 Catalyst: No single catalyst, but biotech has been the clearest destination for money rotating out of AI.
🔍 Why it's on the radar: For the rotation thesis to be "healthy broadening" rather than "risk-off," the money leaving AI needs somewhere constructive to go. Biotech has been absorbing it.
👁️ What to watch: Whether the biotech and healthcare bid keeps building, which would confirm the broadening, or fades, which would be a warning.
🌐 Broader tape read: A read on whether the rotation has genuine legs or is just a temporary hiding place.
Sectors to Watch This Week
- Sector
- Semiconductors / AI Hardware
- ETF / Names
- SMH / SOXX
- Direction
- In play
- What to Watch
- The revaluation epicenter, with an internal split: equipment upgraded, memory profit-taking, neoclouds crushed
- Sector
- AI Infrastructure / Neoclouds
- ETF / Names
- NBIS, CRWV, IREN
- Direction
- Under pressure
- What to Watch
- Meta-competition and customer-concentration risk; Meta's next comments set the direction
- Sector
- Biotech / Healthcare
- ETF / Names
- XBI / XLV, MRNA
- Direction
- Strengthening
- What to Watch
- The main rotation destination; does the bid keep building?
- Sector
- Dow Value / Old Economy
- ETF / Names
- AAPL, V, WMT, MCD
- Direction
- Leadership
- What to Watch
- Where the money went; watch whether the record-setting bid persists
- Sector
- Crypto-Beta
- ETF / Names
- HOOD, MSTR
- Direction
- Firming
- What to Watch
- A third rotation lane with Bitcoin around $62–63K; MSTR bounced on a plan to sell Bitcoin to support its credit products
- Sector
- Energy
- ETF / Names
- XLE / USO
- Direction
- Two-sided
- What to Watch
- Oil at multi-month lows on the peace dividend, against a still-fragile Iran ceasefire that has flared up more than once
| Sector | ETF / Names | Direction | What to Watch |
|---|---|---|---|
| Semiconductors / AI Hardware | SMH / SOXX | In play | The revaluation epicenter, with an internal split: equipment upgraded, memory profit-taking, neoclouds crushed |
| AI Infrastructure / Neoclouds | NBIS, CRWV, IREN | Under pressure | Meta-competition and customer-concentration risk; Meta's next comments set the direction |
| Biotech / Healthcare | XBI / XLV, MRNA | Strengthening | The main rotation destination; does the bid keep building? |
| Dow Value / Old Economy | AAPL, V, WMT, MCD | Leadership | Where the money went; watch whether the record-setting bid persists |
| Crypto-Beta | HOOD, MSTR | Firming | A third rotation lane with Bitcoin around $62–63K; MSTR bounced on a plan to sell Bitcoin to support its credit products |
| Energy | XLE / USO | Two-sided | Oil at multi-month lows on the peace dividend, against a still-fragile Iran ceasefire that has flared up more than once |
The Teaching Moment: Why the Index Can Be Flat While the Market Is in Chaos
Last Thursday is the perfect classroom. The S&P 500 closed dead flat and the VIX sat at a sleepy 15.81. If that's all you looked at, you'd think nothing happened. Underneath: the Dow rose more than 1%, the Nasdaq fell nearly 1%, Micron dropped 10.6%, Nebius fell 17%, and Meta jumped almost 9%. That is not a quiet market. That is one of the most active rotations of the year, completely hidden by the headline number.
Here's the mechanic. The major indexes are cap-weighted, meaning the biggest companies move them the most, and on any given day gains in one giant can perfectly offset losses in another, leaving the index flat while the stocks underneath are flying in opposite directions. When money rotates between sectors rather than flowing in or out of the market as a whole, the index barely budges, because for every dollar leaving semis, a dollar is arriving in the Dow's value names. The index is measuring the net, and the net can be zero even when the gross activity is enormous.
So how do you see what the index won't show you? You watch breadth. The advance-decline line tells you how many stocks are participating versus how many are being sold. The percentage of stocks trading above their 50-day moving average tells you whether strength is broad or concentrated in a few names. Comparing an equal-weight index to its cap-weighted version tells you whether the "average" stock is doing better or worse than the mega-caps. And sector dispersion (how far apart the best and worst sectors are on the day) tells you whether a rotation is underway. On a day like last Thursday, all of those tools would have screamed "violent rotation" while the S&P whispered "flat." For traders, the lesson is simple and evergreen: the index is a summary, not the story, and knowing what the SPY is actually doing under the hood is a skill worth building. Our guide on why you should know what the SPY is doing goes deeper, and for the psychology of reading crowd emotion, our fear and greed framework explains why gauges like Fear & Greed can read "fear" while the Dow prints records.
Mindset for the Week
A rotating, bifurcated market is the most seductive trap in trading, because there is always something moving.
When the Dow is ripping, semis are cratering, and a neocloud is down 17% all at once, every screen is screaming for your attention, and the temptation is to trade all of it. That's how you end up overtrading a low-conviction tape, getting chopped up switching between themes, and turning a market full of opportunity into a week full of losses. The discipline this week is to pick your lane. Decide in advance whether you're trading the AI re-pricing, the rotation destinations, or the index-mechanics event, and stay in that lane rather than chasing whatever moved last. Define your levels before the open, size for a market that can reverse a theme in an afternoon, and remember that a flat index with a violent interior is exactly the environment where forcing trades bleeds accounts. Sometimes the highest-value decision is to trade less, not more, and our piece on when to sit out makes that case better than a churning tape will.
Your Week Ahead Checklist
- Mark Wednesday 2:00 PM ET, the FOMC minutes, as the single key macro event of the week
- Read the minutes for tone, not news, and remember they predate the soft jobs report, so a hawkish read may be stale
- Watch Meta and the neocloud names (NBIS, CRWV) for the next leg of the AI-infrastructure re-pricing
- Note Tuesday's SpaceX Nasdaq-100 inclusion and watch whether the index-buying bid holds
- Keep breadth tools on your screen (advance-decline, percent above the 50-day) so a flat index doesn't hide the rotation from you
- Track the rotation destinations (biotech, Dow value, crypto-beta) to judge whether the broadening is healthy or fading
- Keep oil and the yen on the radar as macro wildcards: crude sits at multi-month lows and the yen is near a 40-year low with intervention risk
- Pick one lane and run a clean pre-market routine; this is a positioning week, not a chase-everything week
Frequently Asked Questions
What is the AI-trade revaluation that markets are talking about?
The trigger was a report that Meta would sell excess AI cloud capacity, which hit "neocloud" providers hard, alongside heavy profit-taking in semiconductors after an 80%-plus first-half run. The Magnificent Seven lost roughly $2.3 trillion in value during June as this re-pricing unfolded. For the mechanics of how a sector rotation like this works, our sector rotation strategy guide walks through it.
Key Takeaway: The AI-trade revaluation is a re-pricing of risk and valuation across AI names, not necessarily a collapse of the underlying business.
Why did the Dow hit a record while the Nasdaq fell?
On July 2, the Dow closed at a record 52,900 on strength in Apple, Visa, Walmart, and McDonald's, while semiconductor selling dragged the Nasdaq down 0.8%. The two indexes track different kinds of companies, so a rotation between them pulls them in opposite directions on the same day.
Key Takeaway: Divergence between the Dow and Nasdaq is a classic signature of a sector rotation underway beneath the surface.
What are the FOMC minutes and why do they matter this week?
Markets will read them for detail behind the dot-plot shift that showed several officials expecting a 2026 rate hike. The important nuance is that these minutes predate the soft June jobs report, so they may read more hawkish than the Fed's current thinking. Our primer on how economic reports move the market covers how releases like this tend to trade.
Key Takeaway: The minutes matter for tone and context, but traders should weigh them against the softer data that has arrived since the meeting.
Why didn't the weak jobs report move the market more?
The report trimmed the market's Fed-hike expectations without erasing them, and the S&P 500 finished essentially flat on the day. The dominant force in the tape was the rotation out of AI names, not the labor data.
Key Takeaway: When a structural theme like the AI revaluation is driving the market, even a big data surprise can take a back seat.
How does SpaceX joining the Nasdaq-100 affect traders this week?
Index-tracking funds begin purchasing after Monday's close. Because SpaceX is already a top-six company by market cap after its record-setting June IPO, the rebalance is significant and also causes small adjustments across other Nasdaq-100 components.
Key Takeaway: Index inclusion is a mechanical event, so the key question is whether the forced buying holds or fades once it is complete.
Is the AI selloff a buying opportunity or the start of a top?
Some AI names were upgraded even as others sold off, and Micron's drop came on profit-taking rather than bad news, which argues for re-sorting over collapse. But with valuations near multi-decade highs and enormous debt-financed capex, a genuinely hawkish Fed could still change the picture. The honest answer is that it depends on how breadth and the Fed minutes resolve this week.
Key Takeaway: Treat it as a live question to monitor with breadth tools, not a settled call, and let your own rules govern any decisions.
The Scorecard: How Last Week's Calls Played Out
The receipts from our June 29–July 3 edition, graded on the thesis, with any framing miss owned plainly.
Our through-line for three weeks, that the rotation and AI-trade re-pricing is the market's real engine, not the Fed or the jobs number → ✅ On target. This was the correct call and it dominated the week: semiconductors unwound, the Dow hit records on a rotation into value, and the jobs report was a near non-event for the S&P. Honest caveat, stated plainly: we framed last week's headline around a "strong jobs equals trap" scenario, and the number came in weak instead, so that specific tactical overlay never applied. The regime read was right; the framing was the flaw, and it's exactly why this week leans into the rotation itself rather than a data-print prediction.
Semiconductors and Micron, "find a floor or keep unwinding" → ✅ On target. They kept unwinding, with the group selling off for a second straight day and Micron giving back double digits.
Nike (±8.5% implied, "finding a floor") → ✅ On target. Nike beat, but the headline was flattered by a one-time tariff-refund item (roughly $0.72 reported versus about $0.20 underlying), the reaction was muted, and guidance stayed cautious, exactly the "unproven turnaround" framing we used.
IWM as the fast read on the macro → ⚠️ Mixed, the one genuine miss. Small caps had a monster first half and hit an all-time high midweek, but they slipped on the dovish jobs print rather than surging, as a weak-growth signal offset the rate relief.
Iran and oil, "two-sided, bearish side winning" → ✅ On target. Crude fell to multi-month lows on the peace dividend even through periodic flare-ups, extending a roughly 20% two-week decline.
The lesson we're carrying forward: grade the regime thesis where we have an edge, map data-surprises as scenario branches rather than betting the headline on them, and own any framing miss in plain sight. That's the standard this issue is written to.
Disclaimer
Article Sources
- U.S. Bureau of Labor Statistics — Employment Situation - the primary June jobs report figures, revisions, and wage data.bls.gov
- CNBC — Markets - Thursday's closing levels, the semiconductor selloff detail, and the Meta cloud story.cnbc.com
- Yahoo Finance - index, VIX, crude, gold, and Russell 2000 closing levels.finance.yahoo.com
- Kiplinger — Economic Calendar - the FOMC minutes date and the week-ahead schedule.kiplinger.com
- Kraken Economic Brief - the release sequence, CPI timing, and bank-earnings calendar.blog.kraken.com
- Charles Schwab — Market Update - the FedWatch hike-odds shift, oil, and the yen risk.schwab.com
- Forbes — 2026 Market Outlook - hyperscaler capex figures, the debt-financing estimate, and CAPE context.forbes.com
- CNN Business — Fear & Greed Index - the current sentiment reading and methodology.cnn.com