
Riding the Wave: A Deep Dive into Trend Following with Moving Averages
Most traders are introduced to moving averages through the crossover — when the fast line crosses above the slow line, you buy; when it crosses below, you sell. It sounds clean. It looks clean on a chart after the fact. And it loses money with remarkable reliability when you actually trade it in real time.
The core problem is timing. A crossover is, by definition, a lagging event. It tells you that momentum has already shifted — not that it's about to. By the time the 9 EMA crosses above the 21 EMA, a significant portion of the move that caused the crossover has already happened. You're buying the confirmation, not the opportunity. In trending markets this produces workable but late entries. In choppy markets — which represent the majority of trading days — it produces a relentless stream of false signals that each cost you one stop-loss distance before reversing.
This article is about using moving averages correctly for intraday trend following. Not as crossover machines, but as the three things they actually are: slope indicators, dynamic support and resistance levels, and a visual representation of trend strength through their stacked order. Traded this way, moving averages become one of the most useful frameworks in a day trader's toolkit. Traded as crossovers, they're expensive noise.
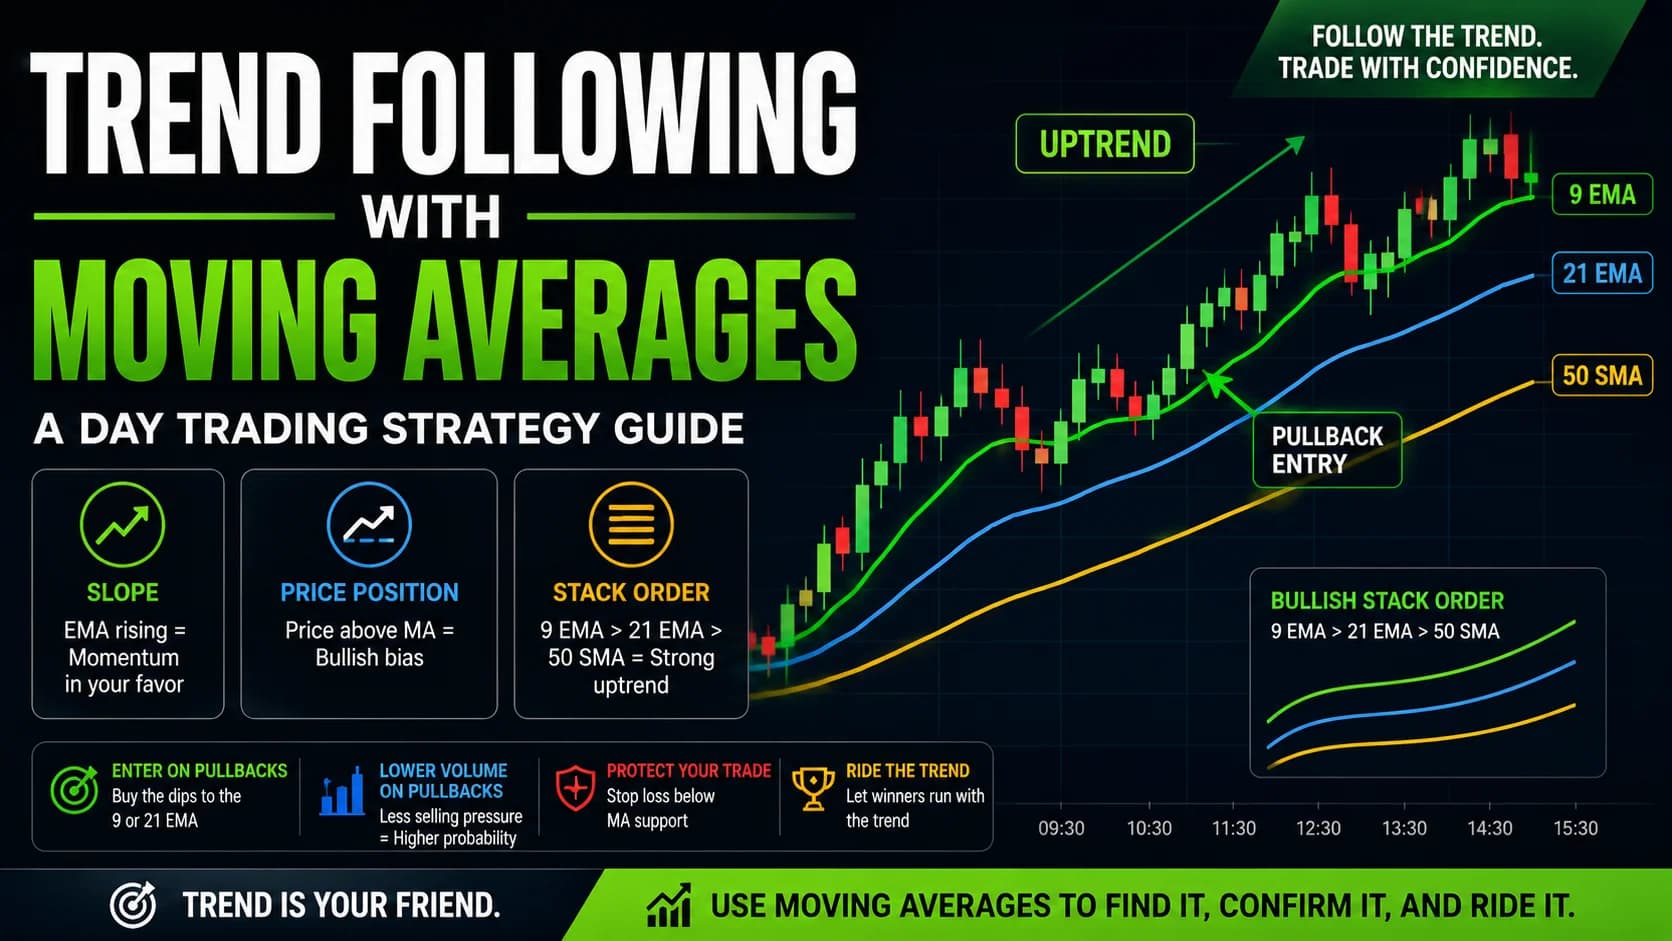
What is moving average trend following for day traders? Moving average trend following is a strategy that uses the slope, price position relative to key exponential moving averages, and the stacked order of multiple EMAs to identify directional momentum in a trending stock, then enters on pullbacks to those moving averages as dynamic support levels rather than waiting for lagging crossover signals. The primary instruments are the 9-period and 21-period EMAs on a 5-minute chart as intraday trend gauges, with the 50-period SMA providing session-level bias context. Entry is taken when price pulls back to a rising EMA in an established uptrend (or a declining EMA in a downtrend), with the stop placed below the MA used as the entry level.
The Quick Answer
Use three MA signals, in this order of importance: slope (is the EMA rising or flat?), price position (is price above or below the EMA?), and stack order (are the EMAs arranged in the right sequence for the trend direction?). A crossover is simply three of these conditions changing simultaneously — by the time it fires, the best entry is gone. For day trading, the 9 EMA and 21 EMA on a 5-minute chart are your primary trend tools; the 50 SMA provides broader session context. Enter when price pulls back to the 9 or 21 EMA in an established trend, on declining volume, with the stop just below the EMA level. Never use raw MA crossovers as entry signals without a regime filter confirming that conditions are actually trending.
Why Crossovers Are the Weakest MA Signal
Before getting into what works, it's worth being specific about what doesn't — and why.
A raw moving average crossover strategy on intraday timeframes fails primarily because of whipsaws: the market crosses above the fast MA, triggers a long entry, then crosses back below within a few bars, triggers a stop and a short entry, crosses back up again, and repeats this pattern multiple times while going essentially nowhere. Each round trip costs one full stop-loss distance. In choppy or range-bound conditions — which make up 70-85% of all trading days — this pattern produces a string of small losses that are individually manageable but collectively destructive.
The data backs this up in a straightforward way. Research and backtesting of raw MA crossover strategies consistently finds that a majority of signals — in some analyses, 60-65% — produce losing trades even in normally trending markets. The rationale for using crossovers anyway is that the winners are supposed to be large enough to overcome the frequent losers. In strongly trending markets, that sometimes holds. In real-world trading, where trend days are a minority of sessions, the average outcome of a raw crossover system runs close to breakeven or slightly negative before considering transaction costs.
This isn't a reason to abandon moving averages. It's a reason to stop using the crossover as the primary signal and start using the more informative signals that moving averages provide continuously — not just at the moment they cross.
The Three MA Signals That Actually Work
These three signals exist at all times, not just at crossovers. They're available from the moment you open a chart, and they update with every candle. Reading them in combination gives you a real-time picture of trend health that a crossover signal captures only imperfectly and late.
Signal 1: Slope
An EMA's slope is the most immediate indicator of current momentum direction. A rising EMA means that recent prices are, on average, higher than earlier prices — demand is present and sustained. A falling EMA means the opposite. A flat EMA means momentum has stalled — neither buyers nor sellers are decisively in control.
Slope quality matters, not just direction. A sharply rising 9 EMA indicates strong, accelerating momentum. A gradually rising 9 EMA indicates mild positive momentum that could easily stall. When you see a 9 EMA beginning to flatten after a strong upward slope, that's often the earliest signal that the trend is losing energy — well before any crossover signal fires and well before the price action itself makes the exhaustion obvious.
For practical trading, assess slope visually by looking at the angle of the EMA relative to horizontal. There's no need to calculate exact degrees. An EMA that's clearly climbing at a steep angle is a strong slope signal. An EMA that's barely tilted from horizontal is a weak or neutral signal. Flat plus a crossover is one of the most common sources of whipsaw entries — the crossover fired, but the slope never confirmed genuine momentum.
Signal 2: Price Position
Where price is relative to a given EMA tells you the current relationship between price and recent average value. Price consistently above a rising 21 EMA means buyers have been dominant long enough to establish the EMA as a floor — a level they're defending by re-entering on dips to it. Price consistently below a falling 21 EMA means sellers are dominant, and any bounce toward the EMA represents an opportunity for sellers to add rather than buyers to step in.
This signal is valuable as a bias filter. When a stock opens and holds above its 9 and 21 EMA by 9:40 AM with both EMAs sloping up, the default bias for the session is long. Every pullback to those levels is a potential entry, not a warning sign. When a stock opens below its 9 and 21 EMA with both declining, the default bias is short, and rallies to those levels are short-entry setups rather than long entries.
The flip side is also important. When price is extended far above the 21 EMA — significantly stretched beyond where the EMA sits — that gap indicates the stock has run fast and hard. The probability of a mean reversion pull toward the EMA increases. This doesn't mean you fade the trend, but it means you don't chase a new long entry at a point where price is well separated from the EMA levels that define the trend's support structure.
Signal 3: Stack Order
When multiple MAs are arranged in a specific sequence — fastest above intermediate above slowest for an uptrend, fastest below intermediate below slowest for a downtrend — that arrangement is called a "stacked" or "aligned" configuration. It's the most powerful MA confirmation available on any timeframe.
For intraday trend following, the stack you want to see in an uptrend is: 9 EMA above 21 EMA above 50 SMA, all sloping upward, with price above all three. When this configuration is present on a 5-minute chart, you have three independent time horizons all agreeing that the trend is up. The shortest-term participants (reflected in the 9 EMA) are bullish. The intermediate-term participants (reflected in the 21 EMA) are bullish. The session-level picture (reflected in the 50 SMA) is bullish. The alignment of all three is a much higher-confidence signal than any one of them alone.
The reverse stack — 9 EMA below 21 EMA below 50 SMA, all declining — signals a confirmed downtrend at all three timeframes simultaneously.
The strength of the stack isn't binary. A perfect stack with wide spacing between the MAs indicates a mature, powerful trend. A stack where the 9 EMA has just barely crossed above the 21 EMA with the 50 SMA still relatively flat indicates an emerging trend that hasn't yet been confirmed at all timeframes. The former deserves high conviction; the latter deserves patience.

The Day Trader's MA Configuration
For the intraday trend-following strategy described here, our standard configuration on a 5-minute chart uses three tools:
9-period EMA — the fastest, most responsive line. Tracks very recent price momentum. Useful for identifying the shallowest pullback entries on the strongest trend days. Because it responds quickly to price changes, it also gives the earliest slope warnings when momentum is fading. The 9 EMA on a 5-minute chart reacts to the last 45 minutes of price action with heavier weighting on the most recent candles.
21-period EMA — the intermediate trend anchor. Slower to respond, which means it filters out more of the short-term noise that the 9 EMA captures. On a strong trend day, the 21 EMA typically acts as the first major support level where price bounces after a more meaningful pullback. A pullback to the 21 EMA that holds and bounces is a higher-conviction entry than a bounce off the 9 EMA, because it represents a deeper retracement that still found buyers — evidence of genuine demand at a worse price.
50-period SMA — the session context line. On a 5-minute chart, the 50 SMA covers roughly 4.5 hours of price action and represents the developing trend for the full session. When price is above a rising 50 SMA, the session's overall direction is up. A break below the 50 SMA — especially a close below it on above-average volume — is one of the most reliable signals that the intraday trend has changed character, not just pulled back.
This three-line configuration is intentionally simple. Adding more moving averages beyond these three produces visual clutter and conflicting signals without adding meaningful information. If the 9 EMA, 21 EMA, and 50 SMA are all aligned and sloping in the same direction, that's the confirmation you need. You don't need a fourth or fifth line to confirm the confirmation.
For traders new to moving averages who want to understand the mechanics of how EMAs are calculated versus simple moving averages, the Beginner's Guide covers the foundational concepts before you apply them in a live trading context.
Reading the MA Stack in Real Time
Here's what the stack looks like at different stages of trend development — and what each stage means for your trading decisions.
Emerging trend (early stack formation): The 9 EMA has turned up and crossed above the 21 EMA, but the 50 SMA is still flat or barely rising. This is the earliest trend signal. It's real, but it's unconfirmed at the broader timeframe. Entries here carry more risk of the move failing to develop into a full trend day. Reduce initial position size and use tighter stops. The reward for early entry is a full trend day captured from near its beginning; the cost of being wrong is a quick stop at a modest loss.
Confirmed trend (full stack alignment): 9 EMA above 21 EMA above 50 SMA, all rising with clear positive slope, price above all three. This is the highest-conviction configuration. Pullbacks to any of the three MA levels represent legitimate entry points. The stop level is clear (below the MA providing support), the trend is confirmed at multiple timeframes, and the risk-reward is well-defined. Most of your entries should occur in this phase.
Extended trend (stretched stack): The 9 EMA has moved significantly above the 21 EMA, with a wide gap between them. Price has run far above the 50 SMA. The stack is aligned but stretched. This configuration typically signals that the trend is in its later stages — the easy money has been made and the next entry carries more mean-reversion risk. Existing positions should be managed with tighter trailing stops. New entries should be avoided or sized significantly smaller.
Trend transition (stack compression): The 9 EMA begins to flatten and approach the 21 EMA. The gap between them narrows. Price begins to break below the 9 EMA even on relatively light volume. This is the warning phase — the trend isn't over, but it's losing energy. Stop adding to positions. Tighten stops on existing holdings. If the 9 EMA crosses below the 21 EMA with both then declining and the 50 SMA starting to turn flat — that's the exit signal for anyone still holding from early trend entries.
Setup Specification
Market Conditions Required: Full MA stack aligned: 9 EMA above 21 EMA above 50 SMA, all with positive slope (for longs). Broad market neutral to supportive. RVOL above 2.0x indicating genuine institutional participation. Real catalyst or sector-level momentum present.
Time of Day: Primary entries: 9:45 AM to 11:00 AM ET while the trend is in its active phase. Secondary entries: trend continuation setups after 1:30 PM if the MA stack remains aligned after midday consolidation. Avoid MA-based trend entries in the 11:00 AM to 1:00 PM window when volume is lowest and the EMAs frequently produce false pullback signals.
Stock Selection Criteria: Average daily volume above 500,000 shares. Clear catalyst-driven or sector-driven momentum. Price between $5 and $500 (outside these ranges, EMA behavior becomes less predictable for intraday purposes). Float appropriate to strategy: high-float stocks produce smoother, more reliable MA structure; low-float stocks produce sharper but less reliable MA interactions.
Entry Trigger — Long: Price pulls back to the 9 EMA (shallowest entry, highest-momentum stocks) or the 21 EMA (deeper pullback, stronger confirmation). Entry fires when the first 5-minute candle that touches or approaches the EMA closes back above the EMA, showing that buyers defended the level. Volume on the pullback candles should be lighter than the trend thrust candles — declining volume on the dip, expanding volume on the bounce.
Entry Trigger — Short: Price bounces toward the 9 EMA or 21 EMA (now resistance) in an established downtrend. Entry fires when the first 5-minute candle that tests the EMA closes back below it with volume confirming the rejection.
Stop Loss: Long: below the low of the pullback candle that provided the entry (typically 5-15 cents below the EMA level, depending on the stock's normal volatility). If price closes a 5-minute candle below the entry EMA after your fill, exit immediately — the MA failed as support and the trade premise is invalidated. Short: above the high of the bounce candle.
Profit Targets: Scale-out structure: take the first portion (one-third to one-half) off at 1:1 to 1.5:1 risk-reward from entry. Move stop to breakeven or slight profit on remaining shares. Trail remaining shares under each successive higher low (for longs), tightening the trail as the MA stack begins to compress or the trend enters the extended phase.
Invalidation: Exit entire position if: price closes a 5-minute candle below the 21 EMA with volume expanding on the breakdown (MA failed as support — not a pullback but a break); the 9 EMA crosses below the 21 EMA; or broad market deteriorates sharply against the trade direction.
Walk-Through Example: Reading the Stack Live
An archetypal mid-cap stock — call it ABC — is trading up on an analyst upgrade. At 9:30 AM it opens at $47.20, runs to $49.10 in the first 8 minutes on RVOL of 4.8x. By 9:45 AM, the 9 EMA on the 5-minute chart has moved to $48.30, the 21 EMA to $47.85, and the 50 SMA to $47.40. All three are rising. Price is above all three. The stack is forming cleanly.
ABC pulls back from $49.10 to $48.45 over the next two candles, with each pullback candle showing noticeably lighter volume than the thrust candles. Price approaches the 9 EMA at $48.30, touches $48.28 on the candle low, and then the following 5-minute candle closes at $48.70 — back above the 9 EMA, with a slight volume uptick on the bounce. This is the entry trigger.
Entry at $48.75 (just above the bounce candle close). Stop at $48.10, below the pullback low of $48.28 — giving $0.65 of risk. First target at $49.40 (approximately 1:1), extended target at $50.50 (a prior resistance level visible on the chart).
ABC runs to $49.50, first scale-out fires at $49.40. Stop moves to breakeven ($48.75). ABC pulls back to $48.85 — this time pulling to the 9 EMA which has now risen to $48.70, holds, and bounces. The stack is still perfectly aligned. Remaining position is held. By 10:45 AM, ABC reaches $51.20 before the 9 EMA begins to flatten near $50.40. The trailing stop under the most recent higher low at $50.10 triggers at $50.05 as ABC finally pulls back through it.
Result: first portion at $0.65 gain (1:1). Remaining portion at $1.30 gain per share on the trail. The MA stack gave the entry signal, provided continuous trade management reference points (each higher low under a rising EMA), and gave the exit signal when the slope began to flatten. No crossover needed.

Where This Strategy Fails
Moving average trend following fails in specific, predictable ways. Know these before trading it.
Choppy markets produce relentless whipsaws. When the market has no directional commitment — when highs and lows aren't sequencing in either direction — the 9 EMA and 21 EMA cross back and forth repeatedly. Every bounce off the 9 EMA fails and becomes a new pullback through it. Every rally from the 21 EMA reverses back below it. Each failed entry costs a stop-loss. Five consecutive whipsaws produce significant damage even when each individual stop is small.
The remedy is a regime filter applied before the strategy is used at all. If the 50 SMA is flat (not sloping clearly in either direction), don't enter MA-based trend trades. If price has crossed the 21 EMA more than twice in the past 90 minutes without making a new high or new low, the market is chopping and the strategy doesn't apply. Put the trigger down and wait.
Early trend entries before stack confirmation carry high failure rates. Entering when only the 9 EMA has turned up — before the 21 EMA or 50 SMA confirm — means you're betting on a trend that hasn't established itself at multiple timeframes. These entries fail more frequently and are best treated as reduced-size speculative positions rather than full-conviction trend trades.
The 9 EMA is too fast for volatile, low-float stocks. In stocks with wide intraday ranges and erratic price action, the 9 EMA whips so quickly that it provides more noise than signal. The 21 EMA is a better primary entry level for volatile instruments; the 9 EMA can still serve as a slope indicator but shouldn't be used as an entry trigger.
We've experienced this first-hand on what looked like a perfect setup. The stack was aligned at 9:50 AM, RVOL was solid, we entered the 21 EMA pullback — and the underlying market sold off sharply on a macro headline at 10:05 AM. The stock broke every MA level within minutes. The stop did its job, but the trade illustrated the limitation clearly: even a perfect MA stack setup can be undone by broad market events that have nothing to do with the individual stock. Market context is never a secondary consideration.
Adapting Across Market Regimes
When the VIX is elevated and intraday ranges are expanded, MA levels become wider apart and more definitive. Pullbacks to the 21 EMA on a high-VIX trend day may represent $1.50-$2.00 of retracement on a $50 stock rather than $0.50. This changes the practical stop calculation — stops must be placed further from entry to avoid being hit by normal volatility before the bounce occurs. Adjust position size to maintain consistent dollar risk as the MA levels spread wider.
When the VIX is compressed and ranges are narrow, the 9 EMA and 21 EMA stay very close together. Pullbacks are shallow and fast. Entries at the 21 EMA may not be available because price barely pulls that deep before resuming. In these conditions, the 9 EMA pullback entry (or even a VWAP pullback entry — covered in Trading the First Pullback to VWAP) becomes the more realistic entry point, with a tighter stop reflecting the narrower range environment.
The complete framework for identifying which market regime you're in — and how to adapt trend-following mechanics to each — is covered in The Ultimate Trend Following Strategy Guide. That guide covers the broader context; this article provides the MA-specific implementation within it.
Tools That Support MA Trend Trading
The single most important tool for MA-based trend following is a clean, fast charting platform that plots EMAs without lag, supports multiple overlapping MAs on a 5-minute chart, and allows you to customize colors and line thickness so the stack is readable at a glance during live trading.
A scanner that surfaces trending stocks in real time is equally important for finding the right candidates. The challenge isn't drawing the MAs — it's identifying which stocks have the stack formation you're looking for before the entry window closes.
Trade Ideas alerts can be configured to flag stocks that are exhibiting strong directional moves with above-average RVOL — the surface conditions that correlate with clean MA stack formation. Rather than manually scanning charts to find a stock with aligned EMAs, you get a shortlist of candidates where the conditions for MA trend trading are most likely to be present. From there, the chart confirmation takes seconds rather than minutes.
For a complete breakdown of charting platforms, scanners, and trading tools our team uses across all strategies, see our day trading toolkit.
How MA Trend Following Fits a Complete Trading Plan
Moving average trend following integrates naturally into a day trading plan as the primary trending-market strategy. It pairs cleanly with the pullback strategies in Buying the Dips and Selling the Rips — because a pullback to the 21 EMA is a pullback entry; MA trend following just gives you a specific, objective level to frame the entry around.
The MA stack also serves as a framework for trade management in any trend trade, not just MA-specific entries. Even if your primary entry is off VWAP or a prior-day high, the 9/21 EMA relationship tells you in real time whether the trend is strengthening, holding, or beginning to fade. Used this way, the stack isn't just an entry signal — it's a continuous trade management tool that informs when to add to a position, when to tighten trailing stops, and when to exit before the stop is reached.
For traders who want to build the most complete trend-day toolkit, the Trend Day Trading Playbook covers the mechanics of maximizing capture on the strongest possible trend days — including how to use MA stack dynamics alongside VWAP and market structure to stay in a trend longer than most traders manage.
Position sizing for MA-based entries follows fixed percentage risk rules with one practical addition: on days when the MA stack alignment is perfect (full stack, wide spacing, strong slope), consider your A-grade setup criteria — from the A+ Setup Mindset — and size the trade accordingly. A perfect MA stack on a genuine trend day is one of the cleaner A-grade signals available.
FAQ
Why do the 9 EMA and 21 EMA work better than other MA combinations?
The 9 EMA on a 5-minute chart covers the last 45 minutes with recency weighting — recent enough to respond to current session momentum but not so fast that it becomes noise. The 21 EMA covers roughly 1.75 hours with the same recency bias — long enough to represent the session's developing trend rather than just the last few candles. Their relationship captures the interaction between short-term and intermediate-term momentum in a way that has practical intraday relevance. That said, the 8/21 or 10/20 combination would work similarly. The specific numbers matter far less than the principle: one fast EMA for immediate momentum and one intermediate EMA for session trend context, both exponential to give appropriate weight to recent prices.
Key Takeaway: The 9 and 21 EMA are popular enough to function as shared reference levels for many participants — which itself provides value — but the framework matters more than the exact parameters.
What's the difference between using an EMA versus an SMA for day trading?
For the fast and intermediate trend lines — the 9 and 21 period — exponential moving averages are preferred precisely because responsiveness matters more than smoothness. A fast-moving stock needs a fast-responding line. For the broader session context line — the 50 period — many traders use the simple moving average because at that timeframe, the smoothing of an SMA helps filter intraday noise and produce a cleaner bias signal. Using an EMA for the 50-period produces a line that can whip enough on a single volatile candle to create a misleading picture of the session's overall direction.
Key Takeaway: Use EMAs for your fast (9) and intermediate (21) trend lines; an SMA for your broader context line (50) produces a cleaner, more stable session bias signal.
How do I avoid whipsaws without adding too many filters?
The instinct after getting whipsawed is to add more filters — an ADX threshold, a volume requirement, a market breadth condition, a higher-timeframe check. These can all help at the margins, but they also add complexity and can produce analysis paralysis during live trading. The more powerful approach is to apply one decisive filter robustly rather than five filters loosely. The 50 SMA slope check is that filter: if it's not clearly rising (for longs) or clearly declining (for shorts), the strategy is on hold regardless of what the 9 and 21 EMA are doing.
Key Takeaway: One robust filter — 50 SMA clearly sloping in the trade direction — eliminates the majority of whipsaw risk without adding complexity that breaks down during live market conditions.
Should I use the same MA settings on all stock types?
The 9/21/50 configuration is a reasonable default across most liquid stocks. Where interpretation changes: on highly volatile, low-float stocks, the 21 EMA is the minimum reliable entry level — the 9 EMA bounces are too fast and erratic to trade mechanically. On very stable, high-liquidity instruments like SPY or QQQ, the 9 EMA pullback is often a clean and reliable entry because the price action is smoother and more predictable at the EMA level. Adjust your entry level based on the stock's typical intraday volatility, not based on which MA looks better in hindsight.
Key Takeaway: The parameters (9/21/50) are consistent across stock types; the primary entry EMA (9 vs. 21) should reflect the stock's volatility characteristics.
What happens to the MA strategy when a trend day transitions to an afternoon range?
The transition from trending to range conditions is often telegraphed by the MA stack before price action makes it obvious. You'll notice the 9 EMA beginning to pull toward the 21 EMA even as price makes new highs — a divergence between price extension and MA compression that signals the trend is losing momentum. When the gap between the 9 EMA and 21 EMA begins to narrow with both MAs flattening, that's the cue to protect profits aggressively rather than waiting for new MA pullback entries.
Key Takeaway: MA stack compression — the 9 EMA approaching the 21 EMA while both flatten — is the earliest signal that the trending phase is ending and the range phase is beginning.
Can MA trend following work on the short side as well as the long side?
The short-side application works particularly well on stocks that have experienced a significant breakdown — a failed earnings report, a product recall, a significant negative news event — where institutional sellers are reducing positions over the course of the session. Bounces to the 9 or 21 EMA in a downtrend represent the same kind of short-entry opportunity that pullbacks to those levels represent for long entries. One practical difference: stocks in downtrends often have more erratic intraday bounces than uptrends because short-covering creates sharp, brief counter-moves. Use the 21 EMA rather than the 9 EMA as your primary entry level on the short side to avoid getting squeezed by those sharp but temporary bounces.
Key Takeaway: The short-side MA strategy mirrors the long-side logic exactly. Use the 21 EMA as the primary entry level for shorts to give more buffer against short-covering bounces.
How does MA trend following relate to VWAP?
When a stock is trending strongly, VWAP typically sits between the 21 EMA and 50 SMA, and all three provide support on pullbacks at similar price levels. When they're tightly clustered together on a pullback, that confluence creates an especially strong support zone. When VWAP and the 21 EMA diverge — with price holding above VWAP but breaking below the 21 EMA, for example — it's a signal to reduce position size rather than add, because the tools are giving mixed readings. Use VWAP as a primary directional filter (price above VWAP = lean long) and the EMA stack as a secondary confirmation layer.
Key Takeaway: VWAP and EMAs work best as complementary signals rather than alternatives. When they agree, conviction is higher; when they diverge, reduce size and wait for clarity.
Is this strategy appropriate for trading index ETFs like SPY and QQQ?
On trend days driven by macroeconomic events — significant economic data releases, central bank actions, or broad market catalysts — SPY and QQQ often produce the cleanest MA stack configurations available. The 9/21/50 setup on a 5-minute chart works reliably on these instruments, with the added benefit that individual stock news can't disrupt the setup mid-trade. The tradeoff is that dollar moves per share are smaller than most individual stock setups, which means you need either larger share counts or a larger account to generate meaningful dollar P&L on the same percentage move.
Key Takeaway: Index ETFs like SPY and QQQ often produce the cleanest MA stack configurations on macro-driven trend days — ideal for traders who prefer smoother price action over the higher volatility (and higher dollar moves) of individual stock setups.
Disclaimer
Article Sources
- Murphy, John J. Technical Analysis of the Financial Markets. New York Institute of Finance, 1999. The foundational reference text for moving average theory, including the mathematical basis for EMA vs. SMA responsiveness differences and the documented behavior of MA systems in trending versus range-bound markets — still the most thorough academic treatment of MA mechanics available.
- Elder, Alexander. Come Into My Trading Room: A Complete Guide to Trading. Wiley, 2002. Covers the Triple Screen trading methodology — the conceptual basis for the multi-timeframe MA approach described in this article, including the principle that longer-timeframe MA direction should govern shorter-timeframe entry signals.
- Available at CrossTrade.io - CrossTrade Research. "Moving Average Crossover: Raw vs. Filtered Performance Analysis." Backtesting analysis demonstrating that raw 9/21 EMA crossover strategies on major futures instruments produce 60-65% losing trades in most market regimes, with the crossover's edge only emerging with regime filters applied — the quantitative basis for this article's central argument about crossover signals.
- Available at QuantifiedStrategies.com - Quantified Strategies. "Trend Following Trading Strategy: Backtested Results." Research documenting that dual moving average trend systems typically achieve win rates in the 35-45% range, relying on asymmetric risk-reward rather than high win rates — the basis for the honest expectations discussion in this article.
- Covel, Michael. Trend Following: How to Make a Fortune in Bull, Bear, and Black Swan Markets. 5th ed., Wiley, 2017. The practitioner case for trend following as a category, including the mathematical logic for why systems with sub-50% win rates can produce long-run profitability through asymmetric average winners — the philosophical framework behind this article's strategy.
- Read at SEC.gov - SEC Office of Investor Education and Advocacy. "Day Trading: Your Dollars at Risk." Regulatory baseline for active trading risk.
Was this helpful?
Be the first to weigh in

Written by
Kazi Mezanur RahmanFounder, independent researcher, and editor of DayTradingToolkit, a one-person publication focused on risk-first trading education, documented tool research, and clear explanations.
Keep Reading

Strategies
The Ultimate Trend Following Strategy Guide
Learn DayTradingToolkit's 5-step trend following strategy. This ultimate guide provides a complete system for riding trends with confidence and maximizing profits.

Strategies
Buying the Dips & Selling the Rips: Mastering Pullback Trading in Trends
Master pullback trading with our framework for identifying high-probability dips in uptrends and rips in downtrends. Entry methods, volume diagnostics, and failure modes.

Strategies
A Trader's Playbook for Trend Days: How to Maximize One-Sided Markets
Learn how to identify trend days before they develop, confirm them with market internals, and trade them without leaving half the move on the table.

Strategies
How to Choose a Day Trading Strategy That Fits Your Personality
The wrong strategy for your personality will fail even if it works on paper. Use our 5-axis framework to match your trading style to a strategy you can actually execute.
Comments
No comments yet. Be the first to share your thoughts.