AskThe ask is the lowest price a seller is currently willing to accept. When you buy with a market order, you pay the ask.Read definition → a room full of momentum traders which Moving AverageA moving average smooths out price data by calculating the average closing price over a set number of periods — it filters out noise and identifies the trend direction, with the stock above the MA interpreted as bullish and below as bearishRead definition → they watch first and the 9 EMA comes up more than almost any other number. It's not magic. It's simply short enough to hug price closely during a real TrendA trend is a sustained directional movement in price over time — an uptrend is characterized by a sequence of higher highs and higher lows, a downtrend by lower highs and lower lows — and correctly identifying the current trend direction isRead definition →, which makes it one of the fastest visual cues available for spotting when a strong stock is offering a low-risk entry rather than chasing an extended move.
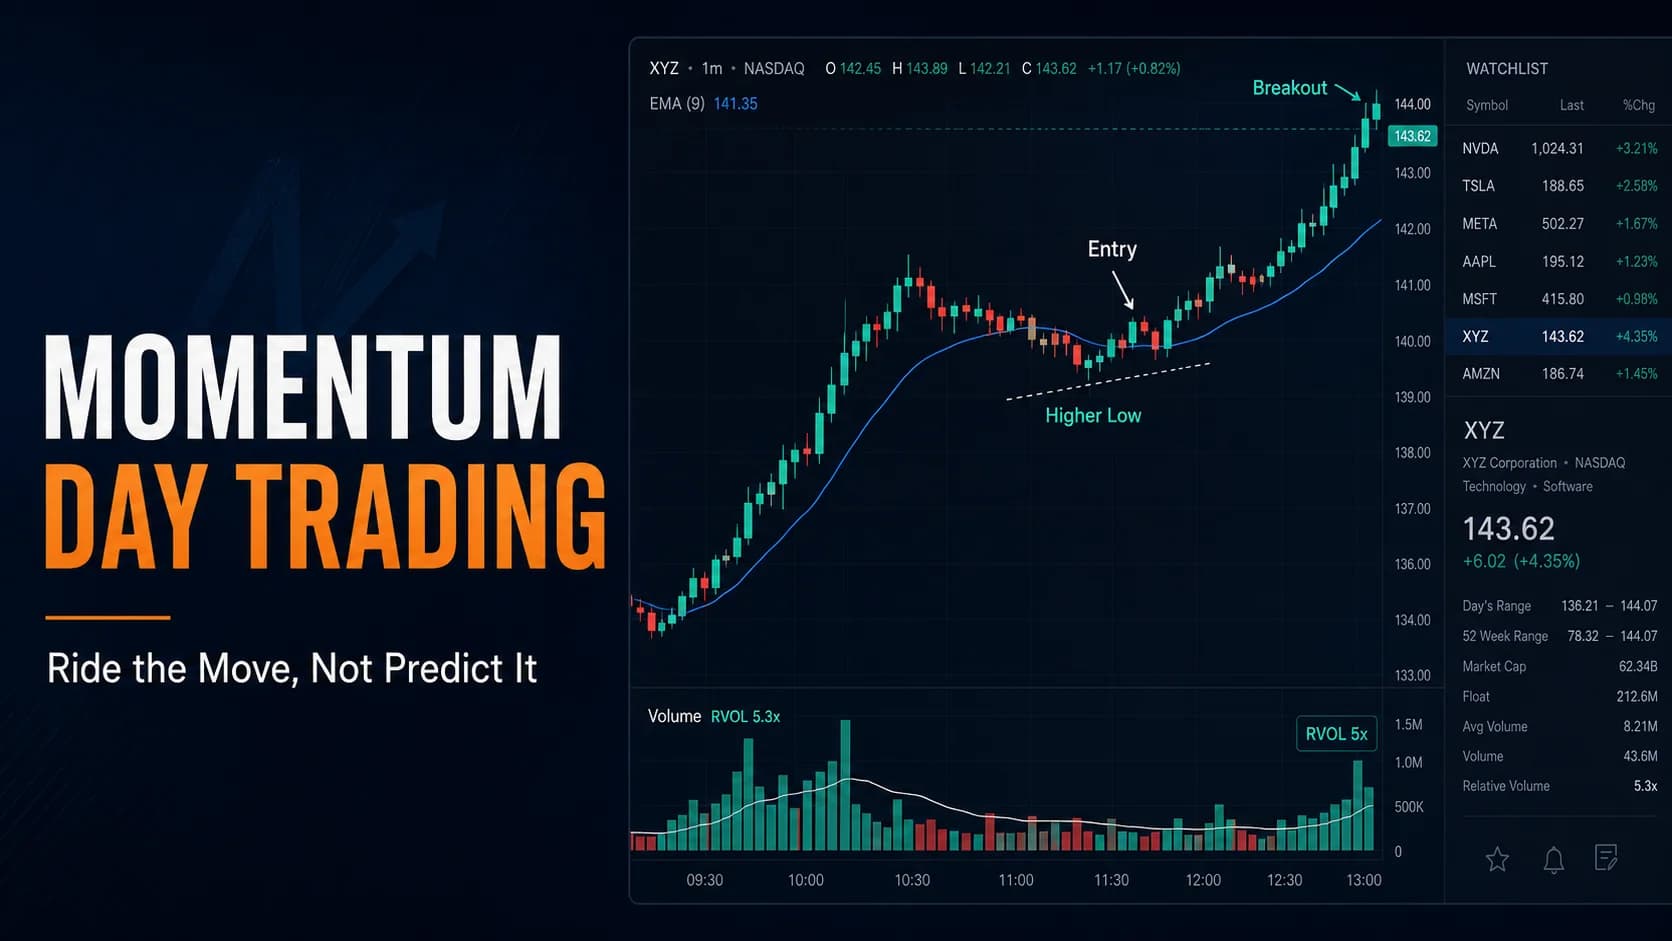
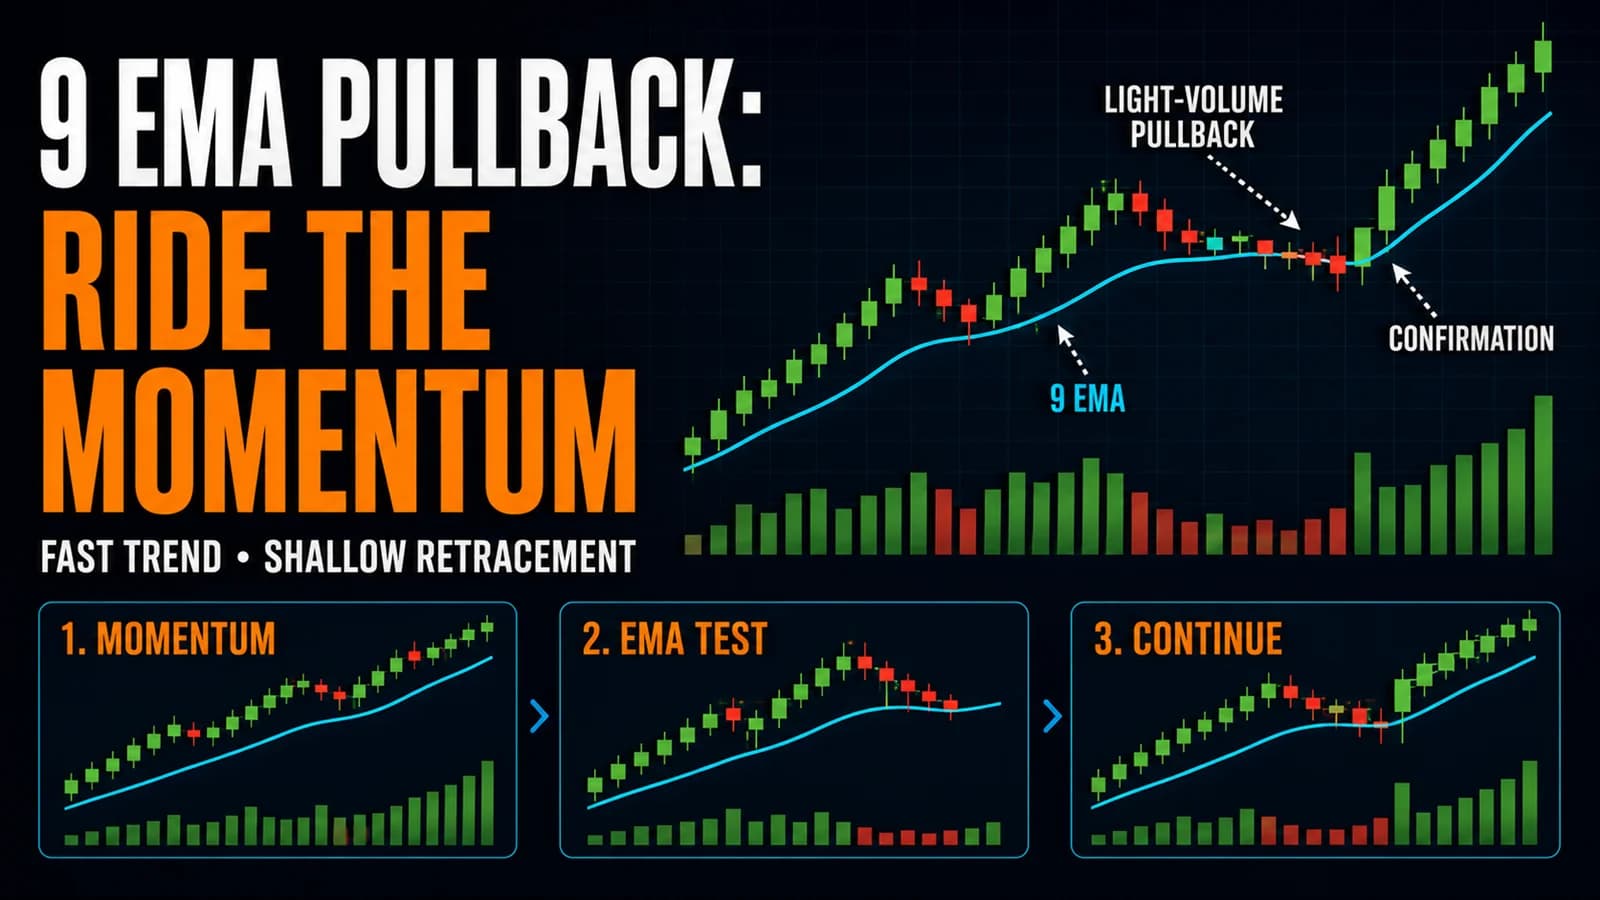
What is the 9 EMA PullbackA pullback is a temporary counter-trend price movement within an established trend — in an uptrend, a pullback is a short-term decline that offers a lower-risk entry point before the trend resumes, as opposed to a reversal which signals theRead definition → strategy? The 9 EMA pullback is a momentum continuation setup where a trader enters when a strongly trending stock retraces to touch its 9-period Exponential Moving AverageAn exponential moving average (EMA) is a moving average that weights recent price data more heavily than older data — making it faster to react to new price movement than a simple moving average of the same length.Read definition → and shows signs of holding, using the EMA as a dynamic, fast-moving support or resistance line rather than waiting for a deeper correction.
Why Nine Periods, and Why It Matters More on Momentum Names
The 9 EMA's popularity in momentum trading comes down to responsiveness. An exponential moving average weights recent prices more heavily than older ones, and a 9-period EMA reacts to new price action noticeably faster than a 20 or 50 period average. On a moving average built from simple or exponential smoothing, that speed is exactly what a fast-moving, trending stock needs: a slower average would sit too far below price during a strong run to ever get tested, while the 9 EMA stays close enough to be genuinely useful as a pullback reference.
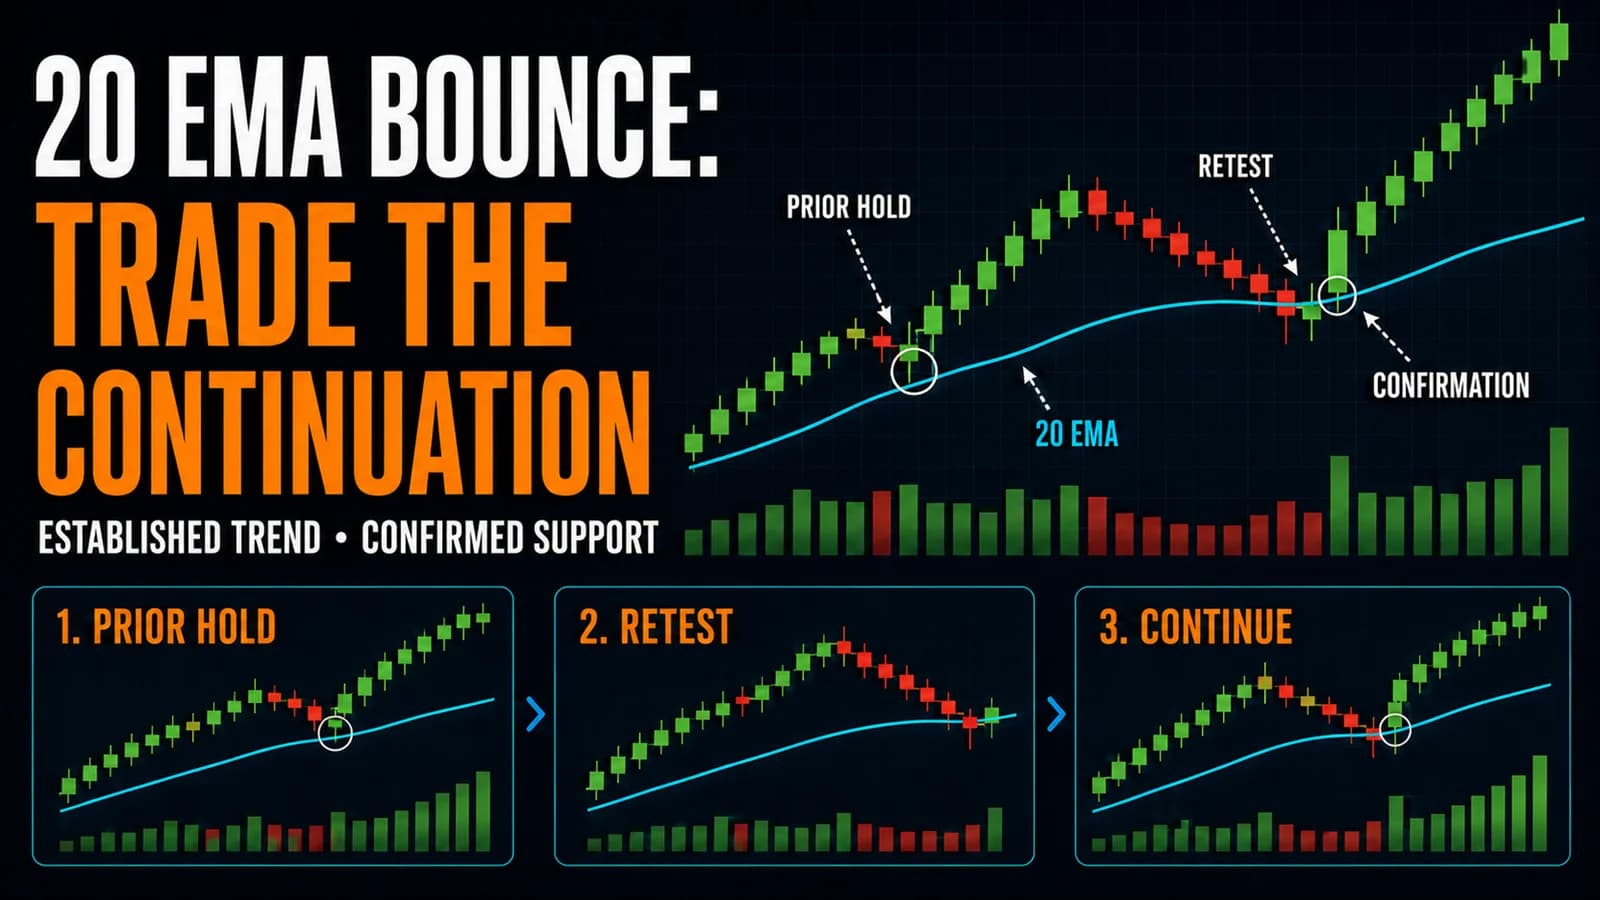
This setup differs meaningfully from the 20 EMA bounce covered elsewhere in this hub, which is built for a somewhat calmer, more established trend. The 9 EMA pullback is the tool for stocks in the middle of an aggressive momentum run, frequently on a 1 or 5 minute chart, where the trend is moving fast enough that a pullback to a slower average would already represent a much larger giveback of profit.
The Conditions That Make a 9 EMA Pullback Worth Trading
This setup requires an actual momentum trend already in motion, not just any stock with a rising average. Look for a stock that has broken out on volume, is making a series of higher highs and higher lows on the chosen intraday timeframe, and has stayed above the 9 EMA through multiple candles without closing below it. A stock that keeps closing below and then above the 9 EMA repeatedly hasn't established the kind of clean trend this setup depends on.
RVOL matters here just as it does for other momentum setups. A pullback to the 9 EMA on volume that's dried up compared to the initial breakout thrust is normal and often healthy. What traders watch for is the reversal candle itself showing renewed volume as price turns back in the trend's direction, which signals that buyers are still actively defending the level rather than the stock simply drifting on inertia.
Setup Specification
- Component
- Market Conditions Required
- Rule
- An established momentum trend with at least two to three prior higher highs and higher lows; the stock should not have closed below the 9 EMA more than once or twice during the current move
- Component
- Time of Day
- Rule
- Most common in the first two hours after the open, when momentum names see their strongest volume and cleanest trends
- Component
- Stock Selection Criteria
- Rule
- RVOL of at least 2x, a clear catalyst (earnings, news, sector momentum), price typically between $2 and $100 depending on the trader's risk tolerance
- Component
- Entry Trigger
- Rule
- Price touches or slightly pierces the 9 EMA on a 1 or 5 minute chart and closes back above it with volume exceeding the prior two candles
- Component
- Stop Loss
- Rule
- Below the low of the pullback candle, or below the most recent swing low if it sits closer to price
- Component
- Initial Profit Target
- Rule
- The prior high of the move, with a trailing approach afterward rather than a single fixed target
- Component
- Trade Management
- Rule
- Continue holding as long as price respects the 9 EMA on each subsequent pullback; exit or trail tighter once a candle closes below it
- Component
- Invalidation Criteria
- Rule
- A full-bodied candle closing meaningfully below the 9 EMA on rising volume, especially if it also breaks the most recent higher low
| Component | Rule |
|---|---|
| Market Conditions Required | An established momentum trend with at least two to three prior higher highs and higher lows; the stock should not have closed below the 9 EMA more than once or twice during the current move |
| Time of Day | Most common in the first two hours after the open, when momentum names see their strongest volume and cleanest trends |
| Stock Selection Criteria | RVOL of at least 2x, a clear catalyst (earnings, news, sector momentum), price typically between $2 and $100 depending on the trader's risk tolerance |
| Entry Trigger | Price touches or slightly pierces the 9 EMA on a 1 or 5 minute chart and closes back above it with volume exceeding the prior two candles |
| Stop Loss | Below the low of the pullback candle, or below the most recent swing low if it sits closer to price |
| Initial Profit Target | The prior high of the move, with a trailing approach afterward rather than a single fixed target |
| Trade Management | Continue holding as long as price respects the 9 EMA on each subsequent pullback; exit or trail tighter once a candle closes below it |
| Invalidation Criteria | A full-bodied candle closing meaningfully below the 9 EMA on rising volume, especially if it also breaks the most recent higher low |
A Narrated Walk-Through
Picture a small-cap technology name, call it XYZ, breaking out from $6.40 to $7.20 in the first 20 minutes after the open on volume 4x its average, driven by a positive analyst note. By 10:05 AM ET, XYZ has continued to $7.55, with the 9 EMA on the 5 minute chart trailing at roughly $7.15.
At 10:18 AM, XYZ pulls back to $7.18, touching the 9 EMA, on a candle with noticeably lighter volume than the breakout thrust. The next candle closes at $7.32, back above the 9 EMA, with volume roughly double the pullback candle's volume, suggesting buyers stepped back in right at the average.
A trader enters at $7.32 with a stop at $7.10, just below the 9 EMA and the pullback low. The initial target is the prior high of $7.55, offering roughly 1:1 reward to risk on the first scale. If XYZ clears $7.55 and continues higher, the trade trails behind the 9 EMA itself on the next pullback, exiting only once a candle closes clearly below it. This illustration uses a hypothetical archetype rather than a real ticker at current prices.
Trailing a Position Along a Fast-Moving Average
The 9 EMA pullback rewards traders willing to stay in a trade through multiple touches rather than exiting at the first target. Because the average moves quickly with price, a strong momentum stock can produce three, four, or more separate pullback-and-continuation cycles in a single session, and traders who scale out fully at the first target often leave the larger portion of the move on the table.
A disciplined approach: scale a portion of the position at the first target, then hold the remainder with a stop trailing just below the 9 EMA, moving the stop up each time the average rises and price confirms another touch and hold. This approach accepts giving back some open profit on each pullback in exchange for staying in the trade through the full length of the trend.
Where This Setup Fails
The most damaging failure mode is trading a 9 EMA pullback on a stock that isn't actually in a clean momentum trend, but instead chopping around the average with no clear higher-high, higher-low structure. On these stocks, price crosses the 9 EMA constantly, and any single crossing carries little predictive value. This setup depends entirely on the trend already existing before the pullback happens.
A second failure mode occurs late in a momentum run, after several successful pullback cycles have already played out. Momentum trends eventually exhaust themselves, and a pullback to the 9 EMA after an extended, multi-hour run carries meaningfully higher failure risk than the same pullback occurring early in a fresh breakout. Traders often reduce size or tighten stops on later touches in the same session rather than treating every pullback as equally strong.
A third failure mode shows up around broader market reversals. A momentum name pulling back to its 9 EMA at the exact moment the overall market (SPY, QQQ) suddenly reverses lower has a much higher chance of a deeper break, since individual momentum names rarely stay fully immune to a sharp change in overall market sentiment.
Adjusting the Setup for Different Timeframes and Directions
The short side works as a mirror image on breakdown momentum: a stock falling hard on bad news that rallies back up to touch the 9 EMA from below and then rolls back over offers a short entry, with the stop placed above the pullback high. Some traders also apply this exact structure on a 1 minute chart for faster scalping, though doing so requires tighter risk control since the noise level on a 1 minute chart is considerably higher than on a 5 minute chart.
Combining the 9 EMA with a slightly longer average, such as the 20 EMA, on the same chart can help distinguish a genuine momentum trend from a choppier one: when both averages are sloping in the same direction and price stays above both, the trend carries more conviction than when price whipsaws around a single fast-moving line.
Tools for Tracking Fast-Moving Momentum Names
Momentum trends built for this setup develop and exhaust themselves quickly, which makes real-time scanning far more useful than manually flipping through charts. A scanner capable of surfacing stocks breaking out on high RVOL with a defined price and float range gives traders a live shortlist of candidates to watch for the first pullback. Trade Ideas includes real-time scanning built around exactly this kind of momentum criteria, along with charting that displays the 9 EMA directly for quick visual confirmation once a candidate is identified.
Fitting the 9 EMA Pullback Into a Broader Plan
This setup is a tool for traders already comfortable identifying momentum stocks and reading real-time volume, rather than a starting point for someone still learning basic chart structure. It pairs naturally with a broader momentum trading approach, where the 9 EMA pullback becomes the specific, lower-risk entry mechanism once a promising momentum candidate has already been identified through other means.
FAQ
Why use the 9 EMA specifically instead of the 8 or 10 EMA that some platforms default to?
The difference between an 8, 9, or 10 period EMA on any given chart is usually a matter of a few cents, not a meaningfully different signal. What matters more is that a trader consistently uses the same fast EMA across sessions so pattern recognition builds correctly over time, rather than second-guessing the exact period on a trade-by-trade basis.
Key Takeaway: The specific period (8, 9, or 10) matters less than picking one and applying it consistently.
How is the 9 EMA pullback different from the bull flag pattern?
A stock can pull back to the 9 EMA in a shape that looks nothing like a clean flag, perhaps a single sharp dip rather than a gradual, orderly consolidation, and still qualify for this setup. Conversely, a bull flag can form well above or below the 9 EMA entirely. The two setups often overlap in practice but are defined by different criteria.
Key Takeaway: A 9 EMA pullback is defined by the moving average interaction, not by the visual flag shape a bull flag requires.
What timeframe works best for the 9 EMA pullback strategy?
A 1 minute chart reacts faster but generates far more noise, producing pullback signals that reverse within seconds and don't hold up as tradeable setups. A 15 minute chart smooths things out further but can lag so much that the entry comes well after the ideal risk-to-reward point has passed. The 5 minute chart tends to be the sweet spot most momentum traders settle on for this specific setup.
Key Takeaway: The 5 minute chart offers the most practical balance of speed and signal quality for this setup.
How many pullbacks to the 9 EMA can a single momentum trend produce?
Early pullbacks in a fresh, high-volume breakout tend to be the highest-quality entries, since the move is new and interest is still building. By the fourth or fifth touch, more traders have identified the pattern and the stock may be approaching exhaustion, which is why later touches often warrant smaller size or tighter profit targets.
Key Takeaway: Expect diminishing odds with each successive pullback in the same trend; treat later touches with more caution.
Does the 9 EMA pullback strategy work on low-float momentum stocks?
Low-float stocks can swing violently in both directions, meaning a "pullback" to the 9 EMA might overshoot significantly before reversing. Traders working these names typically need to accept a wider stop as a percentage of the stock's price or reduce position size to compensate for that added volatility, rather than applying the same tight risk parameters used on higher-float stocks.
Key Takeaway: Low-float names need wider stops or smaller size to account for their more volatile pullback behavior.
Should a trader wait for the candle to close above the 9 EMA, or enter as soon as price touches it?
Price frequently pierces a fast-moving average like the 9 EMA briefly before continuing its move, whether that move ultimately continues the trend or breaks it. A candle that closes back above the average, rather than one that merely wicks down to it, provides real confirmation that buyers defended the level before the trade is entered.
Key Takeaway: Wait for the candle close, not just an intraday touch, before treating the pullback as confirmed.
Can the 9 EMA pullback be combined with VWAP for extra confirmation?
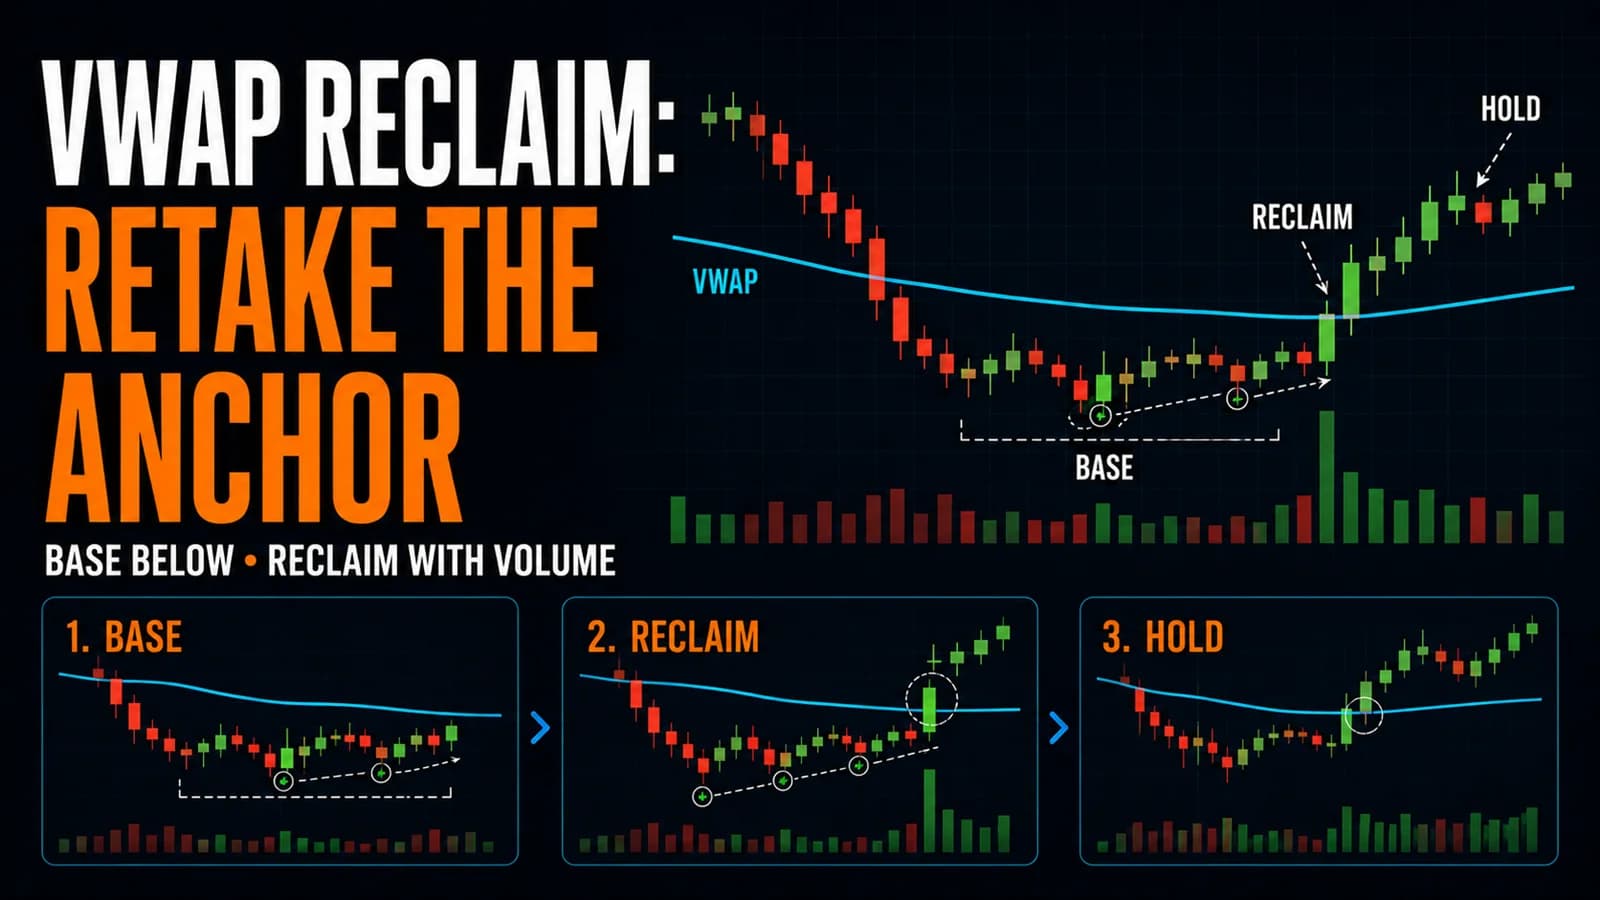
When the 9 EMA and VWAP converge at roughly the same price, a pullback that holds both levels simultaneously demonstrates two independent forms of support agreeing at once. This confluence doesn't happen on every setup, but when it does occur, it's generally treated as a higher-conviction entry than a 9 EMA touch occurring far away from VWAP.
Key Takeaway: A 9 EMA pullback that coincides with VWAP support carries more weight than either signal in isolation.
Is the 9 EMA pullback appropriate for a beginner trader?
The setup depends on quickly recognizing genuine momentum trend structure and distinguishing it from choppy price action, a skill that typically develops through screen time on simpler setups first. A beginner attempting this strategy without that foundation is more likely to mistake random price movement for a trend and enter on noise rather than a genuine signal.
Key Takeaway: Build core moving average and volume-reading skills first; this setup works best as a next step rather than a starting point.
Disclaimer
Article Sources
- StockCharts ChartSchool: Moving Averages, Simple and Exponential - Explains the calculation differences between simple and exponential moving averages referenced in this setup.chartschool.stockcharts.com
- StockCharts ChartSchool: Arthur Hill on Moving Average Crossovers - Background on how moving average crossovers are interpreted as trading signals.chartschool.stockcharts.com
- CFA Institute: Technical Analysis for Investment Professionals - Professional-level context on the use of moving averages within broader technical analysis frameworks.cfainstitute.org
- FINRA: Day Trading Risk Disclosure - Regulatory guidance on the risks inherent in short-term, intraday strategies.finra.org