
The Bull Flag Trading Strategy: Anatomy, Entry, and Failure Modes

In this article13 sections
Ask five different trading forums what a bull flag's average return is, and at least three will say something close to 69%. That number is real. It's also almost never describing the pattern most traders think they're looking at, and the researcher who produced it has since revised it down hard. Getting the anatomy of a bull flag right matters less than most guides suggest. Getting the actual numbers right matters far more.
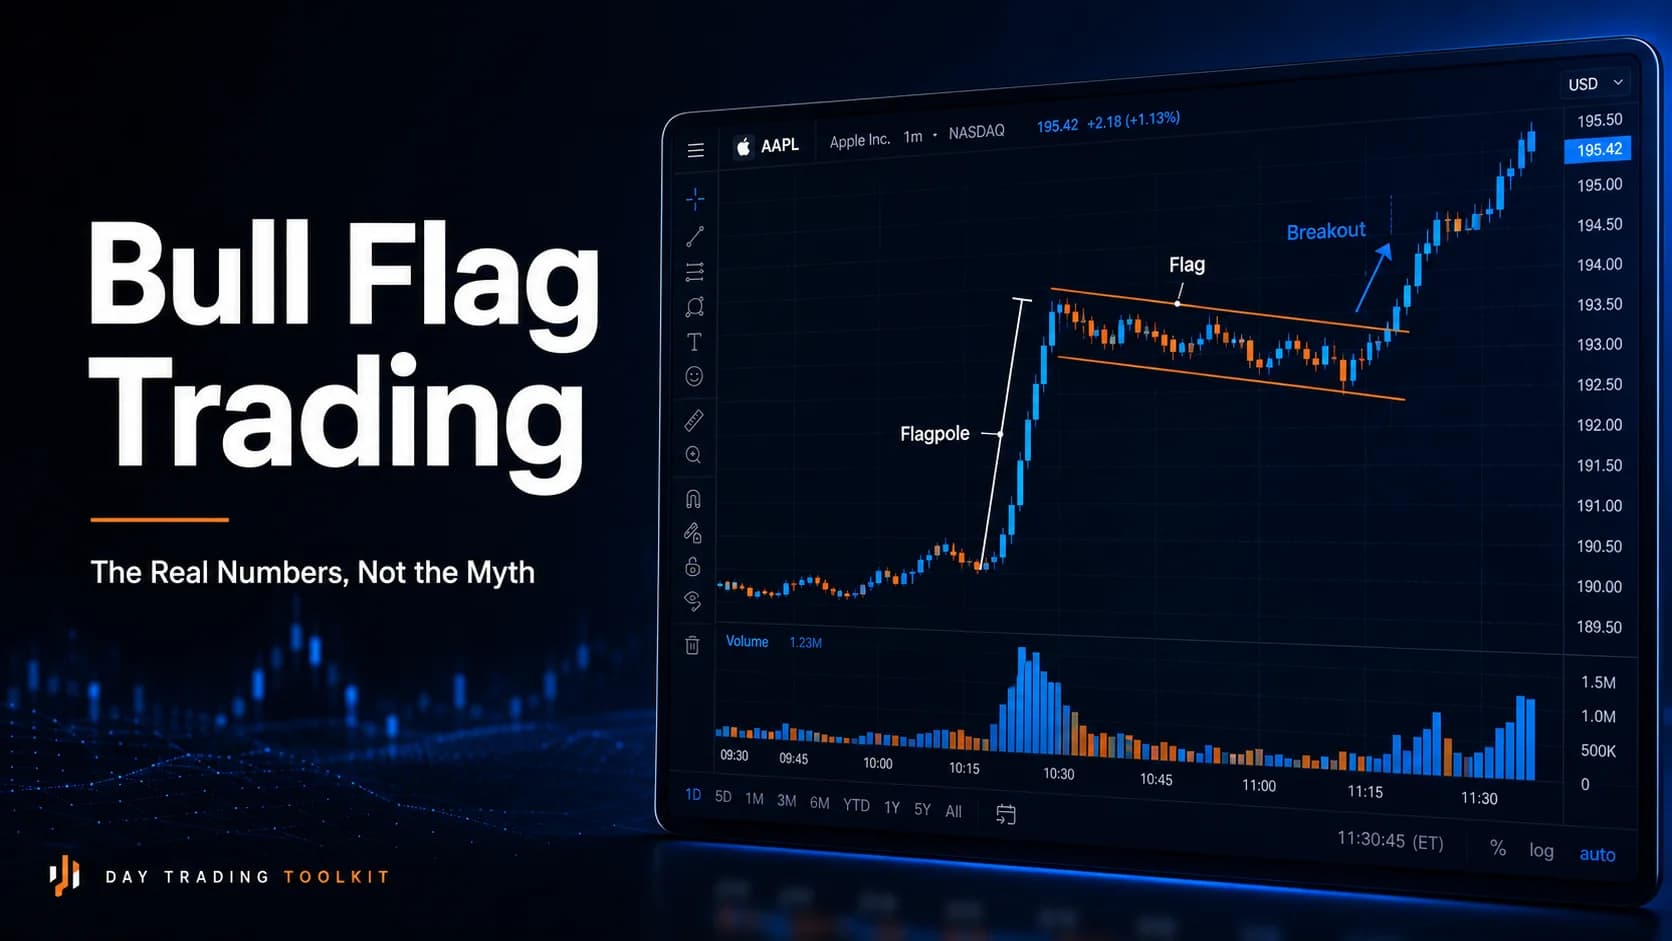
What is a bull flag? A bull flag is a chart pattern that forms when a stock makes a sharp, steep rally (the flagpole), then pauses in a tight, short consolidation that drifts slightly against the prior trend (the flag), before breaking out and continuing in the original direction. It signals a brief pause in buying pressure, not necessarily a reversal.
Not Every Consolidation Is a Flag: Anatomy and Identification
A genuine flag has a specific shape, and chart-pattern researcher Thomas Bulkowski's identification criteria are worth using as the actual standard rather than a loose, "looks kind of like a flag" impression. The flagpole itself needs to be steep and near-vertical; without a genuine sharp move preceding it, there's no flagpole and therefore no flag. The flag portion, the consolidation itself, needs to stay short, under roughly three weeks on a daily chart, and it needs to trade between two roughly parallel trendlines, tilted against the direction of the flagpole. A bull flag's pole rises, and the flag itself drifts sideways to slightly down.
Volume is part of the identification, not just the entry trigger. In Bulkowski's data, volume trended downward during the flag itself in 74% of patterns that went on to break out upward. A flag forming on rising or erratic volume is a weaker, less reliable version of the pattern than one forming on genuinely fading volume, and that volume signature deserves as much attention as the shape on the chart.
Bulkowski's research also found that tight flags, where price stays close to the trendlines with minimal overlap or stray bars outside the channel, meaningfully outperform loose ones, where price meanders, pokes outside the boundary, or looks jagged. A sloppy consolidation that technically fits inside two lines drawn loosely enough isn't the same setup as a genuinely tight one, and this guide treats tightness as a real selection filter, not a cosmetic preference.
The Psychology of a Flag: Why a Rally Pauses This Way
A flag's shape reflects a specific, fairly intuitive tug of war. The flagpole represents a burst of aggressive buying, often triggered by a catalyst, a breakout, or a sudden shift in sentiment, that pushes price up quickly. Once that initial burst runs its course, two groups are left holding opposite positions: early buyers who are sitting on quick gains and start taking some profit, and traders who missed the initial move and are waiting for a pullback to get in.
That combination produces exactly the flag's tilt: mild, controlled selling from profit-takers, absorbed by fresh buying from traders waiting on the sidelines, in a range too narrow and too orderly to represent genuine distribution. The declining volume during the flag is the fingerprint of that dynamic. If sellers were taking control rather than simply locking in gains, volume during the pullback would typically expand, not fade, as new sellers joined in. A flag that behaves this way, a brief pause with fading participation rather than a fight, is showing the psychology of a market catching its breath, not reversing.
The Real Numbers Behind Bull Flags (Not the 69% You've Heard)
Here's where most retail content on this pattern goes wrong, and it's worth correcting directly. Bulkowski's own statistics for the standard flag pattern, updated in 2020 from an automated study of hundreds of qualifying trades, show a 44% break-even failure rate for upward breakouts, meaning 44% of flags failed to even produce a 5% move after the breakout. The average rise across all of them was 9%.
That 9% figure looks unimpressive next to other patterns in Bulkowski's database that average 30% to 40%, and the reason is methodological, not a sign the pattern is weak. Flag performance is measured from the breakout to the end of the short-term price swing that follows it, not to the pattern's ultimate high the way most other chart patterns are scored. Comparing a flag's 9% directly against another pattern's 38% is comparing two different kinds of measurements, not two comparably-scaled outcomes. Bulkowski's data doesn't assign flags an overall performance rank for exactly this reason.
None of this means the pattern is unreliable. About 46% of flags with upward breakouts met their measured price target, and roughly 60% of flags break out upward in the first place. It does mean the specific "69% average rise" figure that circulates constantly in retail trading content isn't describing this pattern at all.
The High and Tight Flag: A Rarer Pattern With Its Own Revised Numbers
That 69% number belongs to a different, much rarer pattern: the high and tight flag, a specific sub-type requiring a stock to rise at least 90% in under two calendar months before forming the flag portion. Bulkowski's original research, based on 307 hand-selected patterns from his book, found a 69% average rise with none of those patterns failing to climb at least 5%. That's the source of the statistic most traders quote when they talk about flags generally.
Bulkowski later revisited the high and tight flag with a much larger, automated study spanning 1,018 stocks and 2,588 non-overlapping patterns. He was direct about the result: performance wasn't nearly as strong as the original figures suggested, and the pattern ranked 43rd out of 56 patterns in his broader database, far from the best performer it was once considered. Of the patterns studied, 14% failed to break out upward at all, and of those that did break out, 19% failed to climb even 5%, for a combined failure rate around 33%.
The practical takeaway is twofold. First, an ordinary bull flag and a high and tight flag are genuinely different patterns with genuinely different qualifying criteria, a 90%-in-under-two-months threshold is a demanding, uncommon bar that most flags a trader sees intraday won't come close to meeting. Second, even the rarer, historically stronger version has since been shown, by the same researcher who produced the original number, to perform meaningfully worse in a larger sample. Neither pattern is the guaranteed 69% mover that gets repeated across trading content with the original, smaller study cited as though it were the final word.

Why Daily-Chart Statistics Don't Translate Directly to a 5-Minute Chart
One more honest caveat belongs here before the setup mechanics. All of the statistics above come from daily-bar charts and multi-day-to-multi-week holding periods. No comparably large, rigorous study exists measuring bull flag performance specifically on intraday timeframes, on a 1-minute or 5-minute chart, over a same-day holding period.
That doesn't make the pattern untradeable intraday; the underlying logic, a sharp move followed by a brief, orderly, low-volume pause before continuation, is a structural description of order flow that reasonably applies across timeframes. What doesn't transfer directly is the specific percentage numbers above. A 9% average rise measured on daily bars over a multi-week swing isn't a claim about what an intraday flag on a 5-minute chart will return over the next twenty minutes, and this guide won't imply otherwise. Track results against this setup's own invalidation criteria on the timeframe actually being traded, rather than importing a daily-chart statistic as an intraday performance expectation.
The Bull Flag Setup Specification
Every component below adapts Bulkowski's identification criteria to an intraday chart.
- Component
- Market Conditions Required
- Rule
- A genuinely steep, near-vertical flagpole on above-average volume; broad market not fighting the direction of the move.
- Component
- Time of Day
- Rule
- Most reliable during the 9:45 AM to 3:30 PM ET window, after the initial open-driven volatility settles and before the closing period; flags forming in the first 15 minutes carry less information.
- Component
- Stock Selection Criteria
- Rule
- A real, identifiable catalyst or momentum burst behind the flagpole; sufficient relative volume on the pole itself to distinguish it from routine noise.
- Component
- Entry Trigger
- Rule
- A break above the flag's upper trendline (or the high of the most recent consolidation bar) on renewed volume, not a break on the same fading volume that defined the flag itself.
- Component
- Stop Loss
- Rule
- Below the low of the flag's consolidation range, or below the most recent higher low inside the flag for a tighter version.
- Component
- Initial Profit Target
- Rule
- The height of the flagpole, measured from its start to its top, projected upward from the breakout point, consistent with Bulkowski's measure-rule approach.
- Component
- Trade Management
- Rule
- Scale a portion at the measured target, trail the remainder if volume stays elevated and the stock continues making higher lows.
- Component
- Invalidation Criteria
- Rule
- Price closes back below the flag's lower trendline, the flag widens or turns loose and jagged rather than staying tight, or the breakout occurs on volume no higher than the fading volume seen during the flag itself.
| Component | Rule |
|---|---|
| Market Conditions Required | A genuinely steep, near-vertical flagpole on above-average volume; broad market not fighting the direction of the move. |
| Time of Day | Most reliable during the 9:45 AM to 3:30 PM ET window, after the initial open-driven volatility settles and before the closing period; flags forming in the first 15 minutes carry less information. |
| Stock Selection Criteria | A real, identifiable catalyst or momentum burst behind the flagpole; sufficient relative volume on the pole itself to distinguish it from routine noise. |
| Entry Trigger | A break above the flag's upper trendline (or the high of the most recent consolidation bar) on renewed volume, not a break on the same fading volume that defined the flag itself. |
| Stop Loss | Below the low of the flag's consolidation range, or below the most recent higher low inside the flag for a tighter version. |
| Initial Profit Target | The height of the flagpole, measured from its start to its top, projected upward from the breakout point, consistent with Bulkowski's measure-rule approach. |
| Trade Management | Scale a portion at the measured target, trail the remainder if volume stays elevated and the stock continues making higher lows. |
| Invalidation Criteria | Price closes back below the flag's lower trendline, the flag widens or turns loose and jagged rather than staying tight, or the breakout occurs on volume no higher than the fading volume seen during the flag itself. |
The volume requirement in both the entry trigger and invalidation criteria isn't optional detail. A flag that breaks out on the same thin volume that characterized the pause is showing exactly the signature Bulkowski's research associates with weaker, less reliable performance, regardless of how clean the shape looks.
A Walkthrough: Trading a Bull Flag on a Hypothetical Intraday Chart
Consider a hypothetical stock, ticker WKR, to show the mechanics on an intraday chart. None of the prices or times below describe an actual company.
WKR trades around $22.00 through the first hour of the session. At 10:05 AM ET, on a fresh volume surge running roughly five times its average pace, WKR rips from $22.10 to $23.80 in under six minutes, forming a steep, near-vertical flagpole. Over the following twelve minutes, WKR drifts back in a tight range between $23.55 and $23.75, printing small-bodied bars that stay inside two narrow, roughly parallel lines tilted slightly downward, while volume steadily fades back toward its normal baseline.
At 10:24 AM, WKR breaks above $23.75, the flag's upper boundary, on a fresh pickup in volume running about three times the pace seen during the quiet consolidation. That break is the entry trigger. A stop goes in just below $23.55, the low of the flag's range.
The flagpole measured $1.70 ($22.10 to $23.80), so the measured target from the $23.75 breakout point projects to roughly $25.45. WKR reaches $24.60 by 10:40 AM, where a portion of the position is scaled off, with the remainder trailing behind the developing higher lows. WKR continues to $25.30 by 11:05 AM before volume tapers and the stock stalls, and the remaining position closes near $25.15, just short of the full measured target but capturing the bulk of the move that followed genuine, volume-confirmed continuation.
Managing the Trade Once the Flag Breaks
The measured target from the flagpole's height is a reference point, not a mechanical exit order. Genuine continuation, consistent with the volume-driven logic behind this pattern, keeps making higher lows on sustained participation; a stock that reaches the target and keeps that structure intact is showing no particular reason to exit early just because a projected number has been hit.
The clearer signal to tighten up or exit is volume fading back toward normal without fresh highs forming, the same signature that defines the invalidation criteria above. A breakout that runs hard for a few minutes and then goes quiet on declining volume is behaving like a flag that's already given what it had to give, regardless of whether the measured target has technically been reached yet.
Where This Strategy Fails: Loose Flags and Flagpoles With No Fuel Left
The most common failure is trading a loose, jagged consolidation as though it were a tight flag. Bulkowski's data specifically found tight flags outperform loose ones, and a sloppy sideways drift that happens to sit between two generously-drawn trendlines doesn't carry the same reliability as a genuinely tight, orderly pause.
A second failure is a flagpole with nothing real behind it, a fast move on thin volume, or one driven by a single large order rather than genuine broad participation. A steep price move on unremarkable volume is a weaker foundation for the entire pattern than a move confirmed by a real volume surge, since the flag's whole premise depends on a burst of real buying pressure needing a pause, not a proxy for one.
A third is breaking out on the same fading volume that defined the flag itself. A price break with no accompanying pickup in participation is a weak, unconfirmed signal, closer to a drift through a level than a genuine resumption of the earlier momentum, and it's exactly the situation this setup's invalidation criteria are built to filter out.
A fourth, more structural failure is applying daily-chart statistics as though they were guarantees on an intraday timeframe. As covered above, no large, dedicated intraday study exists for this pattern specifically, and treating Bulkowski's 9% average or 44% failure rate as a direct prediction for a 5-minute chart setup misapplies research that was never measuring that timeframe in the first place.
The Bear Flag and Other Adaptations
The identical logic applies in reverse for a bear flag: a sharp decline (the flagpole) followed by a tight consolidation that drifts slightly upward against the prior trend (the flag), before breaking down and continuing lower. Bulkowski's data shows a comparable break-even failure rate on the downside, around 45%, with an average decline around 8%, close to the mirror image of the bull flag's numbers.
Flag tilt matters more than it might seem. Bulkowski's research found the best-performing bull flags are the ones that tilt downward against an upward flagpole, the classic, textbook shape. A flag that drifts sideways with no real tilt, or one that tilts in the same direction as the flagpole rather than against it, is a weaker, less textbook version of the pattern and deserves correspondingly less confidence.
This setup pairs naturally with the volatility contraction pattern covered elsewhere on this hub, which describes a related but distinct staged-contraction sequence rather than a single flagpole-and-flag structure; a flag is a simpler, faster version of the same underlying idea that price sometimes needs to compress before it can extend further.
Scanning for Fresh Flags Before the Breakout
Spotting a genuine flagpole as it happens, then watching for the specific volume-fade signature that defines a real flag rather than random chop, is difficult to do manually across a large watchlist in real time.
Trade Ideas works as a comprehensive scanning and research platform for this job, surfacing stocks making sharp, high-volume moves in real time and providing the built-in charting needed to watch whether the pause that follows actually tightens up on fading volume the way a genuine flag should. The scan surfaces candidates with a real flagpole already in progress; confirming the tight, volume-fading consolidation and the entry trigger above still governs whether a position gets taken.
Fitting the Bull Flag Into a Complete Trading Plan
This setup assumes familiarity with chart pattern basics and reading volume, since so much of what separates a genuine flag from a random pause depends on volume behavior rather than shape alone. It also assumes the general breakout confirmation checklist covered elsewhere on this hub, applied specifically to the flag's upper trendline as the level being broken.
The psychological trap specific to this setup is entering during the flag itself, before the actual breakout, out of impatience or a fear the move will continue without a clean entry. This guide's coverage of FOMO in trading applies directly: a flag that's still consolidating hasn't confirmed anything yet, and entering early trades a guess about the breakout for the actual, volume-confirmed signal the setup is built around. This strategy belongs on the Strategies Hub as the opening entry in this hub's chart pattern library, and the volume-first discipline covered here, treating shape as necessary but not sufficient, applies to the pattern-based setups that follow it.
Common Questions About Trading Bull Flags
Is the "69% average rise" statistic for bull flags actually accurate?
Bulkowski's data for standard flags shows a 9% average rise and a 44% break-even failure rate, measured differently than most other chart patterns. The 69% figure also predates a later, larger study of the high and tight flag specifically, which found meaningfully weaker performance than the original number suggested.
Key Takeaway: The 69% statistic belongs to a different, rarer pattern, and even that number has since been revised down substantially.
Why does the average rise for a regular flag look so much smaller than other chart patterns?
Comparing a flag's 9% average directly against a 30% or 40% average for a different pattern type is comparing two different measurement methods, not two comparably-scaled outcomes.
Key Takeaway: The smaller number reflects how flags are measured, not a weaker pattern.
What's the actual difference between a bull flag and a high and tight flag?
Most flags a trader encounters intraday won't come close to qualifying as a high and tight flag under that stricter definition, which is part of why applying the high and tight flag's statistics to an ordinary flag overstates what the research actually supports.
Key Takeaway: Confirm which specific pattern is actually present before applying either set of statistics.
Why does volume need to decline during the flag itself?
A flag forming on rising or erratic volume is showing a different, less reliable dynamic, closer to genuine distribution than a brief pause, and deserves less confidence as a continuation setup.
Key Takeaway: Fading volume during the pause is part of the pattern's definition, not just a nice-to-have detail.
Do these statistics apply directly to a bull flag on a 5-minute intraday chart?
The structural logic, a sharp move followed by an orderly, low-volume pause before continuation, reasonably applies across timeframes, but the specific percentage figures shouldn't be treated as a prediction for what happens on a same-day intraday chart.
Key Takeaway: Trust the pattern's logic across timeframes; don't import the daily-chart numbers as an intraday guarantee.
How is the profit target calculated for a bull flag?
This keeps the target grounded in the specific move that created the pattern rather than an arbitrary round number, though it functions as a reference point for scaling out rather than a mechanical, must-exit level.
Key Takeaway: Use the flagpole's own height as the basis for the target, not a fixed percentage or arbitrary level.
What makes a flag "loose" instead of "tight," and why does it matter?
Bulkowski's research found tight flags meaningfully outperform loose ones, which makes tightness a real selection filter rather than a cosmetic preference when deciding whether a consolidation actually qualifies as a tradeable flag.
Key Takeaway: A sloppy sideways drift that technically fits between two loosely-drawn lines isn't the same setup as a genuinely tight flag.
Does a bull flag work the same way for shorting a bear flag?
Bulkowski's data shows comparable numbers on the downside, an average decline around 8% and a break-even failure rate around 45%, close to the bull flag's mirror image.
Key Takeaway: The bear flag isn't a separate concept, just the same pattern applied to a decline instead of a rally.
How does flag tilt direction affect performance?
This is a genuine selection criterion, not just a visual detail, and a flag that doesn't show the expected counter-trend tilt deserves less confidence than one that matches the pattern's documented best-performing shape.
Key Takeaway: The counter-trend tilt isn't cosmetic; it's part of what the data associates with stronger performance.
What tool or filter would help find a fresh flagpole as it's forming?
Trade Ideas, covered earlier in this guide, handles this specific job, flagging strong intraday movers as they happen and providing the charting needed to watch whether the pause that follows actually tightens into a real flag.
Key Takeaway: The scan finds the flagpole; watching the pause develop with the right volume signature still confirms the flag itself.
Disclaimer
Article Sources
- Flags, ThePatternSite.com - the primary source for standard flag identification criteria and performance statistics, including the 9% average rise and 44% break-even failure rate
- High and Tight Flag Study, ThePatternSite.com - the updated, larger-sample study revising the high and tight flag's original 69% average rise figure down to a 43rd-of-56 performance ranking
- High and Tight Flag Example, ThePatternSite.com - documents the original 69% average rise and 0% failure rate from the smaller, book-based study most commonly quoted in retail trading content
Was this helpful?
Be the first to weigh in

Written by
Kazi Mezanur RahmanFounder, independent researcher, and editor of DayTradingToolkit. A one-person publication focused on risk-first trading education and documented tool research. He trades his own capital as a retail trader and combines personal market experience with systematic primary-source research.
Keep Reading

Strategies
Trading Breakouts From Consolidation: The Volatility Contraction Pattern
The VCP isn't just a volatility squeeze. This guide covers the staged contraction sequence, the pivot point, and why context matters as much as the pattern.
Strategies
The Double Top / Double Bottom Trading Strategy
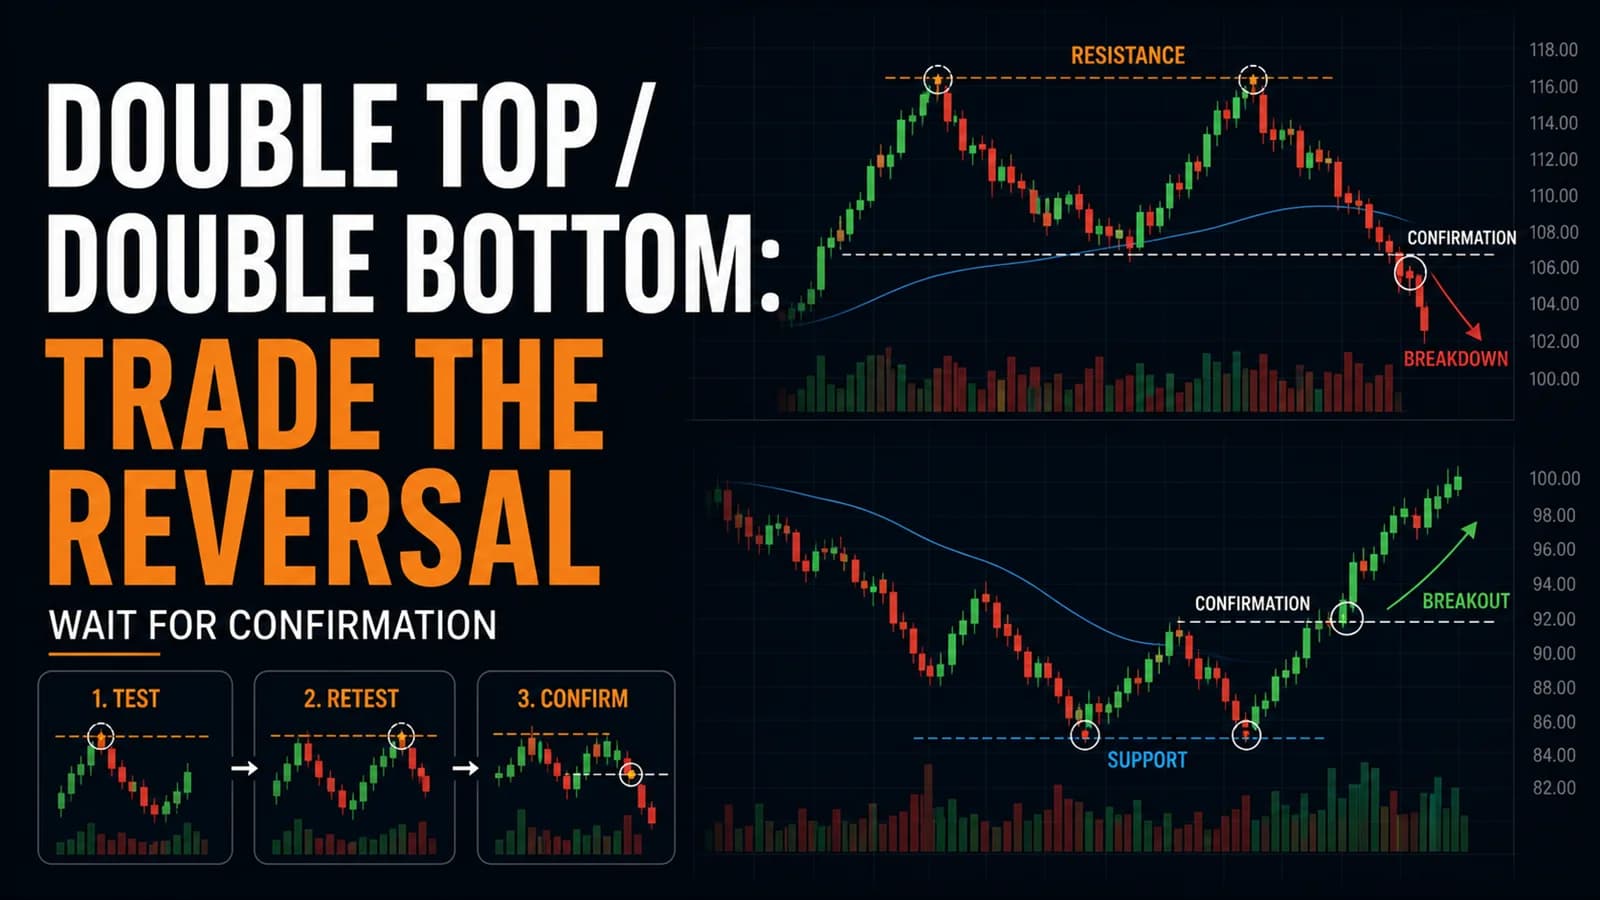
Most double tops never confirm. Here's the confirmation line that separates a real reversal from two random peaks, plus the honest failure rate behind each.
Strategies
The ABCD Pattern Trading Strategy: A Beginner-Friendly Setup
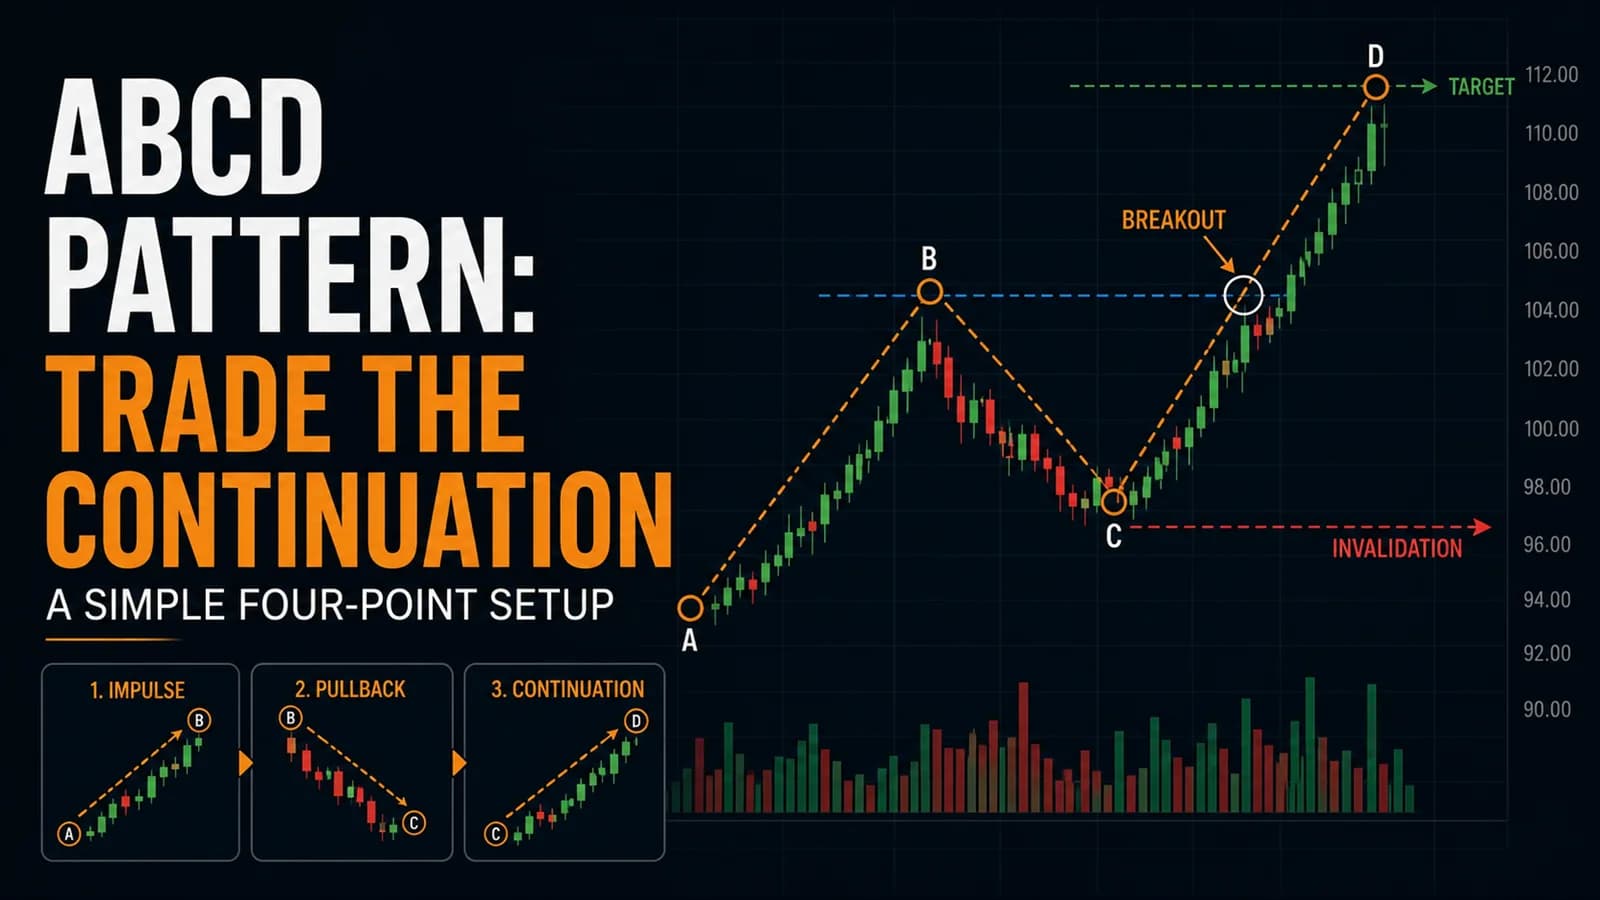
The ABCD pattern turns a messy pullback into a measured price target. Here's the mechanical version day traders actually use, including where it breaks down.
Strategies
The Head and Shoulders Trading Strategy (And Inverse H&S)
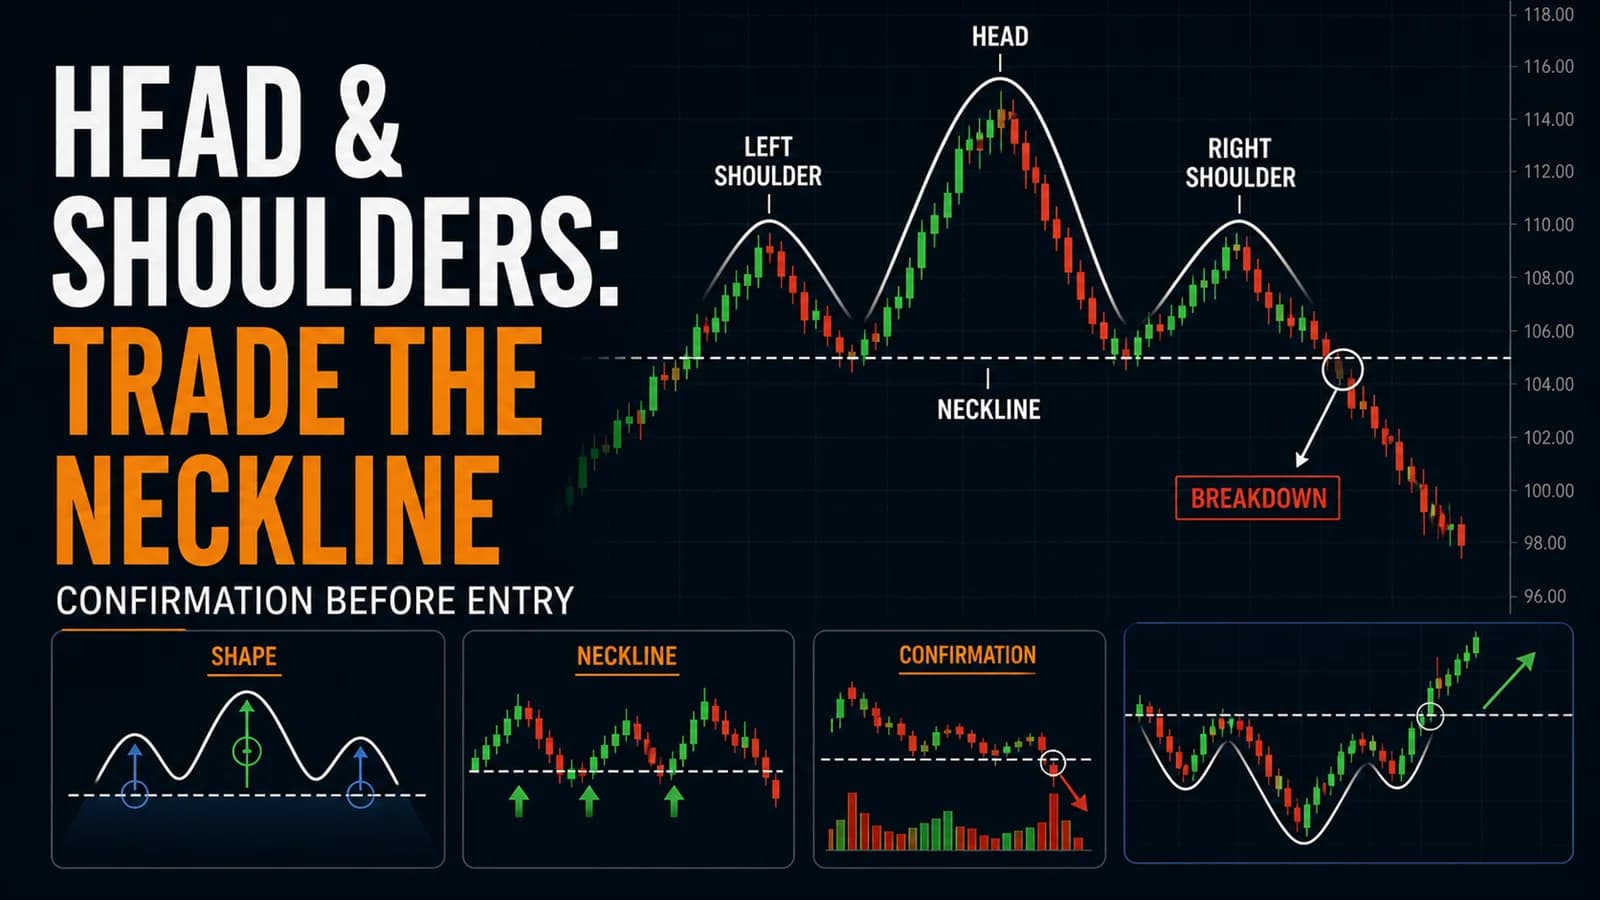
The most famous reversal pattern in trading is also one of the most misdiagnosed. Here's how to actually confirm it before the neckline breaks.
Comments
No comments yet. Be the first to share your thoughts.