
The ABCD Pattern Trading Strategy: A Beginner-Friendly Setup

In this article10 sections
A stock rallies from $11.20 to $12.80 in fifteen minutes on a news catalyst, then spends the next twenty minutes drifting back down to $12.10 on shrinking volume. A trader who only reacts to the chart's shape sees noise. A trader who has labeled the move A, B, and C already knows where D is supposed to be, and is watching $12.80 for the trigger that confirms it.
That's the entire appeal of the ABCD pattern: it converts a normal impulse-pullback-continuation sequence into four labeled points and a measurable target, so the decision to enter isn't a guess about "does this look strong enough." It's a level.
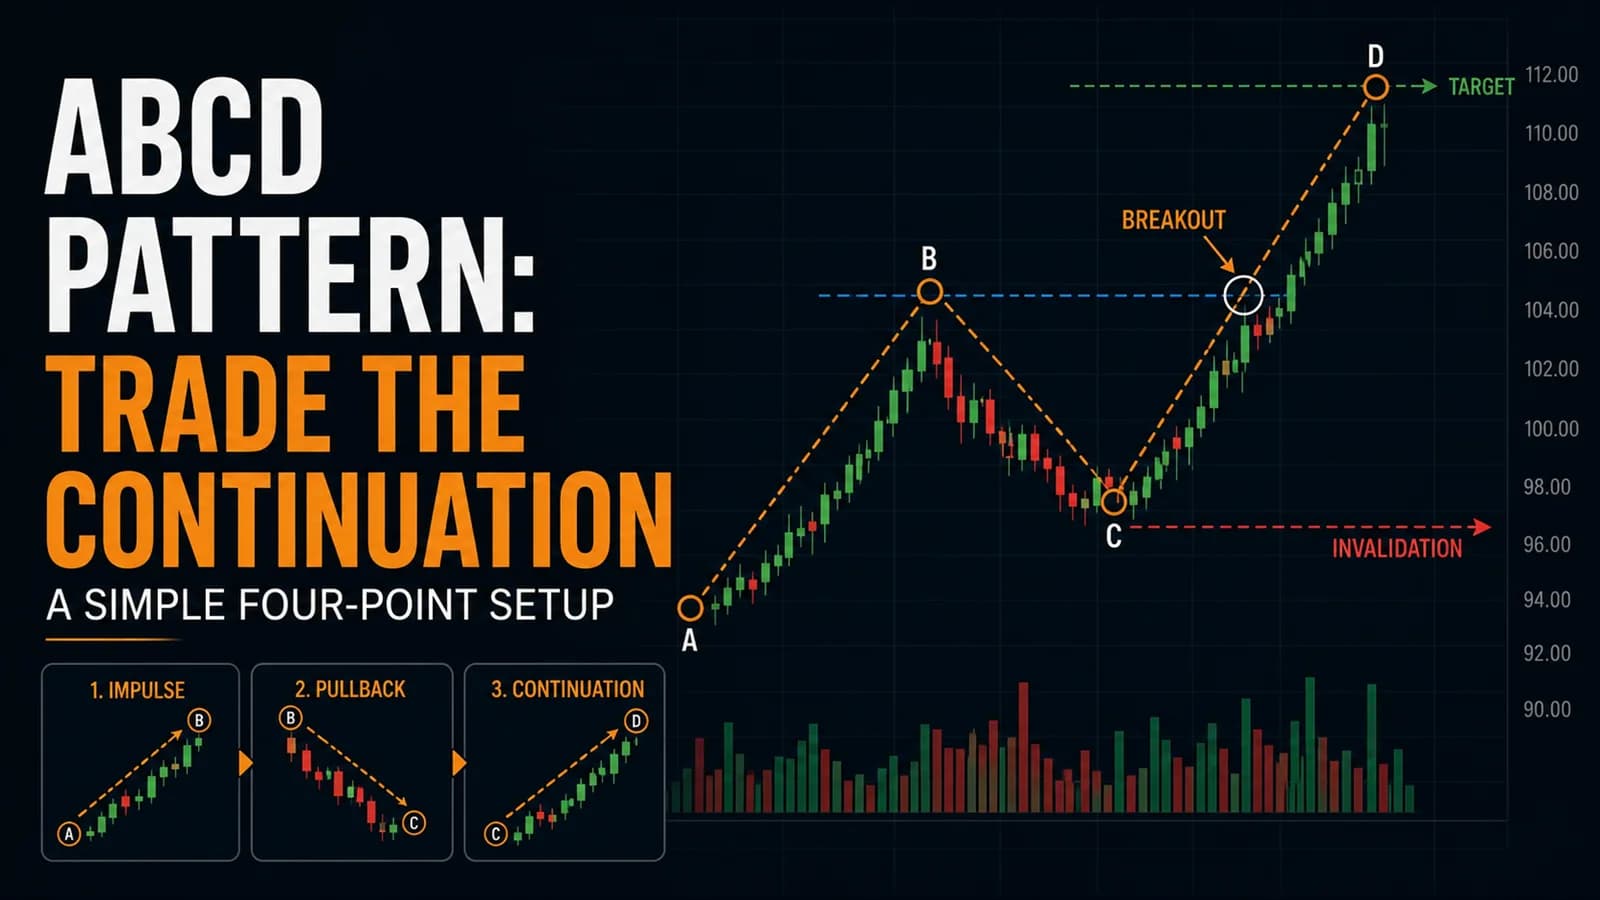
What is the ABCD pattern? The ABCD pattern is a four-point price structure made of two legs: an initial impulse move (A to B) and a pullback (B to C), followed by a projected continuation leg (C to D) that day traders expect to roughly equal the length of the first leg. The entry trigger is a break of point B; the projected target is point D, calculated by adding the AB distance to point C.
ABCD vs. a Harmonic Gartley: Why This Version Is Simpler
The letters A, B, C, D show up in two very different corners of technical analysis, and conflating them causes real confusion. Harmonic patterns like the Gartley, Bat, and Butterfly use ABCD-style labeling too, but they demand a specific lattice of Fibonacci ratios across all four legs (a 0.618 AB retracement at B, a 0.786 XA retracement at D, and so on) before the pattern even qualifies. Those patterns are built for swing and forex traders working off daily and 4-hour charts, where there's time to wait for a precise confluence zone to develop.
The day-trading version of ABCD strips that down to something a trader can act on inside a single session. It doesn't require a matched set of harmonic ratios. It requires two legs: an impulse and a pullback that retraces a reasonable, but not excessive, portion of that impulse. Point D isn't a reversal zone calculated from three separate Fibonacci extensions. It's a measured-move target, projected by adding the length of the first leg to the pullback low. This guide's independent evaluation treats ABCD as what most active day traders actually use it for: a way to put a number on "this pullback looks like it's setting up another leg," not a harmonic reversal signal.
That distinction matters for expectations. A harmonic Gartley completion at D is a countertrend reversal trade. A day-trading ABCD setup is almost always a continuation trade, in the direction of the first impulse. Confusing the two leads to buying a bearish ABCD's D point expecting a bounce, when the setup was built to be sold on a breakdown instead.
For the underlying skill of reading a pullback structure at all, this hub's higher high, higher low market structure guide covers the foundation this pattern builds on, and candlestick basics is worth a review if the anatomy of individual bars isn't second nature yet.
Where and When the ABCD Setup Actually Forms
The ABCD pattern needs a stock that's already moving. It doesn't form on a dead, range-bound name, because the entire structure depends on there being a real impulse leg (the AB move) with enough force behind it to be worth projecting forward.
Best conditions: A stock with a fresh catalyst (earnings, guidance, an upgrade, a sector-wide move) that has already produced one clean directional leg on above-average volume. Relative volume in the 2x to 5x range on the AB leg is a reasonable floor; below that, the "impulse" is often just chop that will retrace all the way back.
Best time of day: The first two hours of the session (9:30 to 11:30 AM ET) produce the cleanest versions, because that's when institutional order flow is heaviest and impulse legs have real conviction behind them. A version that forms during the 12 to 2 PM lull is statistically much weaker; volume dries up and the BC pullback often just becomes the rest of the day.
Stock type: Works across float sizes, but the character changes. A low-float small-cap can complete the entire ABCD sequence in five minutes, with a CD leg that's violent and hard to enter cleanly. A liquid mid-cap or large-cap version plays out over 20 to 45 minutes and gives a trader more time to see the C point form and react to the B breakout with a real order, not a guess.
Market regime: The pattern needs directional conviction somewhere, even if the broader index is flat. A single stock can form a clean ABCD on isolated news in an otherwise dead tape. What kills it is broad market chop that keeps reversing every intraday move within twenty minutes, because that chop shows up inside the BC leg and turns it into a full round-trip instead of a controlled pullback.
The Setup Specification
- Component
- Market Conditions Required
- Rule
- A stock already showing a clean impulse leg (point A to point B) on RVOL ≥ 2.0x; broad market not in a choppy, directionless 15-minute whipsaw
- Component
- Time of Day
- Rule
- 9:30 AM to 11:30 AM ET for the highest-conviction setups; avoid initiating new ABCD entries after 2:30 PM ET
- Component
- Stock Selection Criteria
- Rule
- Price above $2.00 for liquidity reasons (sub-$1 versions are dominated by spread and manipulation risk), RVOL ≥ 2.0x, a defined catalyst or sector tailwind
- Component
- Entry Trigger
- Rule
- First 1-minute candle to close above point B's high, on volume at or above the average of the prior five 1-minute bars
- Component
- Stop Loss
- Rule
- Below point C (the pullback low); for a tighter version, below the low of the entry candle itself
- Component
- Initial Profit Target
- Rule
- Point D, calculated as C + (B − A); scale a third to half of the position at the 1.0x AB extension, trail the remainder toward a 1.272x extension
- Component
- Trade Management
- Rule
- Move stop to breakeven once price clears the prior high (point B) by roughly half the BC leg's range; trail below rising 1-minute swing lows after that
- Component
- Invalidation Criteria
- Rule
- A close back below point C after the B breakout triggers; a BC retracement deeper than roughly 70-75% of the AB leg before the breakout even fires
| Component | Rule |
|---|---|
| Market Conditions Required | A stock already showing a clean impulse leg (point A to point B) on RVOL ≥ 2.0x; broad market not in a choppy, directionless 15-minute whipsaw |
| Time of Day | 9:30 AM to 11:30 AM ET for the highest-conviction setups; avoid initiating new ABCD entries after 2:30 PM ET |
| Stock Selection Criteria | Price above $2.00 for liquidity reasons (sub-$1 versions are dominated by spread and manipulation risk), RVOL ≥ 2.0x, a defined catalyst or sector tailwind |
| Entry Trigger | First 1-minute candle to close above point B's high, on volume at or above the average of the prior five 1-minute bars |
| Stop Loss | Below point C (the pullback low); for a tighter version, below the low of the entry candle itself |
| Initial Profit Target | Point D, calculated as C + (B − A); scale a third to half of the position at the 1.0x AB extension, trail the remainder toward a 1.272x extension |
| Trade Management | Move stop to breakeven once price clears the prior high (point B) by roughly half the BC leg's range; trail below rising 1-minute swing lows after that |
| Invalidation Criteria | A close back below point C after the B breakout triggers; a BC retracement deeper than roughly 70-75% of the AB leg before the breakout even fires |
The retracement depth at C matters more than most beginners realize. A BC pullback that retraces less than 30% of the AB leg often means the move is too vertical and parabolic to have real structure; a lot of these fail because there's no genuine base at C, just an air pocket. A BC pullback deeper than about 75% usually means the AB impulse has been fully absorbed by sellers, and what looks like "point C" is really just the top of a new, weaker range. The workable zone sits roughly between a 38% and 70% retracement of the AB leg, with 50% to 61% being the area this guide's evaluation treats as the highest-quality setups.

A Walk-Through: Building the Pattern in Real Time
Picture a mid-cap industrial stock, ticker XYZ, trading around $34.00 heading into the open. At 9:41 AM ET, the company's sector gets a bullish note from a widely-followed analyst, and XYZ starts moving. That's point A: $34.10.
Over the next eleven minutes, XYZ runs hard on RVOL of 3.4x, printing a high of $36.70 at 9:52 AM. That's point B. The AB leg measures $2.60.
From 9:52 to 10:08 AM, XYZ drifts back down as early buyers take profit and the initial burst of volume fades. It bottoms at $35.85 at 10:08 AM before starting to firm up. That's point C: a retracement of roughly 33% of the AB leg, right at the shallow edge of the workable zone, with volume noticeably lighter than the AB leg (a good sign; heavy selling volume on the pullback would be a warning, not a confirmation).
At 10:11 AM, a 1-minute candle closes at $36.75, clearing point B's $36.70 high on volume that's 1.6x the average of the prior five bars. That's the entry trigger. A trader buying here at $36.75 sets a stop below point C at $35.80 (a $0.95 risk per share) and calculates point D: $35.85 + $2.60 = $38.45.
By 10:29 AM, XYZ trades through $37.60, roughly the 1.0x extension zone, and a disciplined trader scales out a third of the position there, moving the stop on the remainder to breakeven. XYZ continues to $38.30 by 10:44 AM before stalling just shy of the full $38.45 projection and rolling over into a new, shallower pullback. The trailing stop, sitting below the last rising 1-minute swing low around $37.90, gets hit on the reversal, closing the remaining shares for a solid single-digit percentage gain on top of the first scale-out.
Notice what didn't happen: XYZ never touched the exact $38.45 projection. That's normal, not a flaw in the pattern. Measured-move targets are a probabilistic zone to start locking in gains and tightening risk, not a guarantee the stock owes you.
Managing the Trade From the B Breakout to the D Target
The period between the entry trigger and the D projection is where most of this setup's edge either gets captured or given back. A few specific mechanics matter here.
The breakeven stop move isn't automatic on entry, it's earned. Moving a stop to breakeven the instant a trade is entered is a common beginner habit that just gets a trader stopped out on the very first wiggle above B. Wait until price has cleared B by a meaningful amount, roughly half the BC leg's range, before tightening risk that far.
Scaling at the 1.0x extension is a discipline decision, not a target-hitting decision. Because so few CD legs perfectly complete the full projection (more on the exact numbers in the next section), locking in real profit at the first extension level protects the trade from giving back the entire unrealized gain on a reversal, while the trailed remainder still captures any continuation toward the full D projection or beyond.
Volume on the CD leg should exceed or match the volume on the BC pullback. If the breakout above B happens on light volume that's lower than the pullback itself, that's a tell that the move lacks real participation, and tightening the trailing stop earlier than usual is the right adjustment.
For the general mechanics of scaling out of a position as it runs, this hub's guide to trend continuation re-entries covers the same "clear the prior swing high, manage in stages" logic from a different angle. And because giving back an unrealized gain is one of the more painful experiences in trading, the psychology hub's piece on letting winners run without giving it all back is directly relevant here.
Where the ABCD Pattern Fails
The single biggest failure mode with the ABCD setup is treating the D projection as a promise instead of a probability zone. No published large-sample study exists that's specific to the intraday ABCD pattern as day traders use it, since it's a practitioner framework rather than an academically studied formation, so this guide won't invent a precision win rate. What can be said honestly, based on the broader research into measured-move and continuation patterns of similar structure, is that full completion of the projected leg is the exception, not the rule; partial completion in the 0.618x to 1.0x extension range is the more common outcome, which is exactly why scaling out before the full D projection is built into the Setup Specification above, not treated as an optional refinement.
A second failure mode shows up when the BC pullback isn't really a pullback at all, it's a full trend reversal wearing a pullback's clothes. This tends to happen when the AB leg was driven by a single burst of news-driven buying rather than sustained accumulation. Once that initial burst of buyers is done, there's no real underlying demand left to fuel a CD leg, and the "pullback" just continues lower, blowing through the C stop level entirely. Watching whether the BC pullback happens on declining volume (healthy) versus volume that's picking back up to the downside (unhealthy) is the clearest early warning this guide has found for separating the two.
A third failure mode is chasing the B breakout after it's already extended too far past the actual trigger candle. Entering three or four 1-minute candles after the break of B, once the move already looks obvious to everyone watching the same chart, means buying at a materially worse price with a materially wider stop to point C, which mechanically destroys the risk-to-reward ratio the setup depends on.
This pattern also degrades badly in low-volume, holiday-adjacent, or midday sessions. Without the volume to fuel a real AB impulse in the first place, what looks like an ABCD structure is often just random chop that happens to fit four points on a chart. Pattern recognition finds shapes in noise; that doesn't mean the shape has predictive value when the volume backing it isn't there.
Variations Worth Knowing
The bearish ABCD mirrors the entire structure for short setups: point A is a swing high, B is a lower swing low from an impulse decline, C is a bounce that retraces 38% to 70% of the AB decline, and the entry trigger is a break below B, with D projected as C minus the AB distance. Everything else, from the retracement zone to the scaling logic, works the same way in reverse.
The compressed ABCD happens on low-float, high-momentum names where the entire A-to-D sequence completes in under ten minutes. These require faster execution and tighter risk management, since the BC pullback might only last two or three candles before the CD leg fires. A trader working this variant needs a scanner that flags the setup in real time, because there usually isn't time to spot it manually and then wait for confirmation.
The multi-leg ABCD, sometimes called an "ABCD-in-a-trend," happens when a strong trending stock completes one ABCD sequence, consolidates briefly, and then uses the old point D as a new point A for a second sequence. This is common on trend days and connects directly to this hub's broader trend day playbook for reading when a stock has that kind of sustained, multi-leg character to begin with.
Tools for Finding and Confirming ABCD Setups
Spotting a clean AB impulse leg in real time, across a watchlist of dozens of names, is not something most traders can do by eye alone. A scanner built for momentum and relative volume is what turns this from a reactive pattern into a proactive one. Trade Ideas can be configured to flag stocks making a sharp price move on elevated RVOL, which is effectively an automated way to catch point B as it's forming, giving a trader time to watch for the C pullback and prepare the B-breakout order instead of discovering the setup after D has already printed.
Beyond scanning, a charting platform with clean Fibonacci retracement and extension tools makes measuring the BC retracement percentage and the projected D target mechanical rather than eyeballed. For a broader look at charting and scanning tools relevant to pattern-based day trading generally, the tools and reviews section covers the current landscape in more depth than fits here.
How ABCD Fits a Complete Trading Plan
The ABCD pattern is a tool for one specific job: turning a pullback in an already-moving stock into a defined entry, stop, and target. It isn't a standalone trading plan by itself. It works best as one instrument in a broader momentum or breakout-focused approach, sitting alongside tools like this hub's breakout versus fakeout checklist for confirming the B-level break has real conviction behind it, and the volume breakout strategy for the underlying logic of why volume confirmation matters at every stage of this setup.
Position sizing should scale with the retracement depth and volume quality at point C, not stay fixed regardless of setup quality. A textbook 50% retracement on rising RVOL deserves a full-size position under a trader's plan; a 70% retracement on fading volume, sitting at the edge of the workable zone, deserves a reduced size or no trade at all. For the mechanics of sizing risk per trade, this hub assumes familiarity with basic position sizing; if that formula isn't second nature yet, that's the place to start before adding a pattern like this on top of it.
Frequently Asked Questions
How is the ABCD pattern different from a simple bull flag?
A bull flag is defined by its shape, a sharp pole followed by a tight, controlled consolidation. The ABCD pattern is defined by its measurement: the specific retracement percentage at C and the projected extension at D. In practice, many bull flags are also valid ABCD patterns, but ABCD adds a numeric target and a defined retracement zone that a flag's shape alone doesn't specify.
Key Takeaway: Treat ABCD as a measurement framework that can be layered on top of a flag, breakout, or pullback pattern a trader has already identified by its shape, rather than a wholly separate setup to hunt for from scratch.
What retracement percentage at point C actually matters most?
The 50% to 61.8% retracement zone is where this guide's evaluation has found the most reliable balance between a real pause (enough retracement to shake out weak hands) and a still-intact trend (not so much retracement that the original move has been erased). Retracements shallower than 38% often mean the move is too parabolic to trust, and retracements beyond 75% usually mean the trend has already broken.
Key Takeaway: Treat the 50-61.8% zone as the highest-quality setups, and reduce position size meaningfully outside of it rather than applying a flat rule to every retracement depth.
Does the CD leg need to exactly equal the AB leg in price?
No, and expecting an exact match sets up a trader for disappointment on a setup that otherwise worked. The AB=CD framework is a projection tool, not a law of price behavior; the CD leg reaching anywhere from 0.618x to 1.272x the length of AB is a normal range of outcomes, which is exactly why the Setup Specification above scales out part of the position at the 1.0x level rather than holding the entire position for an exact D match.
Key Takeaway: Use the D projection as a scaling and target-planning tool, never as a reason to hold a full position past an obvious reversal signal while waiting for an exact number.
What happens if point C breaks before the B breakout ever triggers?
That's the pattern's built-in invalidation signal, not a reason to keep waiting for the setup to still work. Once price closes below point C, the BC leg has stopped being a controlled pullback and has become a trend change; the original AB impulse's buyers are underwater, and the setup should be abandoned rather than re-drawn with a new, lower point C.
Key Takeaway: A break of C before the B breakout fires is a hard no-trade signal, not an invitation to relabel the chart and keep hunting for the pattern.
Can the ABCD pattern be traded on higher timeframe charts intraday, like the 5-minute or 15-minute chart?
Doing so on a 5-minute or 15-minute chart typically produces a lower-frequency but higher-quality version of the setup, since the impulse and pullback legs both require more sustained conviction to register on a longer timeframe. A trader working a slower, more selective style will generally find better risk-to-reward on the 5-minute version; a trader who wants many opportunities per session will stay on the 1-minute chart and accept more noise.
Key Takeaway: Match the chart timeframe to trading style: 1-minute for frequency, 5-minute or 15-minute for a smaller number of higher-conviction setups.
How does the ABCD pattern differ from simply buying a new high of day?
Buying a fresh high of day has no defined retracement structure behind it and no measured target, just momentum. The ABCD pattern requires a specific pullback (the BC leg) to have already occurred and requires that pullback to fall within a defined percentage range before the B breakout is even considered valid. A high-of-day break can happen with no meaningful pullback at all, which is a fundamentally different, more momentum-driven trade with different risk characteristics.
Key Takeaway: Treat ABCD as a structured subset of momentum trading built around a specific pullback shape, not a synonym for chasing new highs.
Why does volume on the BC pullback matter if the trade doesn't trigger until the CD leg?
Volume on the BC leg is the clearest early signal of whether the pullback is healthy profit-taking or the start of a genuine reversal. Declining volume on the pullback suggests sellers are running out of conviction, which is exactly the condition that supports a strong CD leg once buyers step back in. Rising volume on the pullback suggests real distribution is happening, which often means the eventual B breakout, if it happens at all, will be weak and worth a smaller position or no trade.
Key Takeaway: Read the BC leg's volume as a leading indicator of CD leg quality, not just as background noise to ignore until the breakout trigger fires.
Is the ABCD pattern better suited to long or short setups?
Neither has a structural advantage; the pattern is directionally symmetric by design. What actually tilts the odds is the broader market and sector trend a trader is working within. A bullish ABCD forming in a stock that's also above its intraday VWAP and moving with a rising broader market carries more conviction than the mirror-image bearish version fighting a rising tape, and vice versa in a broad market decline.
Key Takeaway: Choose direction based on alignment with the broader trend and tape, not based on any inherent bias in the pattern itself.
What's the most common beginner mistake with this setup?
Entering on the B breakout without ever confirming that point C sat inside the workable 38-70% retracement zone. A breakout above a prior high looks like a valid trigger regardless of how deep or shallow the preceding pullback was, which is exactly why beginners take this trade on structures that were never a real ABCD pattern to begin with, just a random high being broken.
Key Takeaway: Confirm the retracement zone at C before the breakout, not after, since the retracement depth is what separates a real ABCD setup from a coincidental high break.
Should a trader hold any shares past the full D target if momentum is still strong?
It's a defensible choice for a portion of a position, provided it's a pre-planned rule rather than an emotional decision made in the moment. A common approach is holding a small final piece (a quarter or less of the original size) with a trailing stop below rising swing lows once price clears the full D projection, treating anything beyond D as a bonus rather than an expectation.
Key Takeaway: Plan any beyond-D hold in advance as a small, trailing-stop-protected piece of the position, not as a full-size bet that the stock will keep running indefinitely.
Disclaimer
Article Sources
- StockCharts ChartSchool: Chart Patterns - reference library for classic pattern structures, including impulse-and-retracement formations related to the ABCD framework
- StockCharts ChartSchool: Introduction to Candlesticks - foundational reading on reading individual price bars within a multi-leg structure
- FINRA: Understanding the New Intraday Margin Requirements - current regulatory framework for day-trading accounts following the PDT rule's elimination
- FINRA Rule 2270: Day-Trading Risk Disclosure Statement - the regulatory baseline for day-trading risk disclosure
- CME Group: Futures — Looking Beyond Technical Analysis - exchange-level perspective on the limits of pattern-based technical analysis
Was this helpful?
Be the first to weigh in

Written by
Kazi Mezanur RahmanFounder, independent researcher, and editor of DayTradingToolkit. A one-person publication focused on risk-first trading education and documented tool research. He trades his own capital as a retail trader and combines personal market experience with systematic primary-source research.
Keep Reading

Beginner’s Guide
Reading the Story of Price: An Introduction to Candlestick Charts
Learn how to read candlestick charts step by step. Understand candle anatomy, body size, wick meaning, and the 5 single-candle types every beginner must know.
Beginner’s Guide
Position Sizing for Beginners: How Much Should You Risk Per Trade?
Learn the position sizing formula for day trading. Calculate exactly how many shares to trade using the 1-2% rule, protect your account, and manage risk like a pro.

Strategies
A Trader's Playbook for Trend Days: How to Maximize One-Sided Markets
Learn how to identify trend days before they develop, confirm them with market internals, and trade them without leaving half the move on the table.

Strategies
Trading Breakouts From Consolidation: The Volatility Contraction Pattern
The VCP isn't just a volatility squeeze. This guide covers the staged contraction sequence, the pivot point, and why context matters as much as the pattern.
Comments
No comments yet. Be the first to share your thoughts.