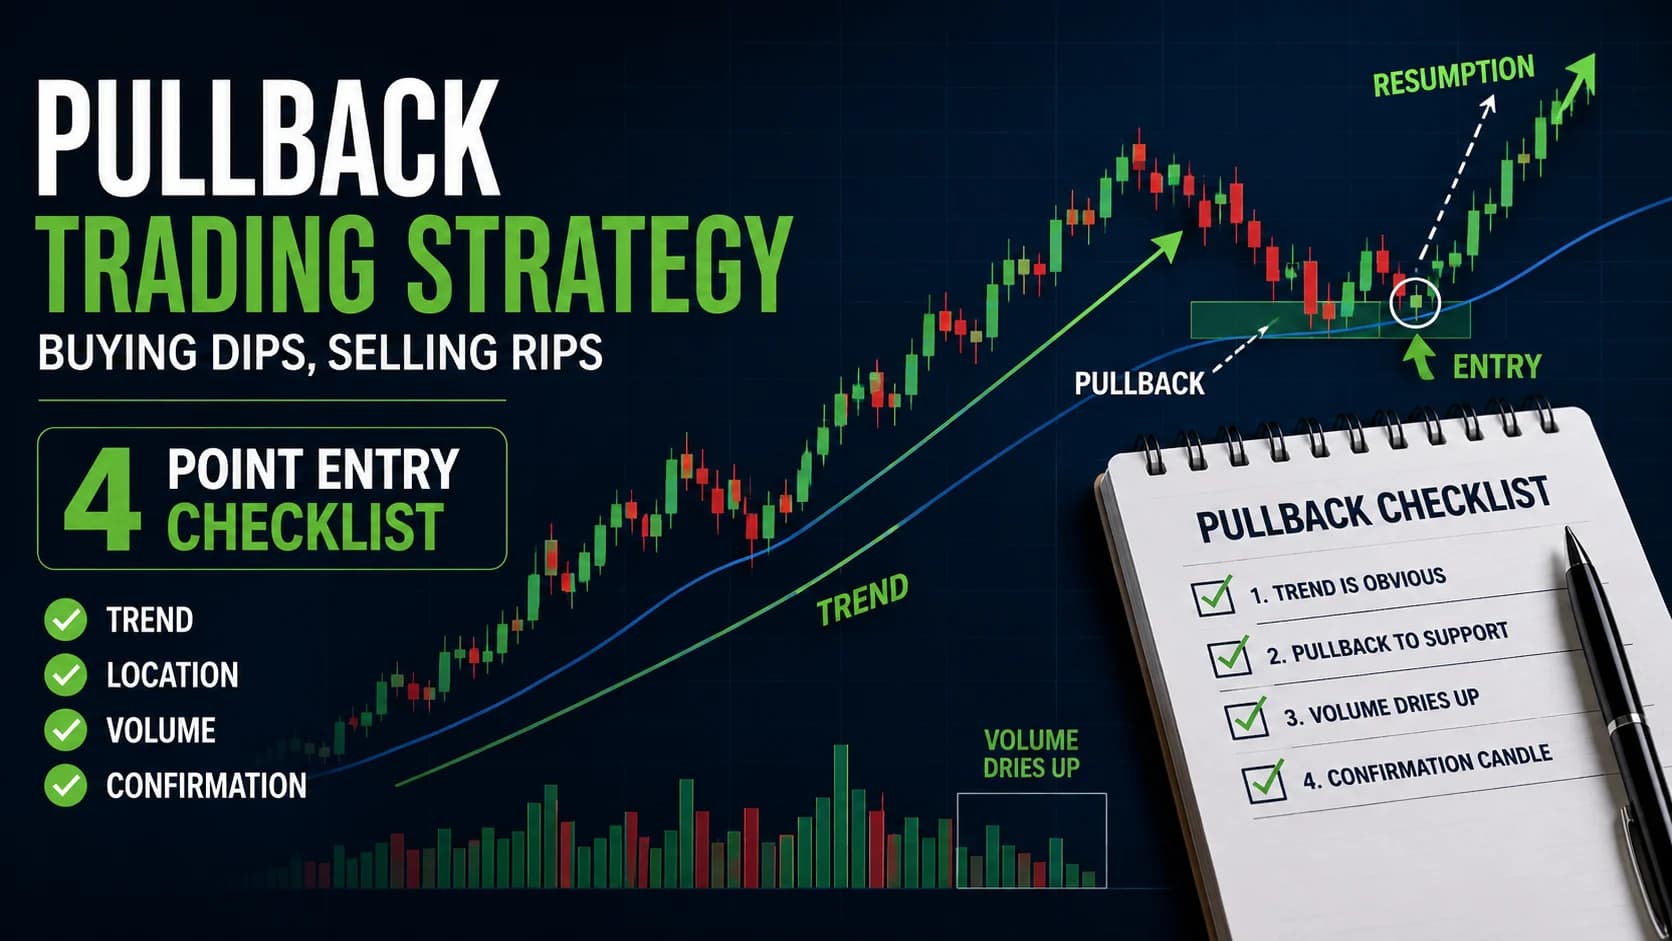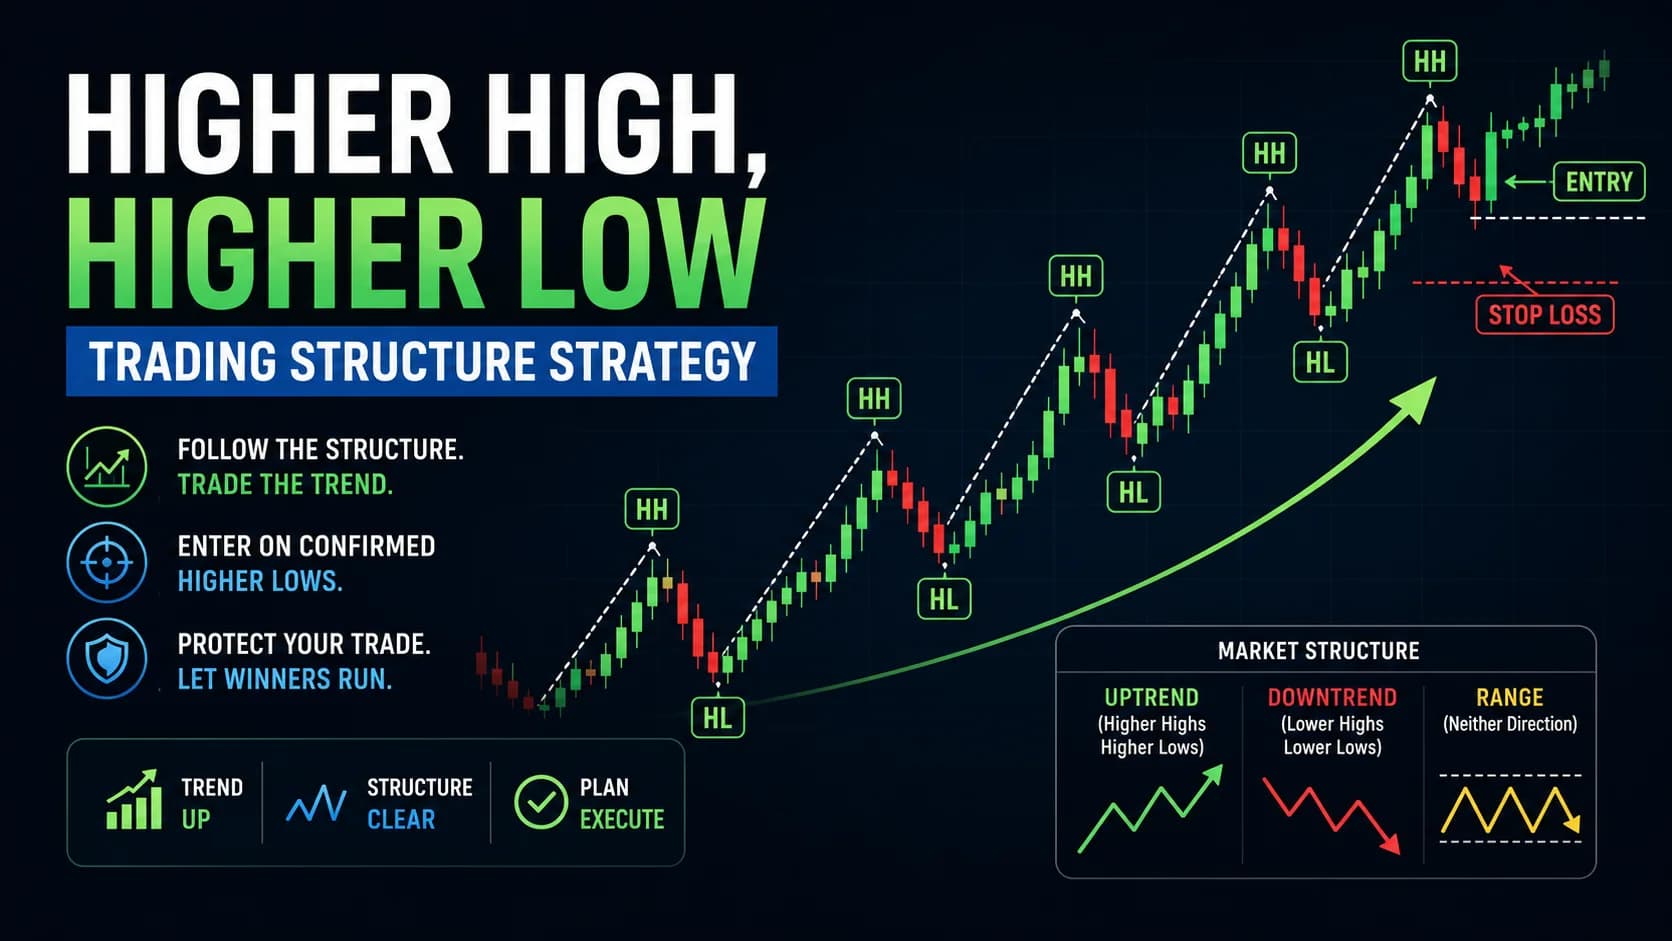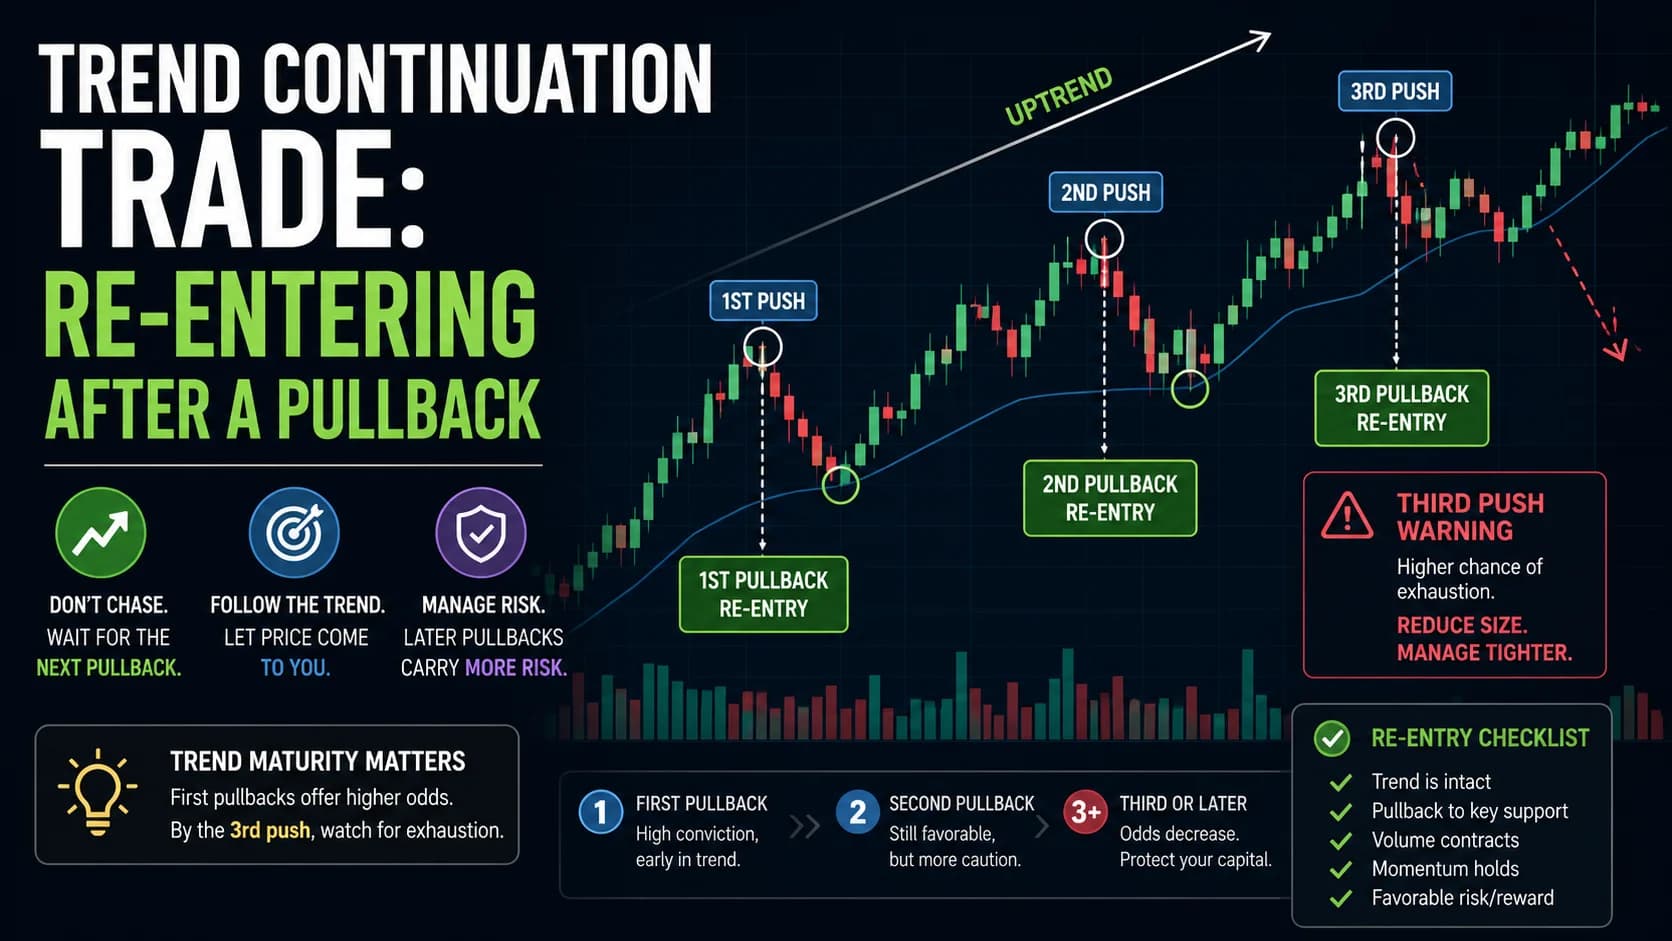
The first PullbackA pullback is a temporary counter-trend price movement within an established trend — in an uptrend, a pullback is a short-term decline that offers a lower-risk entry point before the trend resumes, as opposed to a reversal which signals theRead definition → in a new TrendA trend is a sustained directional movement in price over time — an uptrend is characterized by a sequence of higher highs and higher lows, a downtrend by lower highs and lower lows — and correctly identifying the current trend direction isRead definition → gets all the attention. The second and third pullbacks are where most of the actual decision-making happens — and where most traders get it wrong in one of two opposite directions: either chasing a move they already missed, or blindly re-entering a trend that's already showing its age.
What is the trend continuation re-entry strategy? The trend continuation re-entry strategy is a framework for deciding whether to take a second, third, or later pullback entry in an already-established trend, rather than chasing a missed move or assuming every re-entry carries the same odds as the first. It tracks how many "pushes" a trend has already made and adjusts Position SizePosition size is the number of shares, contracts, or dollar value you deploy in a single trade — determined by the relationship between your account risk percentage, your dollar risk per share (distance to stop), and your account size ratheRead definition →, targets, and willingness to re-enter accordingly, since later pullbacks statistically carry more exhaustion risk than earlier ones.
Re-Entering a Trend vs. Chasing a Missed Move
This is not the same tool as this guide's pullback checklist, which defines the mechanical entry, stop, and target for any single qualifying pullback. This framework sits one level above that — it answers a different question: given that a trend has already produced one or more pullback entries, should this specific one be taken, and at what size?
Missing the first pullback in a strong trend creates a specific, dangerous temptation: chasing the stock at a worse price just to "get in," with no real edge behind the decision beyond fear of missing out. This framework's answer to that temptation is structural rather than willpower-based: wait for the next qualifying pullback rather than buying into strength with no defined risk. A trend that's genuinely intact will produce another one.
It's also not the same thing as pyramiding — adding to an existing, still-open winning position. Pyramiding assumes a trader is already in the trade and deciding whether to add exposure. This framework covers the more common situation: a trader who is flat, deciding whether a new pullback in an existing trend is a fresh entry worth taking.
When Later Pullbacks Behave Differently Than the First
A trend's first pullback tends to be shallow and quickly reversed — early, high-conviction participants are still stepping in, and the pullback itself often reflects nothing more than routine profit-taking from the initial move. A second pullback is usually still a reasonable, tradeable continuation, though typically somewhat deeper and slower than the first.
By the third pullback in the same trend, a well-documented price-action pattern — sometimes called "three pushes to end a trend" — starts to become a real consideration. The pattern describes a trend making three successive push-and-pullback cycles with progressively less force behind each new push: contracting swings, shrinking momentum, and a "ragged," indecisive character to the pullbacks themselves. It's treated by experienced price-action traders as a genuine warning sign rather than an automatic exit signal — a trend can still continue past a third push, but the odds of it doing so with the same conviction as the first two pushes go down.
This isn't a fixed rule that guarantees a reversal on cue. It's a probabilistic tendency worth building into position sizing and target expectations, not a hard stop that overrides everything else this guide's other strategies say about the trend's health.
The Re-Entry Decision Framework (Setup Specification)
Every component below governs whether and how to take a new pullback entry in an already-established trend. The actual entry, stop, and target mechanics still come from this guide's pullback checklist or another companion entry method — this framework decides whether that entry is worth taking and at what size.
- Component
- Market Conditions Required
- Rule
- An already-confirmed trend with at least one completed pullback-and-continuation cycle already in place
- Component
- Time of Day
- Rule
- Follows whichever companion entry method's own best-conditions window applies
- Component
- Stock Selection Criteria
- Rule
- Same liquidity and volume thresholds as the companion entry method being used
- Component
- Entry Trigger
- Rule
- Apply the companion checklist at each new pullback; track which numbered push in the trend's sequence this represents (1st, 2nd, 3rd or later)
- Component
- Stop Loss
- Rule
- Set by the companion method's mechanical stop rule, tightened relative to the trend's push count
- Component
- Initial Profit Target
- Rule
- Set by the companion method; reduce target expectations and scale out faster on a 3rd-or-later push
- Component
- Trade Management
- Rule
- Standard size on the 1st and 2nd push; reduced size, tighter management, and quicker scale-out on the 3rd push and beyond
- Component
- Invalidation Criteria
- Rule
- The companion method's normal invalidation rule, plus contracting, "ragged" swings on a 3rd-or-later push, which is this framework's own specific warning to reduce exposure regardless of whether the checklist otherwise still qualifies
| Component | Rule |
|---|---|
| Market Conditions Required | An already-confirmed trend with at least one completed pullback-and-continuation cycle already in place |
| Time of Day | Follows whichever companion entry method's own best-conditions window applies |
| Stock Selection Criteria | Same liquidity and volume thresholds as the companion entry method being used |
| Entry Trigger | Apply the companion checklist at each new pullback; track which numbered push in the trend's sequence this represents (1st, 2nd, 3rd or later) |
| Stop Loss | Set by the companion method's mechanical stop rule, tightened relative to the trend's push count |
| Initial Profit Target | Set by the companion method; reduce target expectations and scale out faster on a 3rd-or-later push |
| Trade Management | Standard size on the 1st and 2nd push; reduced size, tighter management, and quicker scale-out on the 3rd push and beyond |
| Invalidation Criteria | The companion method's normal invalidation rule, plus contracting, "ragged" swings on a 3rd-or-later push, which is this framework's own specific warning to reduce exposure regardless of whether the checklist otherwise still qualifies |
Counting the push number is the entire DisciplineTrading discipline is the consistent application of your predefined rules — entries, stops, targets, position sizing, maximum daily loss — regardless of what you're feeling in the moment.Read definition → this framework adds. A trader who treats every pullback in a trend as identical to the first is ignoring real information about how the trend has aged. Keeping a simple running count — first push, second push, third push — is a small habit that changes sizing decisions meaningfully over the life of a trend.
Missing an entry is not the same as losing the trade. A trend genuinely intact will offer another pullback. Chasing price after a missed entry abandons this guide's defined risk parameters in exchange for a worse average price and no real edge — the correct response to a missed first pullback is PatiencePatience in trading is the discipline to wait for your exact setup criteria to be met before entering — resisting the urge to force trades in suboptimal conditions, sit out chop, and skip marginal setups in favor of the high-probability setRead definition → for the second, not pursuit of the first.
Walk-Through Example: Three Pushes in a Trending Industrial Stock
Consider a hypothetical industrial stock — call it MNO, in a clean uptrend over the course of a single extended trend day.
The first push and pullback: MNO rallies from $30 to $34, pulls back shallowly to $33 on light volume, and confirms with a bullish engulfing candle. This is push one — a standard, full-size pullback checklist entry.
A missed second entry: MNO continues to $37, then pulls back to $35.20 — deeper than the first pullback, but still on declining volume with a clean confirmation candle. A trader who missed this second push has two options: chase MNO higher with no defined risk, or wait for whatever comes next. This framework's answer is to wait.
The third push: MNO pushes to $39, a smaller gain than the prior leg, then pulls back to $36.80 on choppier, less decisive price action — smaller candle bodies, a less clean confirmation, and volume that doesn't contract as cleanly into the pullback as the first two cycles did. Under this framework, this is the third push, and the "three pushes" pattern's warning applies: if a checklist-qualifying entry appears here at all, it's taken at reduced size with a faster scale-out plan, not the same size as pushes one and two.
What happens next: MNO manages one more limited push to $40 before stalling and rolling over into a choppy afternoon range. A trader who sized down on the third push and scaled out quickly captured a reasonable piece of the move without being caught holding full size into the stall.
Position Sizing as a Trend Matures
The practical difference this framework makes is almost entirely about position size and management, not about the entry mechanics themselves. A first-push entry, backed by the trend's freshest conviction, reasonably gets standard position size and the companion method's normal target. A third-push entry, carrying the added statistical burden of the exhaustion pattern discussed above, reasonably gets reduced size, a tighter stop relative to the setup's structure, and a faster scale-out rather than holding for the full measured target.
This isn't about refusing to trade a third push at all — a trend can and does continue well past three pushes plenty of times. It's about sizing the decision to match the genuinely different risk profile a later push carries compared to an earlier one.
Why the "Three Pushes" Pattern Isn't a Guarantee
The most important caveat to this entire framework is that the three-pushes pattern is a probabilistic tendency documented by experienced price-action traders, not a proven statistical law with a fixed failure rate. Plenty of genuinely strong trends — particularly on high-conviction trend days or in powerful multi-day moves — push far beyond three cycles and keep working. Treating the third push as an automatic exit signal, rather than a reason for increased caution, would mean abandoning strong trends prematurely on a regular basis.
The pattern is also genuinely difficult to apply with precision in real time. Deciding exactly where one "push" ends and the next begins involves the same kind of judgment call this guide's market structure framework addresses for swing points generally — a push count that seems obvious in hindsight can be genuinely ambiguous while it's still forming.
Finally, this framework says nothing about whether a specific pullback qualifies as a tradeable entry in the first place — that's still entirely the companion checklist's job. A trader can correctly count "this is the second push" and still have no valid entry if the pullback itself never produces a genuine confirmation signal.
Downtrends, Pyramiding, and Trend-Day Applications
Applying the same logic to downtrends: Everything mirrors cleanly for a sequence of lower-high rejections in a downtrend — the first breakdown-and-bounce cycle gets standard size, later cycles get progressively more caution applied using the same three-push framing.
Combining with a structural stop signal: This guide's market structure framework supplies a harder, more objective invalidation signal than push-counting alone — a genuine break of structure is a reason to stop re-entering entirely, regardless of which push number the trend is currently on.
Distinguishing re-entry from pyramiding: A trader already holding a winning position from an earlier push, deciding whether to add exposure at a later pullback rather than entering fresh, is making a related but distinct decision — pyramiding into an open position carries its own risk considerations beyond the scope of this framework.
Applying it to trend days specifically: This guide's trend day playbook covers the broader single-session context this framework often plays out within, since a strong trend day frequently produces exactly this kind of multi-push sequence within one session.
Charting Tools for Tracking Push Count
Tracking push count and reading whether a pullback's character is contracting or holding steady is fundamentally a charting exercise. TradingView makes it straightforward to mark each prior pullback on a chart and visually compare the depth and volume signature of the current one against what came before.
For finding stocks already in the early stages of a fresh trend — where a first-push entry is still available rather than a later, higher-risk push — Trade Ideas can scan for stocks just beginning to show trending behavior with rising relative volume. Traders comparing current pricing can check the deals page for active offers.
Building Push-Counting Into a Trading Plan
This framework works best as a written sizing rule rather than an in-the-moment judgment call: standard size on the first and second push, reduced size and faster scale-out from the third push onward, full stand-aside once a genuine structural break occurs. Writing that rule down in advance removes the temptation to rationalize a full-size entry on a fourth or fifth push simply because the trade "feels" strong in the moment.
The hardest part of this framework isn't the mechanics — it's resisting the urge to chase a missed entry instead of waiting for the next legitimate one. This guide's breakdown of finding patience and staying objective covers exactly that tension, since the instinct to chase is strongest at the exact moment this framework asks a trader to do nothing. For the full library of related setups, this guide's Strategies hub covers everything else this framework builds on.
Frequently Asked Questions
How is this different from the pullback checklist itself?
The checklist answers "does this specific pullback qualify as an entry." This framework answers a different question that sits above it: given how many times this trend has already pulled back and continued, should this new entry get standard size, reduced size, or be skipped entirely. The two work together rather than competing.
Key Takeaway: The checklist decides if a pullback qualifies; this framework decides how much weight to put behind it.
I missed the first pullback — should I chase the move or wait?
A trend that's genuinely intact will produce another pullback entry. Chasing a missed move means buying at a worse price with no clean stop-loss reference, which abandons the defined-risk structure every other setup in this guide depends on. The disciplined response to a missed entry is patience, not pursuit.
Key Takeaway: A missed pullback is not a missed trade — it's a reason to wait for the next one.
Why does the third pullback carry more reversal risk than the first?
Early pushes in a trend are typically backed by fresh, high-conviction participation, while later pushes increasingly reflect a shrinking pool of remaining buyers or sellers. This doesn't mean a third push always fails — it means the odds shift enough to justify reduced size and tighter management rather than treating it identically to the first push.
Key Takeaway: Later pushes aren't automatically bad trades, but they carry a statistically different risk profile than the first.
Should you always reduce size on later re-entries, no matter what?
The three-pushes pattern is a probabilistic tendency, not a fixed law that applies identically to every trend. A trend with exceptionally strong volume and clean structure well past its third push may still warrant closer-to-standard sizing, while a trend already showing ragged, contracting swings by its second push may warrant caution earlier than the general guidance suggests.
Key Takeaway: Use push count as a default sizing adjustment, not a rigid formula that overrides everything else the chart is showing.
What is the "three pushes to end a trend" pattern exactly?
The pattern is widely referenced in professional price-action and prop-trading education as a form of buying (or selling) climax — not a guarantee of an immediate reversal, but a genuine signal that the balance of buyers and sellers is shifting after an extended move.
Key Takeaway: Three contracting pushes is a documented warning sign of fading trend momentum, not a certainty of reversal.
How do you actually count which "push" a pullback represents?
This is closely related to the swing-counting judgment this guide's market structure framework requires, and it carries the same honest limitation: a push count that looks obvious after the fact can be genuinely ambiguous while a trend is still developing in real time.
Key Takeaway: Push-counting is a swing-by-swing judgment call, most reliable in hindsight and reasonably clear as it develops.
Is this the same as pyramiding into a winning position?
A trader already in a winning trade from an earlier push faces a different decision — how much additional exposure to add without over-concentrating the position — than a trader who is flat and deciding whether a new pullback is worth entering. The two questions share some logic but aren't identical.
Key Takeaway: This framework is about fresh re-entries; pyramiding is about adding to a position already open.
What signal should make you stop re-entering a trend entirely?
Push count is a useful sizing guide, but it isn't a definitive stop signal on its own, since trends can and do continue well past three pushes. A structural break is the more reliable point to stop looking for new entries altogether, regardless of how many pushes preceded it.
Key Takeaway: Use a structural break, not push count alone, as the hard signal to stop re-entering.
Does this framework apply the same way to swing trades as it does intraday?
The practical difference is simply how the lookback is framed: an intraday trend day might complete three pushes within a single session, while a multi-day swing trend might take those same three pushes over a week or more. The sizing logic doesn't change based on the timeframe.
Key Takeaway: Push-counting logic is timeframe-agnostic — only the pace at which the pushes occur changes.
Can a trend have more than three pushes and keep going strong?
Powerful trend days and strong multi-day trends can and do extend well past three cycles. The practical use of this framework isn't refusing to trade past the third push — it's applying increased scrutiny and reduced size from that point forward rather than assuming every later push carries the same odds as the first.
Key Takeaway: Three pushes is a caution flag, not a finish line — strong trends regularly continue well beyond it.
Article Sources
- SMB Training: "3 Pushes to End a Trend" - professional prop-trading education describing the three-pushes exhaustion pattern this guide's push-counting framework is built around.smbtraining.com
- Jegadeesh & Titman, "Returns to Buying Winners and Selling Losers" (1993), Journal of Finance - the foundational academic study establishing that price trends exhibit statistically significant continuation, underlying this guide's broader momentum-based framing.onlinelibrary.wiley.com
- Investopedia: Exhaustion Gap - reference for standard technical-analysis conventions around trend exhaustion signals.investopedia.com
- StockCharts ChartSchool - reference for standard swing and trend-continuation charting conventions used throughout this guide.chartschool.stockcharts.com