A stock ripping 8% higher means one thing if its entire SectorA broad grouping of companies that operate in the same segment of the economy — such as Technology, Healthcare, Energy, or Financials. Stocks within a sector tend to move together in response to shared economic, regulatory, and sentiment faRead definition → is up 1% that day. It means something completely different if the sector itself is up 6%. Same stock, same percentage move, two very different trades — and the difference is entirely about what's happening one level up from the chart most traders are actually looking at.
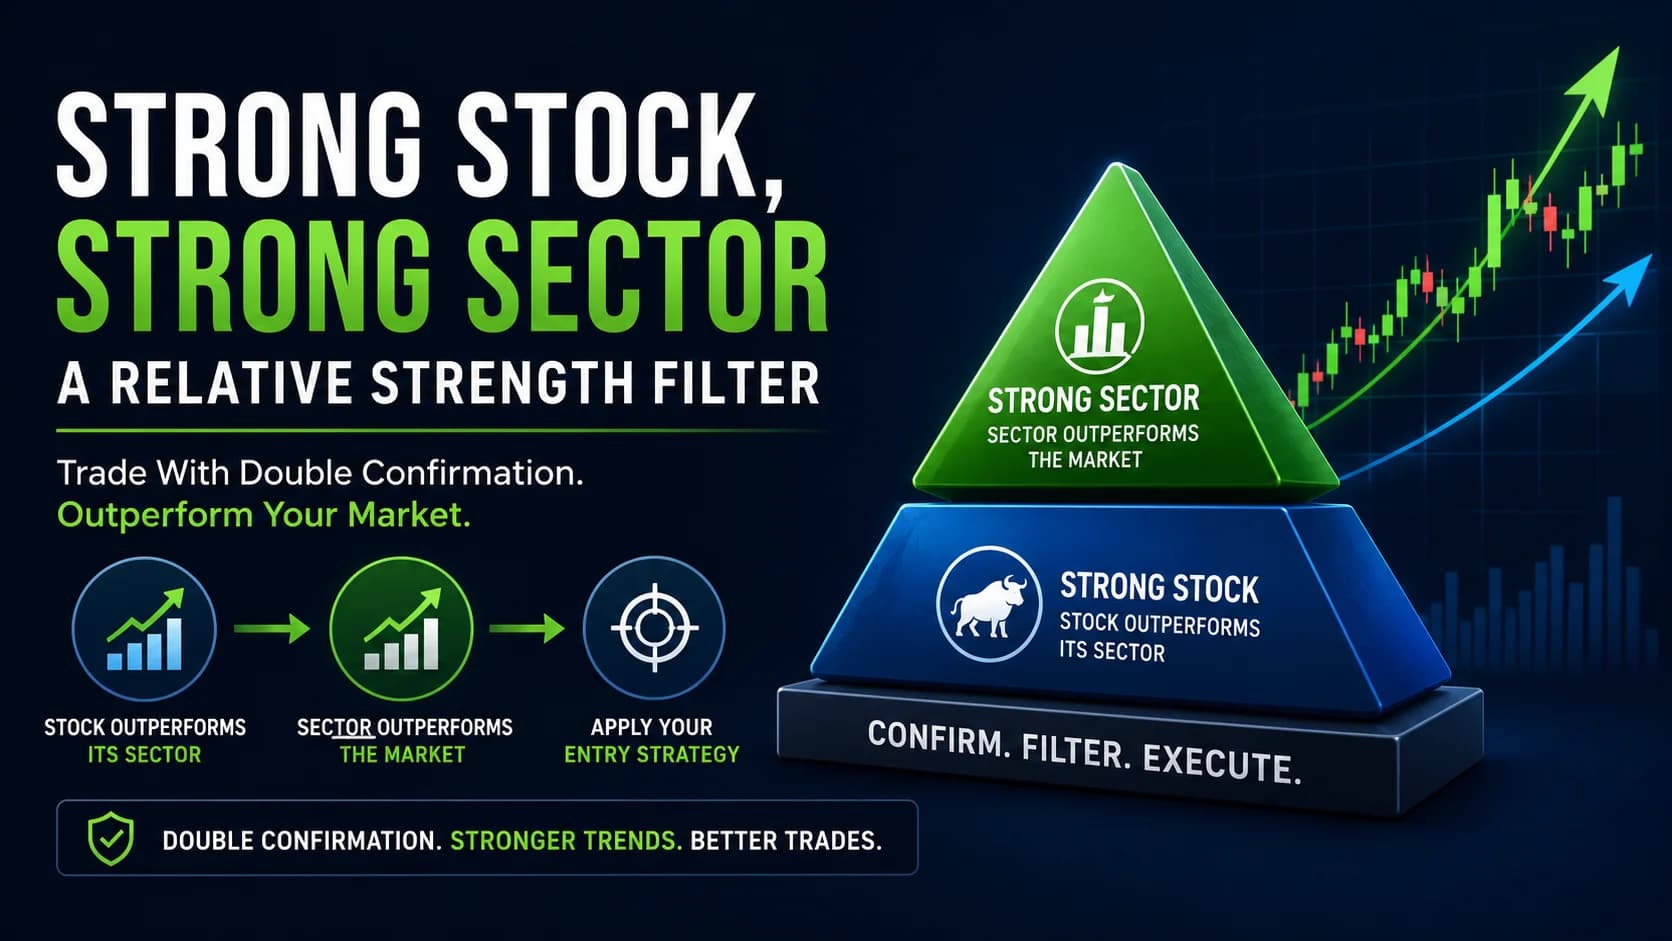
What is the strong-stock-strong-sector strategy? The strong-stock-strong-sector strategy is a stock-selection framework that requires two layers of relative strength to align before a trade qualifies: the stock must be outperforming its own sector ETF, and that sector ETF must itself be outperforming the broader market. Once both layers confirm, this guide's other TrendA trend is a sustained directional movement in price over time — an uptrend is characterized by a sequence of higher highs and higher lows, a downtrend by lower highs and lower lows — and correctly identifying the current trend direction isRead definition →-continuation entry methods — PullbackA pullback is a temporary counter-trend price movement within an established trend — in an uptrend, a pullback is a short-term decline that offers a lower-risk entry point before the trend resumes, as opposed to a reversal which signals theRead definition →, TrendlineA trendline is a straight line drawn connecting two or more swing highs (in a downtrend) or swing lows (in an uptrend) that defines the slope and trajectory of a price trend — price bouncing off a trendline is a potential entry signal, whilRead definition →, structure, or VWAPVWAP (Volume Weighted Average Price) is the average price a security has traded at throughout the session, weighted by volume — it's the most important intraday indicator for day traders, serving as a real-time measure of fair value and theRead definition → — supply the actual trigger.
Sector-Confirmed Strength vs. Chasing the Day's Top Gainer
This is not an entry-timing technique on its own — it's a filter that sits upstream of one. A stock can pass this framework's relative-strength test and still need a pullback, a trendline bounce, or a VWAP touch to actually define the entry, stop, and target. What this framework adds isn't a new trigger; it's confirmation that the trigger is being applied to a stock with real tailwind behind it, rather than to a stock moving in isolation.
The core idea has real academic grounding: industry-level momentum has been shown to explain a substantial share of what looks like individual stock momentum, with industry-based momentum strategies performing strongly even after controlling for size, valuation, and individual stock momentum separately. In practical terms, a stock's sector membership carries real, measurable information about its near-term behavior — which is exactly what this framework is built to exploit.
This is also not the same as simply screening for "the biggest gainer of the day." A stock can be the day's top percentage gainer while its entire sector sits flat or red, which under this framework is a materially weaker signal than a stock ranking, say, third in its sector while the sector itself is the day's strongest group. Rank within a leading group beats rank in isolation.
When Sector Dispersion Actually Exists
This framework depends on genuine sector dispersion — some sectors clearly outperforming, others clearly lagging, on a given day or over a given stretch. That kind of dispersion shows up reliably during genuine sector rotation, earnings season when a handful of bellwether reports move an entire group, and broad bull-market conditions where leadership rotates among sectors rather than everything moving in lockstep.
It works considerably worse during broad market panics and acute high-VIX conditions, when correlations across sectors tend to spike toward one — everything sells off together, dispersion collapses, and the "strong sector" half of the framework has nothing meaningful to identify. The framework needs the market to be discriminating between sectors to have anything to say.
Time of day matters less for the selection process itself, which can reasonably be done pre-market or on a daily chart, than for whichever entry method eventually gets applied. The entry timing follows that companion method's own best-conditions guidance — the standard 10:00 AM–3:00 PM ET window for most of this guide's pullback-style entries.
The Relative Strength Filter (Setup Specification)
Every component below is a hard rule for the selection stage. The actual entry, stop, and target come from whichever companion strategy is applied once the filter is satisfied.
- Component
- Market Conditions Required
- Rule
- Broad market (SPY or QQQ) not in an acute high-VIX panic where sector dispersion has collapsed
- Component
- Time of Day
- Rule
- Relative strength ranking can be done pre-market or on the daily chart; entry timing follows the companion strategy's own best-conditions window
- Component
- Stock Selection Criteria
- Rule
- Stock's percentage move over the chosen lookback exceeds its sector ETF's move over the same lookback; sector ETF's move over that lookback exceeds SPY's (or QQQ's) move; RVOL elevated versus the stock's own average
- Component
- Entry Trigger
- Rule
- Once both relative-strength layers confirm, apply this guide's pullback checklist, trendline bounce, structure continuation, or VWAP pullback entry as the actual trigger
- Component
- Stop Loss
- Rule
- Set by whichever companion strategy's mechanical stop rule is used for the entry
- Component
- Initial Profit Target
- Rule
- Set by the companion strategy, though targets can reasonably run further given the added sector tailwind
- Component
- Trade Management
- Rule
- As long as both relative-strength layers keep confirming, hold longer and trail wider than the companion strategy's default; exit the moment either layer flips negative
- Component
- Invalidation Criteria
- Rule
- The stock's relative strength versus its own sector flips negative, or the sector's relative strength versus the broad market flips negative — exit regardless of where the companion method's own stop currently sits
| Component | Rule |
|---|---|
| Market Conditions Required | Broad market (SPY or QQQ) not in an acute high-VIX panic where sector dispersion has collapsed |
| Time of Day | Relative strength ranking can be done pre-market or on the daily chart; entry timing follows the companion strategy's own best-conditions window |
| Stock Selection Criteria | Stock's percentage move over the chosen lookback exceeds its sector ETF's move over the same lookback; sector ETF's move over that lookback exceeds SPY's (or QQQ's) move; RVOL elevated versus the stock's own average |
| Entry Trigger | Once both relative-strength layers confirm, apply this guide's pullback checklist, trendline bounce, structure continuation, or VWAP pullback entry as the actual trigger |
| Stop Loss | Set by whichever companion strategy's mechanical stop rule is used for the entry |
| Initial Profit Target | Set by the companion strategy, though targets can reasonably run further given the added sector tailwind |
| Trade Management | As long as both relative-strength layers keep confirming, hold longer and trail wider than the companion strategy's default; exit the moment either layer flips negative |
| Invalidation Criteria | The stock's relative strength versus its own sector flips negative, or the sector's relative strength versus the broad market flips negative — exit regardless of where the companion method's own stop currently sits |
The lookback period has to be chosen and applied consistently. A single trading day's percentage move, a 5-day stretch, and a 20-day stretch will frequently produce different relative-strength rankings for the same stock. None of the three is objectively correct — what matters is picking one horizon that matches the trade's intended holding period and applying it the same way every time, rather than switching lookbacks until a favored stock happens to rank well.
Two layers of confirmation exist specifically to filter out isolated moves. A stock can spike on single-name news with nothing behind it sector-wide — that's a real move, but it's a materially different, more fragile trade than one backed by genuine sector-wide participation. Requiring both layers to align is what separates "this stock is hot" from "this stock is hot for a reason that's bigger than the stock itself."
Walk-Through Example: A Semiconductor Name Inside a Leading Sector
Consider a hypothetical semiconductor stock — call it JKL — inside a hypothetical semiconductor sector ETF, call it XLZ.
The sector layer: Over the prior five trading days, XLZ is up 6.5%, while SPY is up only 1.2% over the same stretch. The sector clears the first layer of the filter by a wide margin.
The stock layer: Within that sector, JKL is up 11% over the same five days — comfortably ahead of XLZ's own 6.5%. JKL clears the second layer too, and RVOL over the period confirms real participation rather than a single thin-volume spike.
Applying the companion entry: With both layers confirmed, JKL is now a qualifying candidate — but the filter alone doesn't say when to enter. JKL pulls back to its rising 20 EMA on declining volume and prints a bullish engulfing confirmation candle, satisfying this guide's pullback checklist. The entry, stop, and target all come from that companion strategy's own mechanical rules, exactly as they would on any stock passing that checklist alone.
What the added filter changes: The difference this framework makes shows up in trade management, not in the entry itself. As long as XLZ keeps outperforming SPY and JKL keeps outperforming XLZ, the trade has a standing reason to be held longer and trailed wider than a comparable pullback trade on a stock with no sector tailwind behind it. The moment either relative-strength layer flips — XLZ starts lagging SPY, or JKL starts lagging XLZ — that's the framework's own signal to tighten up or exit, independent of where the pullback checklist's own stop sits.
Tracking Relative Strength Throughout the Trade
The distinctive piece of trade management under this framework is tracking the two relative-strength layers throughout the life of the trade, not just at entry. A stock that qualified at the open can lose its sector-relative edge by midday even while the sector itself is still strong, and that's meaningful information the companion entry method's own stop-loss rule won't necessarily capture on its own.
Because two layers of confirmation are backing the trade, it's reasonable to give a qualifying position more room than the companion strategy's default — trailing behind a wider structure, or holding through a deeper pullback than would otherwise be tolerated — precisely because the sector-wide tailwind provides a second, independent reason to expect continuation.
Why Sector Leadership Rotates Faster Than You Think
The most damaging failure mode is sector leadership rotating faster than a trader notices. A sector can be the market's clear leader for a week and its clear laggard the following week, and a position held on the assumption that yesterday's leadership persists can give back the entire edge this framework was built to capture. The relative-strength layers need to be re-checked regularly, not assumed to be static once confirmed at entry.
There's a genuinely counterintuitive risk worth naming: during a broad market selloff, correlations across sectors tend to rise sharply, and a sector that looked genuinely differentiated during calm conditions can start moving in lockstep with everything else exactly when a trader most wants the "strong sector" diagnosis to still mean something. The framework's entire premise — that sector dispersion is real and informative — is weakest exactly when overall market stress is highest.
This approach also carries a real methodological limitation: the choice of lookback period isn't neutral. A stock can look like a clear relative-strength leader on a 1-day lookback and a laggard on a 20-day lookback, or vice versa, and there's no universally correct horizon to settle the disagreement. Traders need to pick a horizon that matches their actual holding period and stay consistent, rather than treating any single lookback as definitive.
Finally, the framework says nothing at all about entry timing on its own — a common mistake is treating a stock that passes both relative-strength layers as an automatic buy, without waiting for one of this guide's actual entry methods to confirm a specific, mechanical trigger.
Shorting Weakness and Adjusting the Lookback Window
Applying the mirror logic to shorts: The same two-layer logic works for weakness — a stock underperforming a sector that's itself underperforming the broad market is a double-confirmed short candidate, paired with a bearish trigger from any of this guide's reversal or breakdown-focused entry methods.
Adjusting the lookback for different holding periods: A trader looking to hold a position for the remainder of a single session might use a same-day percentage-change comparison, while a trader planning to hold over several sessions might use a 5- or 10-day lookback instead — the mechanics stay identical, only the measurement window changes.
Combining with market regime context: This guide's breakdown of identifying the market regime pairs naturally here, since the framework's usefulness depends heavily on whether the broader market is in a genuine dispersion-friendly regime or a correlated, panic-driven one.
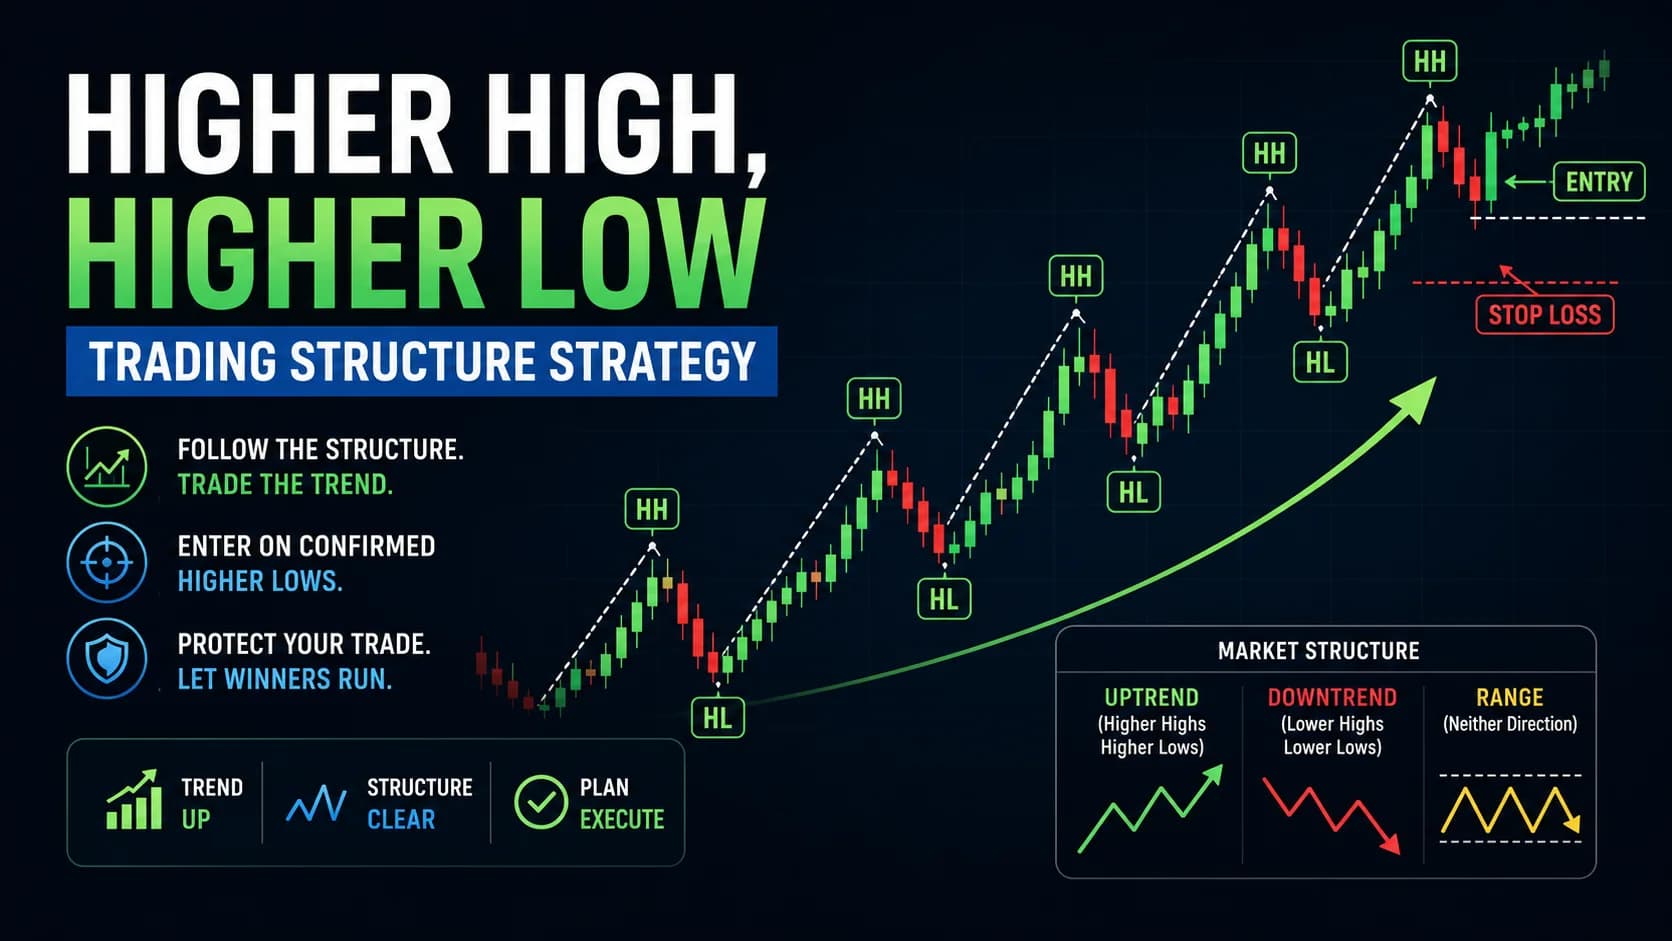
Using structure instead of a pullback for the trigger: Nothing about the relative-strength filter requires any specific companion strategy — this guide's market structure framework works equally well as the actual entry trigger once both relative-strength layers confirm, as would a trendline bounce or a VWAP pullback.
Screening for Sector and Stock-Level Relative Strength
Screening for sector-relative and market-relative performance across dozens of names manually isn't practical before the market even opens. Finviz offers heat maps and sector performance screens that make identifying which groups are actually leading a given session fast, which is the natural starting point for this framework's first layer.
For the second layer — confirming a specific stock's strength relative to its own sector ETF — TradingView makes it straightforward to overlay a stock's percentage-change chart directly against its sector ETF and against SPY, which visually confirms both layers of the filter at once.
Once a shortlist of double-confirmed candidates exists, Trade Ideas can scan for the volume and price behavior that signals a companion entry method's trigger is close to firing, cutting down the manual chart-watching needed across a full watchlist. Traders comparing current pricing can check the deals page for active offers.
Building a Relative-Strength Watchlist Routine
This framework is a filter for stock selection, and it fits into a trading plan as an upstream step that happens before any of this guide's entry-timing strategies get applied — not as a replacement for them. A trading plan built around this framework should specify the lookback period in writing, along with which companion entry method gets used, so the two decisions don't drift or get chosen after the fact to justify a trade a trader already wants to take.
Sticking to a pre-vetted, double-confirmed watchlist also requires real discipline, since the temptation to chase an exciting move outside that list is constant. This guide's breakdown of trading discipline covers why that kind of structured restraint has to be built into the routine rather than relied on as willpower in the moment. For other trend, range, and selection frameworks built the same way, this guide's full Strategies hub breaks down the complete library by market regime.
Strong-Stock-Strong-Sector FAQ
How do you actually calculate relative strength for this framework?
Percentage change puts stocks and ETFs of any price on the same footing, which raw price comparisons can't do. Pick a specific lookback (a single day, five days, twenty days) and calculate the percentage move for the stock, its sector ETF, and the broad market index over that identical window, then compare the three figures directly.
Key Takeaway: Relative strength is a percentage-change comparison over a fixed, consistent lookback — never raw price levels.
What lookback period should be used?
There's no universally correct lookback, and different windows can produce different rankings for the same stock. The practical solution is picking one horizon that fits how long the position is actually meant to be held and applying it consistently, rather than testing multiple lookbacks until one happens to favor a stock a trader already likes.
Key Takeaway: Match the lookback to the holding period, and don't switch it after the fact to fit a preferred conclusion.
What happens to this framework during a broad market selloff?
When nearly everything is falling together, the distinction between a "strong sector" and a "weak sector" becomes much less meaningful, since even genuinely strong sectors often get dragged down alongside weak ones during acute market stress. This is precisely when the framework's underlying assumption — that sectors behave differently from one another — breaks down the most.
Key Takeaway: This framework needs real sector dispersion to work, and dispersion shrinks fastest exactly when markets are under the most stress.
How is this different from just buying the day's biggest percentage gainer?
A stock can top the day's gainer list purely on single-name news while its sector sits flat, which is a fragile, isolated move rather than a broad, sector-supported one. This framework deliberately screens out that kind of isolated spike in favor of stocks whose strength is echoed at the sector level too.
Key Takeaway: Isolated strength and sector-confirmed strength look similar on a gainers list but behave very differently as trades.
How do you measure "sector strength" in practice — an ETF, or a basket of peers?
Building a custom basket of individual peer stocks can work too, but it requires more manual tracking than simply watching a single sector ETF's percentage change. For most day traders, a widely-traded sector ETF is accurate enough to serve as the second layer of this framework's filter without the extra overhead.
Key Takeaway: A sector ETF is the practical default proxy; a custom peer basket is a more effortful alternative.
Does this framework require one specific entry method, or does it work with any of them?
The filter's job is confirming that a stock has real, sector-backed strength behind it before a trade is considered at all. Once that's confirmed, whichever entry-timing method a trader already prefers supplies the specific entry, stop, and target.
Key Takeaway: This is a selection filter, not a competing entry system — it layers on top of whichever entry method is already in use.
What if the stock is strong but its sector is weak, or the reverse?
A strong stock in a weak sector is swimming against its own group, which raises the odds the strength is isolated and fragile. A strong sector with a specific laggard stock inside it suggests that particular name has company-specific problems even while its peers do well. Either mismatch is a reason to look elsewhere rather than a reason to proceed with reduced confidence.
Key Takeaway: A mismatch between the two layers disqualifies the setup entirely — it doesn't just weaken it.
How often does sector leadership actually rotate?
Academic research on industry-level momentum has found that industry leadership tends to persist for a period before fading, but the exact duration varies by market regime and industry. The practical implication is treating relative-strength confirmation as something to monitor continuously, not a one-time check performed only at entry.
Key Takeaway: Sector leadership isn't permanent — recheck both layers throughout the life of a trade, not just at the start.
Can this framework be automated or screened for?
A screener can rank stocks by their percentage move relative to their sector ETF, and sector ETFs relative to the broad market, entirely mechanically. What still requires a trader's active involvement is applying the chosen entry-timing method's own judgment calls — reading a confirmation candle, marking a valid swing point, or confirming a VWAP volume signature.
Key Takeaway: The selection filter is fully screenable; the entry trigger still depends on the companion method's own requirements.
Should the relative-strength check happen only at entry, or throughout the trade?
A position can remain technically above its companion strategy's stop-loss while the sector or stock-level relative strength has already deteriorated, which is exactly the situation where sticking with a trade purely because the price-based stop hasn't been hit yet ignores the framework's own most useful signal.
Key Takeaway: Recheck both relative-strength layers continuously — a flip in either one is its own exit signal, separate from the price-based stop.
Article Sources
- Moskowitz & Grinblatt, "Do Industries Explain Momentum?" (1999), Journal of Finance - foundational academic research finding that industry-level momentum accounts for much of the individual stock momentum anomaly, and that industry momentum strategies remain profitable after controlling for size, valuation, and individual stock momentum.onlinelibrary.wiley.com
- Jegadeesh & Titman, "Returns to Buying Winners and Selling Losers" (1993), Journal of Finance - the foundational academic study establishing that price trends exhibit statistically significant continuation, underlying this guide's broader momentum-based framing.onlinelibrary.wiley.com
- Investopedia: Relative Strength - reference for the standard definition and calculation of relative strength as a comparative technical measure.investopedia.com
- StockCharts ChartSchool - reference for standard relative-performance charting conventions used throughout this guide.chartschool.stockcharts.com