
A Trader's Playbook for Trend Days: How to Maximize One-Sided Markets

In this article13 sections
It's 10:15 AM. You're up three times your average daily profit. The stock you're in has done nothing but climb — clean, relentless, almost mechanical. And so you do what feels responsible. You take the gain, click close, and start scanning for the next setup.
For the next four hours, you watch the stock add another 14% without you.
That's not a hypothetical. That's what trend days do to people who aren't prepared for them. Not because those traders were reckless — but because they treated a trend day like any other day. Same rules, same targets, same instinct to lock in and move on. On most days, that discipline keeps you out of trouble. On trend days, it bleeds you dry of opportunity.
Here's the uncomfortable truth: the handful of genuine trend days that occur in a given year often account for a disproportionate chunk of a skilled trader's annual profit. Getting these days right — identifying them early, entering correctly, and staying in long enough — is one of the highest-leverage skills in day trading. Most traders never develop it.
This playbook covers exactly how to build it.
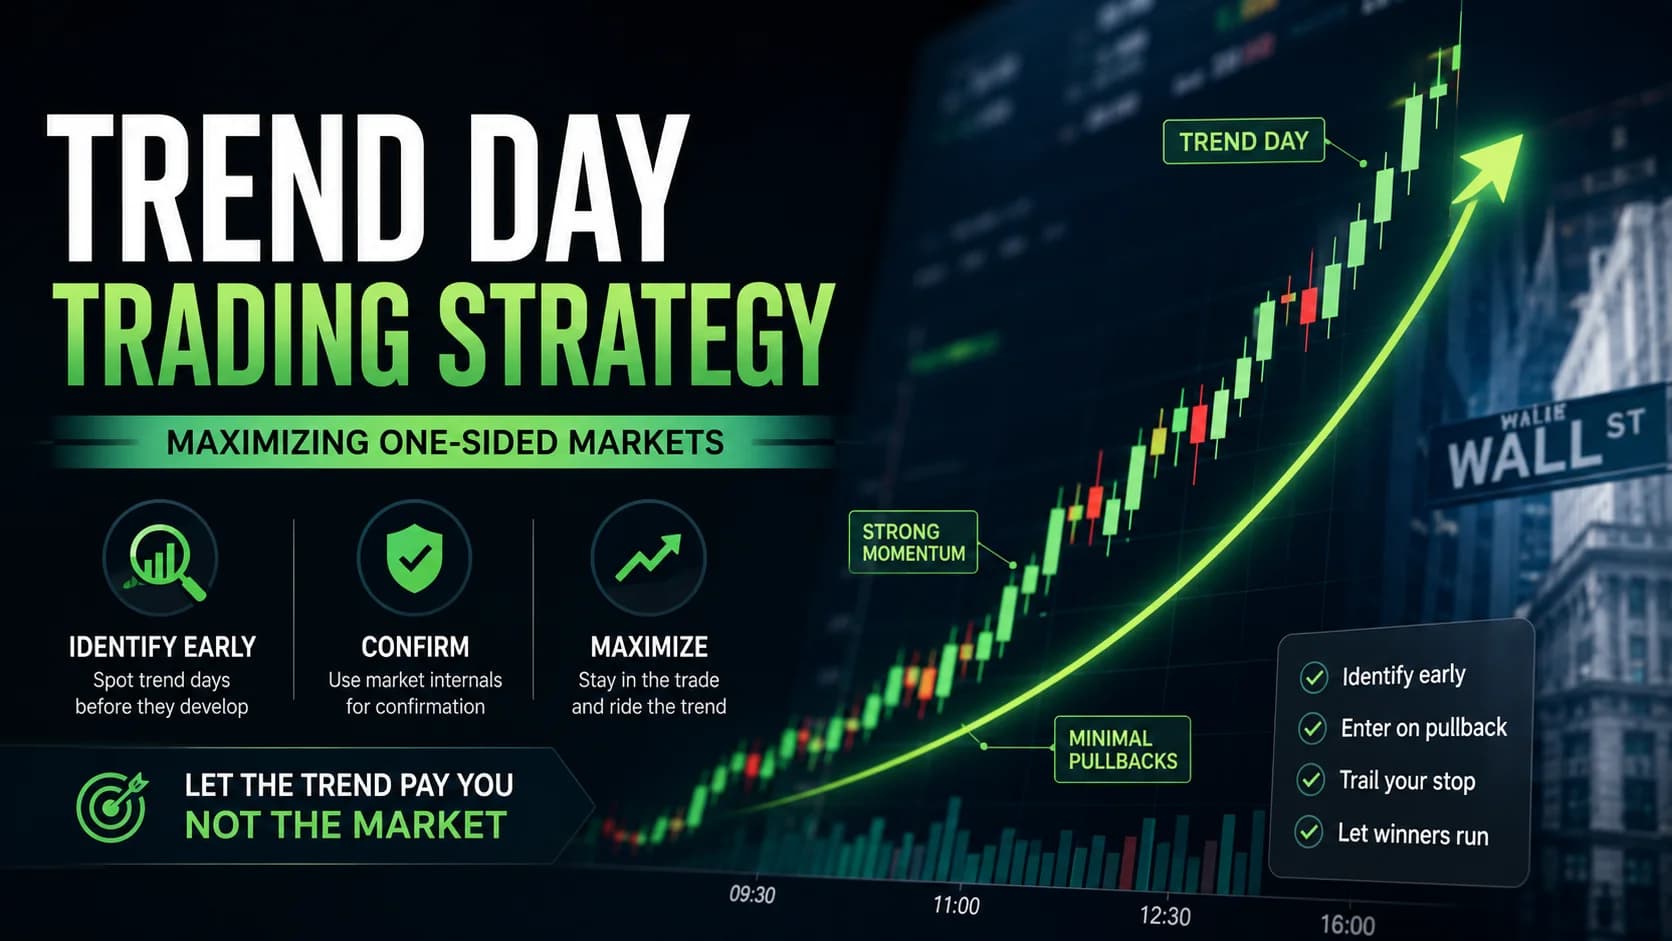
What is a trend day in trading? A trend day is a session where price opens near one extreme of its daily range and closes near the opposite, with minimal meaningful pullbacks in between. One side of the market — buyers or sellers — holds control from the opening bell to the close. Most intraday resistance levels get absorbed, dips get bought almost immediately, and mean-reversion setups that work on ordinary days fail repeatedly.
Quick Answer
A trend day is a session where one directional move dominates all day with minimal retracement. To trade it effectively, you must identify it early using pre-market signals and market internals, enter on the first pullback after the opening move confirms, and then manage with a trailing stop rather than a fixed target — letting the market tell you when the day is over rather than deciding for yourself.
What This Strategy Is (And What It Absolutely Isn't)
Let's be precise about what we mean before diving into mechanics.
A trend day strategy is not about predicting the market's direction for the day. You're not making a macro call. You're learning to recognize, in real time, that the market has already chosen a direction — and then getting out of its way while staying positioned in that direction as long as possible.
This is a fundamentally different mindset than most intraday strategies. Breakout trading is about anticipating expansion. Pullback trading is about buying weakness inside a trend. Mean-reversion trading is about fading extremes. Trend day trading is about none of those things specifically — it's about recognizing the character of the session you're in and adapting your entire ruleset accordingly.
On a true trend day, these things are true that aren't true on regular days:
Buying strength works. On a normal choppy day, buying after a big move up gets you caught in a reversal. On a trend day, that same behavior prints a profit because there is no meaningful reversal.
Profit targets kill you. A fixed $0.50 or 1R target that protects capital on a range day leaves you flat while the move continues for another $3.00.
Mean-reversion setups fail. The RSI that reads 80 and screams "overbought" on a range day just keeps climbing on a trend day.
What this strategy asks of you is uncomfortable: hold longer than feels safe, add to a winning position when every instinct says to take money off the table, and refuse to fade the move no matter how extended it looks.
That's a psychological challenge as much as a technical one. Our Trading Psychology hub covers the emotional side of discipline in depth — but the mechanical rules come first.
When Trend Days Occur — And How Often
Before you can trade trend days, you need an accurate picture of how rare they actually are.
Based on backtesting data covering a decade of S&P 500 sessions, genuine trend days occur roughly 35–40 times per year — approximately 15–16% of all trading sessions. That's about one real trend day every six or seven trading days. The rest of the time, the market chops, rotates, opens strong and fades, or whipsaws around a mean.
This matters for two reasons. First, it means you'll have long stretches where trend day setups simply don't appear, and the worst thing you can do is force the setup when conditions don't support it. Second, it raises the stakes on the days when conditions are right — because these sessions are the minority.
Trend days cluster around specific conditions. Knowing what creates them is half the identification battle.
Major economic catalysts. Federal Reserve rate decisions, Non-Farm Payroll reports, CPI releases, and other high-impact data points create the kind of one-sided institutional conviction that drives trend days. When the data surprises — meaningfully beats or misses expectations — participants are forced to reprice assets quickly and in one direction.
Elevated overnight futures ranges. When index futures (the /ES for S&P 500, /NQ for Nasdaq) trade through a wide range overnight and hold near the extreme into the regular session open, that directional pressure often continues. The "conversation" between buyers and sellers has already started before 9:30 AM ET, and one side is winning it.
Gap opens above prior volatility compression. When the daily chart has been building a tight range — low ATR, compressed candles — for several sessions and then gaps out of that range with conviction, a trend day frequently follows. The compression was building energy; the gap is the release.
Unusually large pre-market volume. High pre-market volume on index ETFs (SPY, QQQ) with directional bias is a meaningful signal. Light pre-market volume on a gap suggests institutional absence, which reduces the probability of sustained trending. Heavy pre-market volume suggests major participants are already positioning.
None of these conditions guarantee a trend day. They raise the probability and put you in the right posture going into the open.

The Pre-Market Checklist: Building Your Bias Before 9:30 AM
Every serious trend day trader runs through a structured pre-market process. Not because the market owes you confirmation — it doesn't — but because the overnight inputs give you context for what you're watching when the bell rings.
Here's what our team reviews before the open on any morning that has trend day potential:
Futures direction and range. Are /ES or /NQ sitting at a clean high or low relative to the prior session? A futures market that has grinded in one direction all night and is sitting at the extreme of its range as 9:30 approaches is far more likely to continue than reverse.
Gap size relative to average true range. A gap of 0.5% or more on SPY is worth attention. A gap of 1%+ that holds through the pre-market session without any fade is a meaningful signal.
Pre-market volume on SPY/QQQ. By 9:00 AM ET, you have a reasonable read on whether institutional participation is elevated. Volume running at 2x or more of the typical pre-market pace suggests serious positioning.
Any scheduled high-impact catalysts. If the Fed is speaking, a major CPI print hit at 8:30 AM, or a geopolitical event is unfolding, that's context for why the futures are behaving as they are — and whether the move has underlying conviction or is a knee-jerk that's likely to fade.
This pre-market read builds your bias — not a prediction. It tells you which scenario you're looking for confirmation of when the session opens.
Confirming the Trend Day: Market Internals in the First 30 Minutes
Pre-market signals raise the probability. Market internals confirm it.
This is the piece most retail traders skip entirely — and it's the reason they get caught on the wrong side or miss the day's biggest move. Learning to read market internals is the single fastest upgrade available to a trader trying to capitalize on trend days.
Three internals matter here. All three are available on most professional platforms and are tracked using NYSE-based data.
The NYSE TICK ($TICK). This measures the number of NYSE stocks ticking up minus those ticking down at any given moment. On a range day, TICK bounces between roughly +800 and -800, and you can fade the extremes. On a trend day, TICK clusters persistently positive (or negative) — making higher lows on a bullish day, rarely crossing below zero, and occasionally spiking to +1,200 or higher. That clustering pattern is a clear signal that broad buying pressure is sustained, not a momentary burst.
The NYSE Advance-Decline Line ($ADD). ADD tracks the cumulative difference between advancing and declining stocks throughout the session. Unlike TICK, which is a snapshot, ADD accumulates over time and tells you whether the move has broad participation. A reading above +1,500 within the first 60 minutes of the session has historically identified trend days approximately 70% of the time. When ADD climbs from +800 at 9:40 AM to +1,200 at 9:50 AM and +1,600 by 10:00 AM without reversing, that's broad participation — not a large-cap-driven illusion.
The NYSE Volume Difference ($VOLD). VOLD compares the volume flowing into advancing stocks versus declining stocks. This is the internal that catches what ADD misses: 300 stocks can be advancing, but if they're all small-caps with thin volume while the declining side carries the big institutional names, the true pressure is bearish. VOLD shows you where the real money is moving. On a genuine bullish trend day, VOLD climbs steadily and stays firmly positive throughout the morning.
When all three align — TICK clustering high, ADD in extreme territory and building, VOLD firmly positive — you have the strongest possible confirmation that the session has trending character. Combining all three internals increases trend day identification accuracy to over 80%, compared to roughly 70% from ADD alone.
The confirmation window is roughly the first 30–45 minutes of the session. If internals are aligned and strengthening by 10:00–10:15 AM ET, the trend day framework is in effect.
One important nuance: on FOMC days, internals before the announcement (typically 2:00 PM ET) carry almost no signal — traders are hedging and positioning defensively. The real internals read begins in the 30 minutes after the statement drops. This is the scenario where you wait, watch the announcement, then apply the trend day framework if internals immediately align in one direction.
Setup Specification: The Hard Rules
Once pre-market conditions and opening internals confirm a trend day, the playbook shifts into execution mode. Here are the rules, stated with the precision you need to actually apply them.
- Parameter
- Market Condition Required
- Specification
- Trend day confirmed: pre-market signals present, internals aligned within first 30–45 minutes
- Parameter
- Time of Day
- Specification
- Primary entry window: 9:50–10:30 AM ET on the first clean pullback after trend confirmation
- Parameter
- Stock / Instrument Selection
- Specification
- Index ETFs (SPY, QQQ) or the leading sector ETF of the day; individual stocks showing the strongest relative strength (or weakness) with above-average RVOL
- Parameter
- Entry Trigger
- Specification
- First pullback to the 9 EMA or VWAP that holds (doesn't break) and resumes the primary direction. Enter on the first candle close in the direction of the trend after the pullback.
- Parameter
- Stop Loss
- Specification
- Below (or above, for shorts) the most recent swing low (or high) of the pullback. Move stop to breakeven after price advances 1R.
- Parameter
- Initial Profit Target
- Specification
- None. This is a trend day — fixed targets are the enemy. Manage with a trailing stop instead.
- Parameter
- Trailing Stop Method
- Specification
- Trail stop below each successive swing low (5-min chart) on a bullish trend day. Alternatively, trail below the 9 EMA on the 5-minute chart, giving one candle of buffer.
- Parameter
- Invalidation
- Specification
- ADD reverses sharply and crosses below zero. Price makes a lower low and internals confirm. The initial trend move fully reverses without catalyst.
- Parameter
- Scale-Out Plan
- Specification
- Trim 25–33% at 2R as a mental concession if needed; hold the remainder with trailing stop through the session.
| Parameter | Specification |
|---|---|
| Market Condition Required | Trend day confirmed: pre-market signals present, internals aligned within first 30–45 minutes |
| Time of Day | Primary entry window: 9:50–10:30 AM ET on the first clean pullback after trend confirmation |
| Stock / Instrument Selection | Index ETFs (SPY, QQQ) or the leading sector ETF of the day; individual stocks showing the strongest relative strength (or weakness) with above-average RVOL |
| Entry Trigger | First pullback to the 9 EMA or VWAP that holds (doesn't break) and resumes the primary direction. Enter on the first candle close in the direction of the trend after the pullback. |
| Stop Loss | Below (or above, for shorts) the most recent swing low (or high) of the pullback. Move stop to breakeven after price advances 1R. |
| Initial Profit Target | None. This is a trend day — fixed targets are the enemy. Manage with a trailing stop instead. |
| Trailing Stop Method | Trail stop below each successive swing low (5-min chart) on a bullish trend day. Alternatively, trail below the 9 EMA on the 5-minute chart, giving one candle of buffer. |
| Invalidation | ADD reverses sharply and crosses below zero. Price makes a lower low and internals confirm. The initial trend move fully reverses without catalyst. |
| Scale-Out Plan | Trim 25–33% at 2R as a mental concession if needed; hold the remainder with trailing stop through the session. |
The entry logic deserves a few extra sentences. On a genuine trend day, the "first pullback" is usually brief and shallow — price retraces to the 9 EMA or VWAP on lighter volume, forms one or two hesitation candles, then resumes. That hesitation is your entry signal. It will feel too late — the move has already started, the pre-market gap was already large, and part of your brain will insist you missed it. You haven't. The real trend day move often extends far beyond what feels like the "late entry."
The stop placement is mechanical: below the swing low of the pullback. On a real trend day, price does not break that low again. If it does, something has changed and you need to be out.
Walk-Through: How a Trend Day Unfolds in Real Time
Here's a narrated example using hypothetical but structurally accurate price action. We'll use a mega-cap tech ETF — call it XYZ.
Overnight, XYZ futures have been grinding higher since midnight, sitting about 1.8% above yesterday's close as the 9:30 AM open approaches. The overnight range is clean — not volatile, just steady directional grinding. Pre-market volume by 9:15 AM is running at roughly 2.5 times the typical pace. A CPI report released at 8:30 AM came in cooler than expected, and institutions are recalibrating.
The bell rings. XYZ opens at $187.40, up from yesterday's close of $183.92. In the first five minutes, it rips to $189.15. Your TICK panel is surging — readings clustering between +800 and +1,200 with no dips below +200. ADD opens at +1,100 and climbs to +1,600 by 9:45 AM. VOLD is firmly and cleanly positive.
By 9:50 AM, it's confirmed: this is a trend day.
XYZ begins to pull back — not aggressively, just a drift. Volume on the pullback is notably lighter than on the initial thrust. Price comes back to $188.20, right at the rising 9 EMA on the 5-minute chart. One 5-minute candle forms a small-bodied doji at that level. The next candle opens and moves higher — $188.40, then $188.60 within the first two minutes.
That's the entry. You get filled at $188.65. Your stop goes below the pullback low at $188.10 — 55 cents of risk. Your position size is calculated accordingly using proper risk management (our Position Size Calculator handles this math instantly).
By 11:00 AM, XYZ is trading at $191.30. Your trailing stop is now below the 9 EMA at approximately $190.40. ADD is still trending above +1,800. TICK is making new intraday highs. You resist the urge to take profit.
Noon. XYZ sits at $192.80. The first real pause of the day — fifteen minutes of sideways action between $192.50 and $193.10. Your trailing stop is now at $191.80. Internals are still aligned, so you don't exit.
By 1:30 PM, XYZ is at $194.20. Volume has picked up again. ADD pushes above +2,000. The afternoon continuation pattern on bullish trend days is often the strongest leg of the move — institutional accumulation continuing into the close.
At 3:45 PM, XYZ makes one more push to $195.80. ADD starts to flatten. TICK prints a divergence — price makes a new high but TICK doesn't. Your trailing stop, now at $194.60, triggers at 3:52 PM as the final sell-off into close begins.
Your entry was $188.65. Your exit was $194.60. You held through multiple pullbacks that felt uncomfortable, ignored a fixed target that would have taken you out at $191.00, and ended the day with 6.0R on a single trade.
That's what a trend day, traded correctly, looks like.
Trade Management: The Discipline That Makes the Difference
Everything we've described above is pattern identification. What separates traders who capitalize on trend days from those who watch them from the sidelines is trade management — specifically, what you do in the hours between entry and exit.
Resist the daily goal trap. If your daily profit goal is, say, 2R, you might hit it by 10:45 AM on a trend day and feel the pull to lock in and walk away. This is the single most costly behavior specific to trend days. The goal was designed for an average day. Trend days are not average days.
Add to winners, not just hold. Pyramiding — adding to a position as it proves itself correct — is the advanced version of this strategy. The rules are strict: add only on clean pullbacks that hold the appropriate level (9 EMA, VWAP), use a smaller size for each additional unit than the initial entry, and only add when internals remain aligned. This isn't for everyone, and it's covered in depth in our Pyramiding Into Winners guide. But it's worth knowing that this is what professionals often do on confirmed trend days.
Let the trailing stop do the work. Your job after entry is not to decide when the trend is over. Your job is to trail the stop and let the market tell you. The discipline is in not second-guessing the exit — trusting that the trailing stop below the 9 EMA or the most recent swing low will catch the turn when it genuinely occurs.
Monitor internals through the day. A trend day that exhausts often shows internals deteriorating before price does. If ADD starts flattening or reversing while price continues to push, that divergence is your earliest warning. You don't exit immediately on the first sign of internal weakness — but you tighten your trailing stop and don't add to the position.
The afternoon fade is NOT a failure. Genuine trend days often see the last 30–45 minutes of the session digest gains or even pull back modestly as traders close positions. This is normal and shouldn't chase you out prematurely. Only a sharp reversal with volume and internal confirmation warrants an active exit before your trailing stop triggers.
Where This Strategy Fails
We'd be doing you a disservice if we didn't spend real time here.
The misidentified trend day. The most dangerous scenario is a day that looks like a trend day in the first hour but isn't. Pre-market had the right signals, the opening move was strong — but it's a fake-out. The internals begin to diverge from price, ADD plateaus and then reverses, and suddenly the "trend day" is a volatile range day with a big wick on both ends. This is why hard stop losses are non-negotiable. The stop below the pullback swing low is your protection against this scenario. Take the loss and live to fight the next confirmed trend day.
Entering too early, before confirmation. Impatient traders jump in at the open based on pre-market signals alone — before internals have had time to confirm. This is entering on bias, not confirmation, and it frequently results in getting caught in the opening noise. Wait. The first 15–30 minutes exist to let the market show its hand.
Averaging into a losing position. On a trend day that goes against you — meaning you thought it was bullish but it's actually a bearish trend day — the temptation is to buy the dip and average down. This is catastrophic. A bearish trend day that's truly one-sided will not give you a meaningful bounce to exit. Losses compound quickly. One hard rule: no averaging into losses on any suspected trend day in either direction.
Fading the move in the afternoon. Some traders see the day's 5% gain on a stock, decide it's overbought, and short into the close. On a trend day, this is often the worst trade of the day. Trend days tend to close near the extreme. The "obvious" fade is usually wrong.
Low-float small-cap trend days require different rules. The mechanics described here apply to index ETFs and high-liquidity large-cap stocks. Low-float small-cap stocks running on news can produce what looks like a trend day setup but with execution risks (wide spreads, thin book, halts, sudden reversals) that make the playbook unreliable. If you're trading small-caps, you need a different framework — see our Momentum Day Trading Strategy and Low Float Runner Strategy guides.
Variations and Adaptations
The Sector Rotation Trend Day. Sometimes the broader market is choppy but a specific sector is trending strongly — energy stocks on an oil supply shock, biotech on a major FDA approval, financials after an interest rate surprise. You can apply the exact same framework to sector ETFs (XLE, XBI, XLF) or the leading individual stocks in that sector, using sector-specific ADD data where available and the sector ETF price action as your confirmation.
The Individual Stock Trend Day. Any stock experiencing a major catalyst — a blowout earnings report, a buyout announcement, a significant FDA decision — can have its own trend day entirely disconnected from the broader market. The internals approach doesn't apply here (you're watching the stock itself, not the NYSE breadth), but the price-action rules do: first pullback entry, VWAP as the anchor level, trailing stop below swing lows, no fixed targets.
The Bearish Trend Day. Everything above applies in reverse. The language in this article is naturally skewed toward bullish examples because bull trend days are more intuitive to learn, but bearish trend days follow identical mechanics: ADD deep negative (below -1,500 and building), TICK clustering persistently low, VOLD firmly negative, entry on the first pullback (bounce) that fails to sustain, short position with stop above the pullback high, trailing stop above declining swing highs.
Tools You'll Need
Reading market internals requires a platform that actually provides them. Not all retail platforms do, and those that do often bury them. TICK, ADD, and VOLD are index tickers ($TICK, $ADD, $VOLD on most platforms) available on ThinkOrSwim, TradingView Pro+, and professional-grade platforms.
For scanning — identifying which stocks are showing the strongest relative strength on a trend day, or finding the leading sector ETF to position in — a real-time scanner that can filter by RVOL, gap percentage, and sector on the fly is essential. Trade Ideas is the platform our team uses for this: its Holly AI alerts and real-time scanning filters let you quickly identify the highest-conviction names on trend days without manually watching 50 charts. On a bullish trend day, you want to be in the stocks with the highest RVOL and cleanest price structure — and a good scanner surfaces those in seconds. For full details on our toolkit, see the Day Trading Toolkit page.
On the execution side, trend days reward clean, fast execution. Order management matters — particularly the ability to set and adjust trailing stops efficiently.
How Trend Day Trading Fits Your Complete Plan
Trend day trading is not a standalone strategy you run every day. It's a mode — a framework that replaces your normal rule set when specific market conditions are confirmed.
Most of the time, your standard approaches apply: range trading in choppy conditions, pullback setups in trending environments, breakout plays where volume supports them. The trend day playbook sits beside all of this, activated only when the morning's signals say "today is different."
The practical implication: you need to review pre-market conditions every morning, maintain a checklist for the first 30 minutes of the session, and have a decision protocol that says "if these conditions are confirmed by 10:00 AM, I am switching to trend day rules." Without that explicit protocol, the default human tendency is to keep doing what worked yesterday — which is exactly what gets traders chopped up on the rare days when the market is truly one-sided.
Beyond trend day mechanics, this strategy fits within a larger understanding of market character. The Ultimate Trend Following Strategy Guide provides the broader framework for understanding when trends form and sustain across multiple timeframes. The trend day playbook is the intraday-specific application of those same principles. Our overview of all day trading strategies can help you see how this setup fits alongside others in a complete trading approach.
Track every trend day you observe — whether you traded it or not. How did you identify it (or fail to)? What were the internals doing? How did it compare to sessions you mistakenly identified as trend days? This log becomes enormously valuable over time. Pattern recognition on trend days is a skill that develops through repetition, and a documented history accelerates that development.
Frequently Asked Questions
How do I know within the first hour whether it's really a trend day?
The 30–60 minute window is your confirmation zone. Pre-market signals tell you what might happen; internals in the first hour tell you what is happening. ADD above +1,500 within the first 60 minutes has historically been correct about 70% of the time. When you add TICK and VOLD alignment, that figure rises above 80%. You don't need all three to be at extreme levels simultaneously — you need all three to be directionally consistent and building, not flattening or reversing.
Key Takeaway: Never commit to the full trend day framework based on pre-market signals alone — let the first 30 minutes of internals confirm it before switching modes.
Is the pullback entry required, or can I enter on the initial breakout?
The opening 15 minutes of even a confirmed trend day often involve elevated volatility, wider spreads, and institutional order flow that can print sharp wicks in either direction. Entering right at the open exposes you to getting stopped out of a position that would have worked if held through the opening noise. The pullback — even if shallow, even if it only lasts two or three candles — gives you a defined swing low (or high) to place your stop below (or above), which makes position sizing precise and the trade mechanically clean. Yes, you might miss 10–15% of the initial move. You get it back in confidence and cleaner risk management.
Key Takeaway: Wait for the first pullback to a key level (9 EMA, VWAP) after internal confirmation, then enter on the first candle close resuming the trend direction.
How is a trend day different from a regular strong trending day?
The practical difference is that strategies which work on a "regular" trending day — buying oversold RSI readings, fading breakouts, targeting prior resistance as exits — fail repeatedly on a trend day. The market "should" pull back from a level that it just blows through. Your RSI should be telling you it's overbought at a level the stock clears and keeps climbing. The character of the market is different, not just the magnitude of the move.
Key Takeaway: Trend days are defined by the shallow nature of intraday pullbacks and the persistence of directional pressure — not merely by the size of the day's move.
What happens if I'm wrong and it turns into a range day by 11:00 AM?
This is exactly why stop discipline is non-negotiable. If you entered on what looked like a trend day and internals reverse — ADD drops from +1,600 back below +500 and then goes negative, price breaks the pullback swing low — the trade is no longer valid. You exit with whatever loss your stop dictates. The capital you preserve is what lets you participate in the next genuine trend day. No trade management technique can save you from a bad scenario if you don't have a stop in place.
Key Takeaway: A properly-placed stop on the trend day entry keeps a misidentified session from becoming a large loss — take the small loss and move on.
Should I use the same position size on trend days as on normal days?
The logic: starting at 50–75% of normal size and adding on the first pyramid point (the next clean pullback after an initial extension) means you're at or above normal size by the time the trade is confirmed by price action. You've paid a small size discount for an insurance policy against misidentification. If the trade immediately invalidates, you lost less on the entry unit. If it confirms and extends, you add up to or above your standard size. Our Pyramiding Into Winners guide details the full mechanics.
Key Takeaway: Sizing into a trend day position as it proves itself is a professional approach to managing the misidentification risk without sacrificing upside.
Why don't fixed profit targets work on trend days?
The median trend day on major indices extends to 1.5–2 times the average true range (ATR). If your fixed target is 1R or even 2R, you'll exit long before the move is over on the majority of trend days. More insidiously, taking profits at a fixed target creates an anchoring problem — you define the trade as "complete" when it's not, and watching it continue generates an impulse to re-enter at a worse level. The trailing stop behind the 9 EMA or the most recent swing low doesn't define an endpoint; it simply follows the market and catches the exit when the trend actually stalls.
Key Takeaway: Use trailing stops anchored to price structure (9 EMA, swing lows) rather than fixed profit targets on confirmed trend days — the market's own momentum is a better exit signal than any number you pick in the morning.
Can I trade against a trend day — short the upside or buy the downside?
On a genuine bullish trend day, the short side is a constant stream of failed reversal trades. Sellers get absorbed repeatedly — short sellers who enter at each "obvious" resistance level get squeezed higher, adding fuel to the very move they tried to fade. Experienced traders sometimes attempt quick counter-trend scalps in the final 30 minutes when a trend day shows clear exhaustion signals (TICK divergence, ADD flattening), but this is an advanced, low-probability play that our team treats as entirely separate from the trend day playbook. For new and intermediate traders, the rule is absolute: trade with the trend or sit on the sidelines.
Key Takeaway: Fading a confirmed trend day — for any reason, at any level — is an extremely low-probability trade. The one job on a trend day is to find entries in the direction of the trend.
How do I avoid confusing a "strong morning" with a full trend day?
This is the most common misidentification error. The opening 30 minutes of almost every session has elevated internals — that's normal opening excitement. The question is what happens after that initial energy settles. On a range day, ADD will peak and then drift back toward zero by late morning. On a trend day, ADD holds above +1,200 or +1,500 through the 11:00 AM–1:00 PM period and often extends into the afternoon. Watching the shape of the ADD curve — not just the level — gives you a read on whether early momentum is real or is decaying.
Key Takeaway: Sustained internal readings through the lunch hour (11:30 AM–1:00 PM ET) are the clearest sign that a genuine trend day — not just a strong opening — is unfolding.
Disclaimer
Article Sources
- cmegroup.com - CME Group — Understanding Market Structure and Intraday Price Behavior. CME's educational resources on futures market mechanics and the role of institutional order flow in creating directional sessions.
- nyse.com - NYSE — Advance-Decline Data and Market Breadth Resources. Primary source for understanding how the NYSE Advance-Decline line is constructed and its application in measuring market breadth.
- ssrn.com - Barber, B., Lee, Y., Liu, Y., and Odean, T. — "Do Day Traders Rationally Learn About Their Ability?" (2014). SSRN research paper documenting performance patterns in active day trading, including the concentration of returns on high-momentum days.
- cboe.com - CBOE — VIX Methodology and Volatility Index Data. CBOE documentation on how VIX is calculated and how elevated volatility environments affect intraday market character.
- stockcharts.com/school - StockCharts ChartSchool — Moving Averages and Market Breadth Indicators. Authoritative technical analysis reference for exponential moving average mechanics, breadth indicator construction, and their application in trend identification.
- bls.gov - U.S. Bureau of Labor Statistics — CPI Report Release Calendar. Primary source for the Consumer Price Index release schedule, one of the key macro catalysts that creates trend day conditions.
Was this helpful?
Be the first to weigh in

Written by
Kazi Mezanur RahmanFounder, independent researcher, and editor of DayTradingToolkit. A one-person publication focused on risk-first trading education and documented tool research. He trades his own capital as a retail trader and combines personal market experience with systematic primary-source research.
Keep Reading

Strategies
The Ultimate Trend Following Strategy Guide
Learn DayTradingToolkit's 5-step trend following strategy. This ultimate guide provides a complete system for riding trends with confidence and maximizing profits.
Strategies
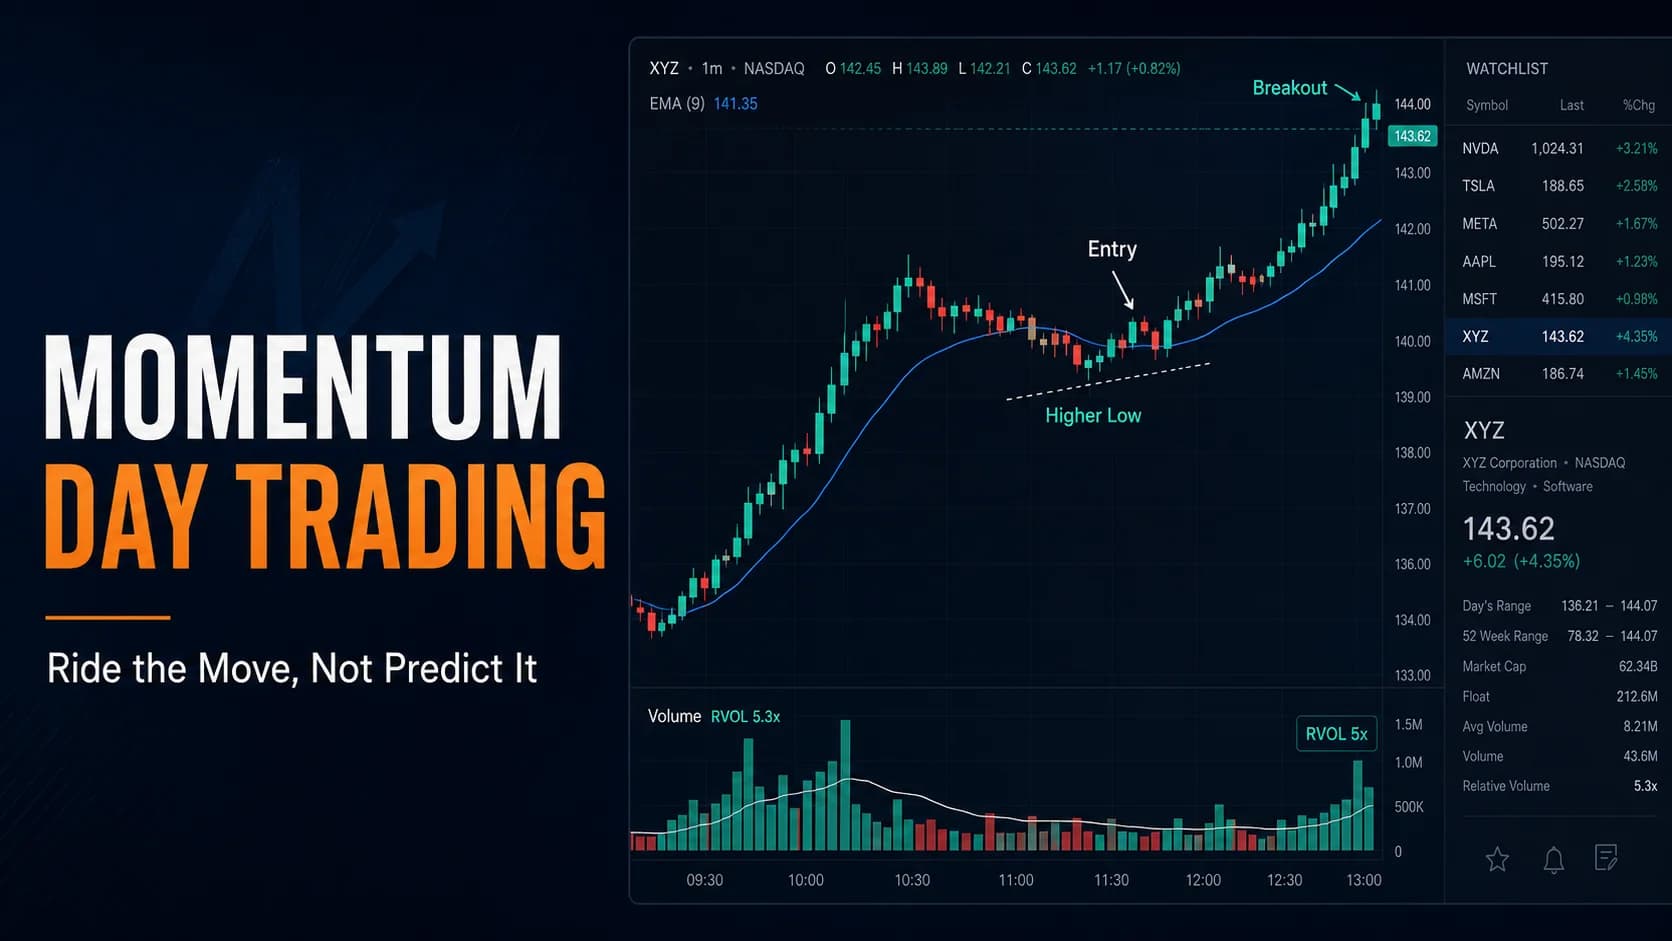
The Momentum Day Trading Strategy: Riding Stocks That Are Moving
Academic momentum research is about months, not minutes. This guide covers what transfers to intraday trading and the mechanical setup for riding a mover.
Strategies
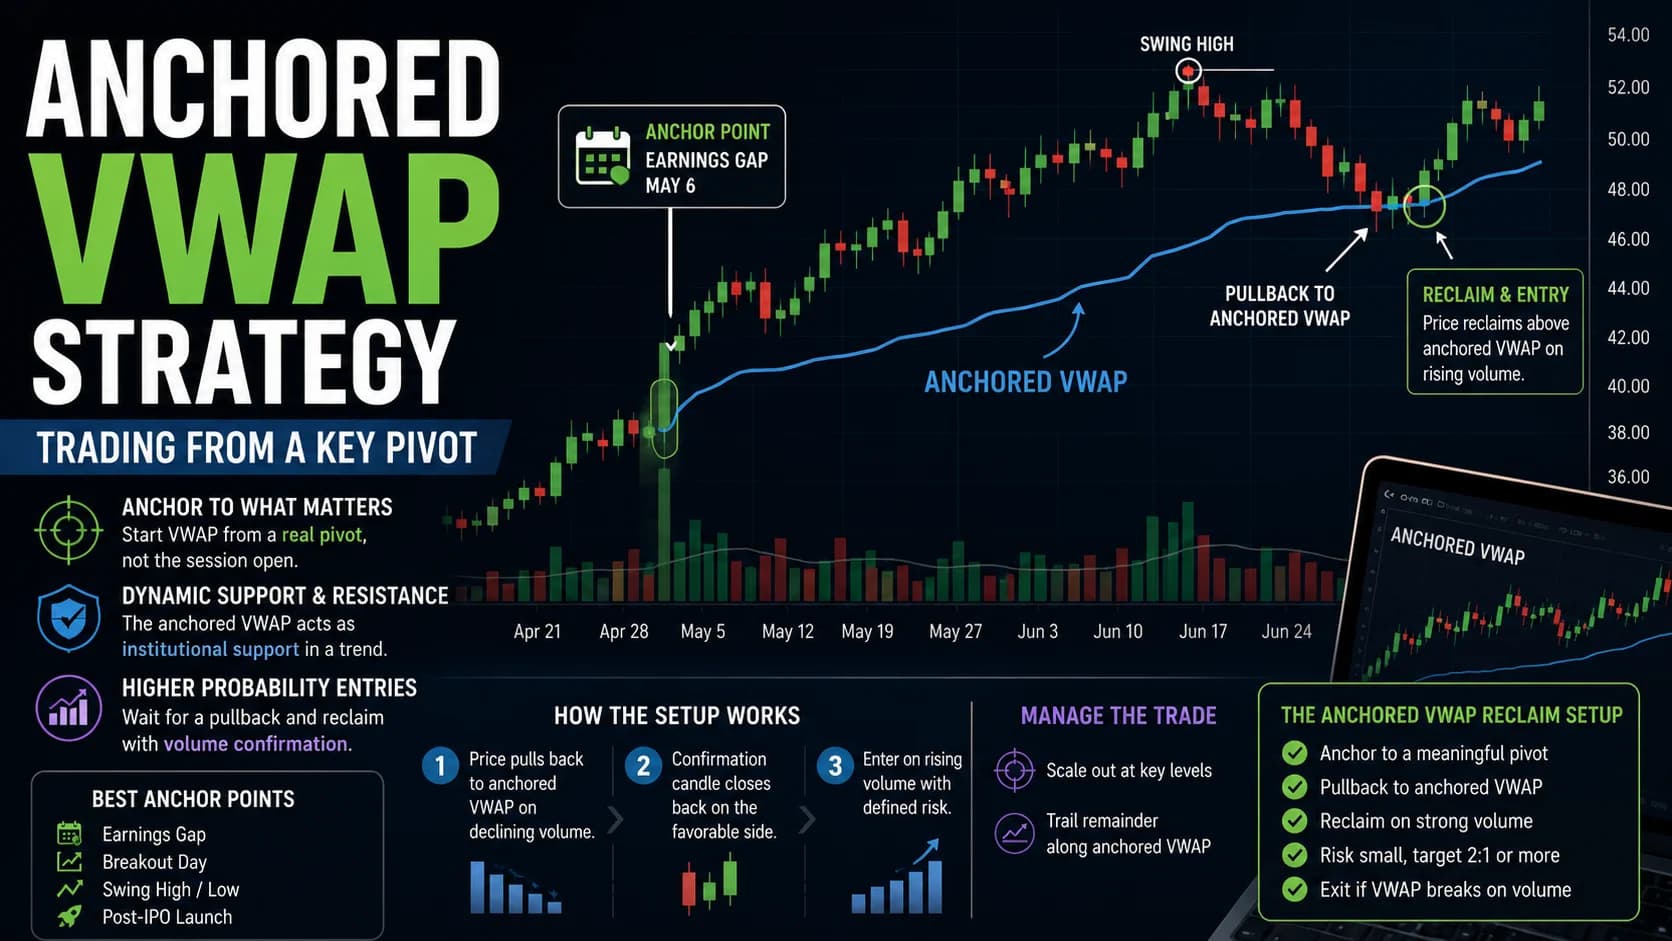
The Anchored VWAP Trend Strategy for Day Traders
The anchored VWAP trading strategy: how to pick a genuine anchor point (a gap, a swing point, a breakout), trade the pullback with volume confirmation, and manage a multi-day anchored position.
Strategies
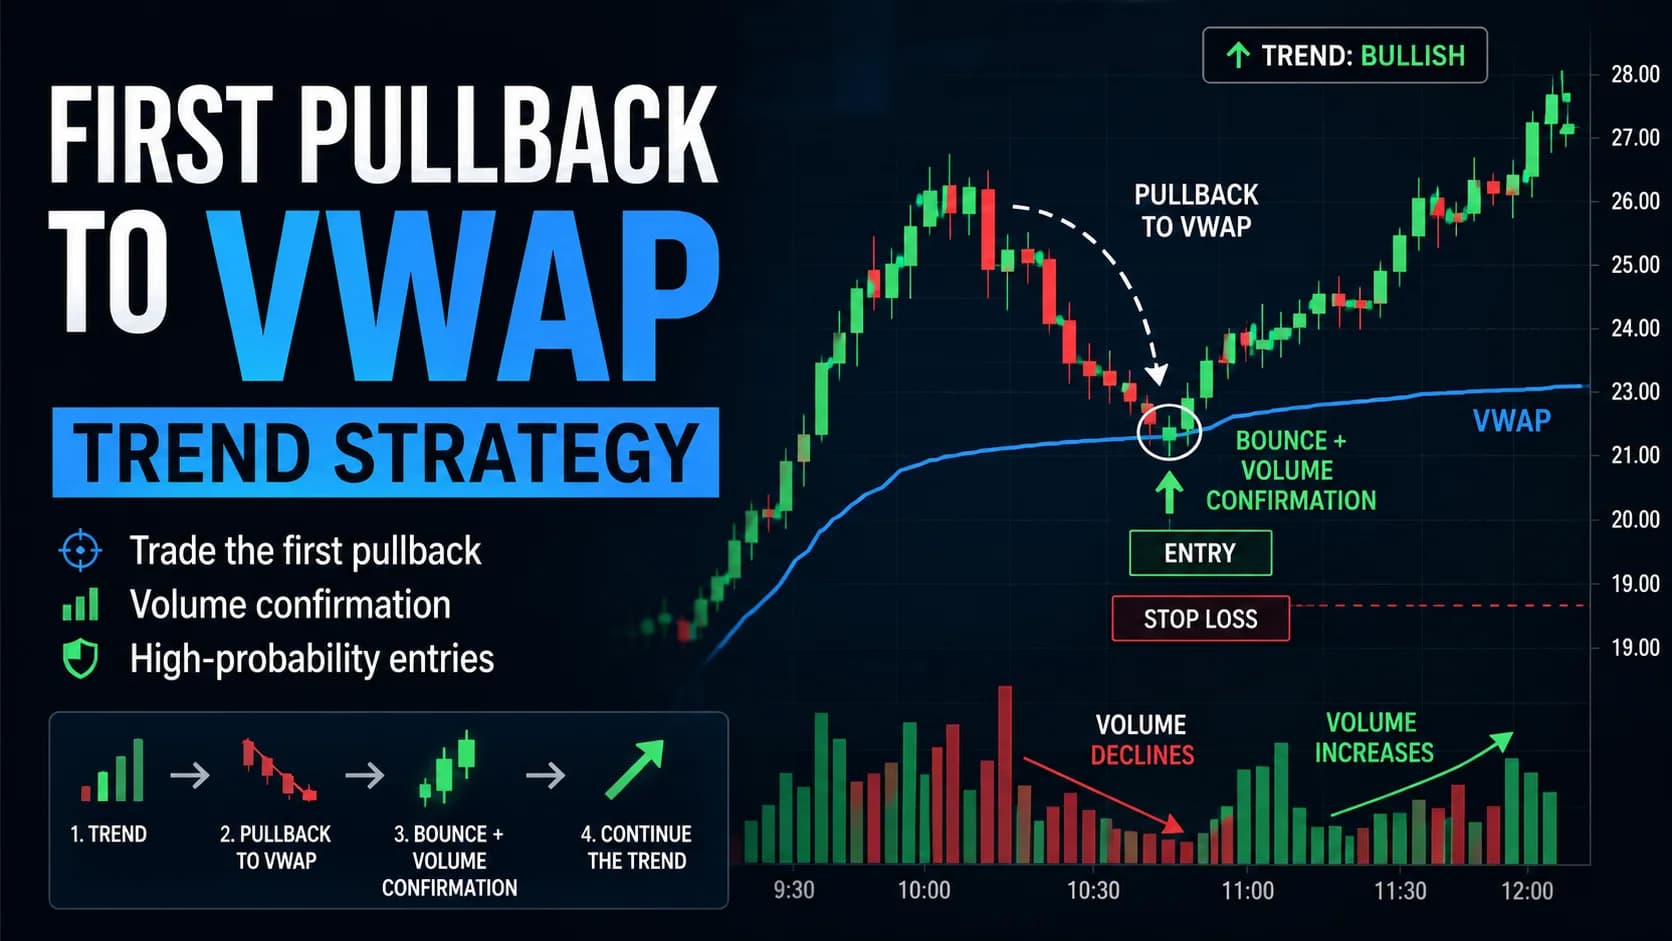
Trading the First Pullback to VWAP in a Trending Stock
A mechanical checklist for trading the first pullback to VWAP in a trending, catalyst-driven stock — volume confirmation, exact entry and stop rules, and an honest look at when this popular setup fails.
Comments
No comments yet. Be the first to share your thoughts.