A stock with 4 million shares in its FloatFloat is the number of shares of a company that are actually available for public trading — it excludes shares held by insiders, major institutions with lock-ups, and the company itself.Read definition → can move 200% on a single day's news in a way a stock with 400 million shares never will, and the reason isn't mysterious — it's arithmetic. A given dollar amount of buying has nowhere to go in a float that small, so price does the adjusting instead of the order book absorbing it quietly. Trading a low-float runner well starts with treating that arithmetic as the actual edge, not the CatalystA catalyst is the specific event or news item that triggers unusual price movement in a stock — earnings reports, FDA decisions, analyst upgrades, acquisition announcements, product launches, and short squeeze setups are all catalysts. WithRead definition → headline everyone else is reading.
What is a low-float runner strategy? A low-float runner strategy involves buying a small-cap or micro-cap stock with a limited number of tradable shares once it begins a strong, catalyst-driven move on VolumeVolume is the total number of shares (or contracts) traded during a given time period — it's the primary confirmation tool for all price action, because a price move accompanied by high volume indicates genuine market participation, while tRead definition → that represents a meaningful fraction of its total float, riding the continuation while that float-driven scarcity keeps amplifying the move. Readers who need the basics on float, short interest, and share structure should start there before this deeper treatment.
Why Float Rotation Is the Key Metric Here
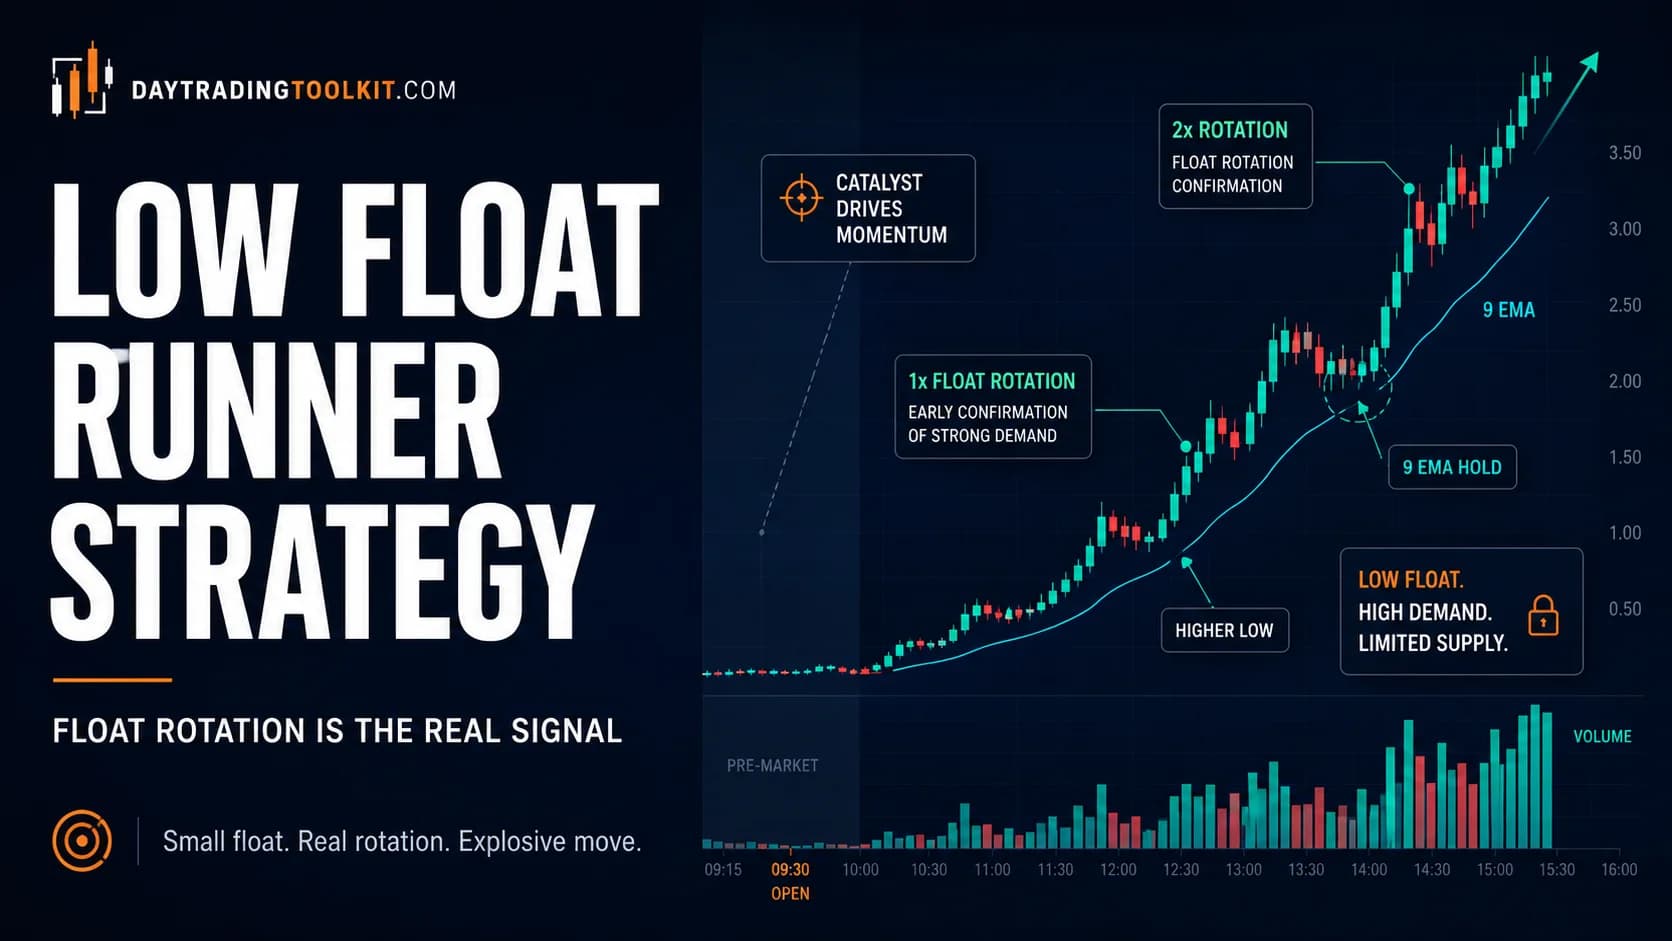
Every momentum-adjacent setup on this hub cares about Relative VolumeRelative volume (RVOL) compares a stock's current trading volume to its average volume for the same time of day, expressed as a multiple — a stock with 5x RVOL is trading five times more actively than normal, signaling unusual interest and Read definition → — how today's volume compares to a stock's own recent average. This setup cares about a related but distinct number: float rotation, calculated as the day's cumulative volume divided by the stock's tradable float. A stock with a 5 million-share float that has traded 5 million shares by mid-morning has rotated its float once; trade another 5 million and it's rotated twice.
That number matters because a full or multiple rotation means something structurally different is happening than a simple volume spike. Each rotation effectively means every previously-available share has changed hands, forcing a fresh set of buyers and sellers into the stock at each new price level — a kind of forced reset of who's actually holding the position. RVOL alone doesn't capture that; a stock can show 3x relative volume and still be nowhere near a full float rotation if its float happens to be large. Float rotation ties the volume number directly to the actual scarcity of shares, which is the variable driving the price move in the first place.
The Research Behind Why Low Float Moves So Violently
The underlying mechanism here has a real, long-standing academic basis. Amihud's foundational 2002 study developed a widely-used illiquidity measure — the ratio of a stock's absolute price change to its dollar trading volume — and found that less liquid stocks show a substantially larger price response per dollar traded than more liquid ones. In plain terms: the same size order moves a thin, low-float stock's price far more than it moves a heavily-traded, high-float one, because there's less available supply to absorb it.
That finding wasn't a one-time result. Amihud revisited his own measure in a 2019 study, explicitly checking whether the illiquidity-return relationship still held nearly two decades after the original paper — a fair question given how much market structure and LiquidityLiquidity in trading refers to how easily you can enter and exit a position at a fair price — a liquid stock has high volume and a tight bid-ask spread, allowing large orders to be filled quickly without moving the price, while an illiquid Read definition → provision has changed since 2002. The answer was a qualified yes: the effect was measurably smaller in the years following the original study, but remained positive and statistically significant. The underlying mechanism — thin liquidity produces outsized price response to trading volume — has persisted, even as its exact magnitude has moderated over time.
That's a solid foundation for the core premise of this setup: a low-float stock isn't just "more volatile" in some vague sense, it's structurally positioned to show a larger price response to the same dollar volume than a comparable large-float stock would, and that structural property has held up under repeated academic scrutiny rather than being a one-off finding from a single dataset.
The Setup Specification: Eight Rules for Trading the Runner
Every component below is a hard rule, anchored specifically to float rotation rather than relative volume alone.
- Component
- Market Conditions Required
- Rule
- A real, identifiable catalyst combined with cumulative volume approaching or exceeding a full float rotation — not just an elevated RVOL reading.
- Component
- Time of Day
- Rule
- Most commonly develops at the open on a pre-market catalyst, though it can begin at any point in the session on breaking news.
- Component
- Stock Selection Criteria
- Rule
- Float commonly under 20 million shares (with names under a few million showing the sharpest moves); a real, verifiable catalyst rather than pure chat-room chatter.
- Component
- Entry Trigger
- Rule
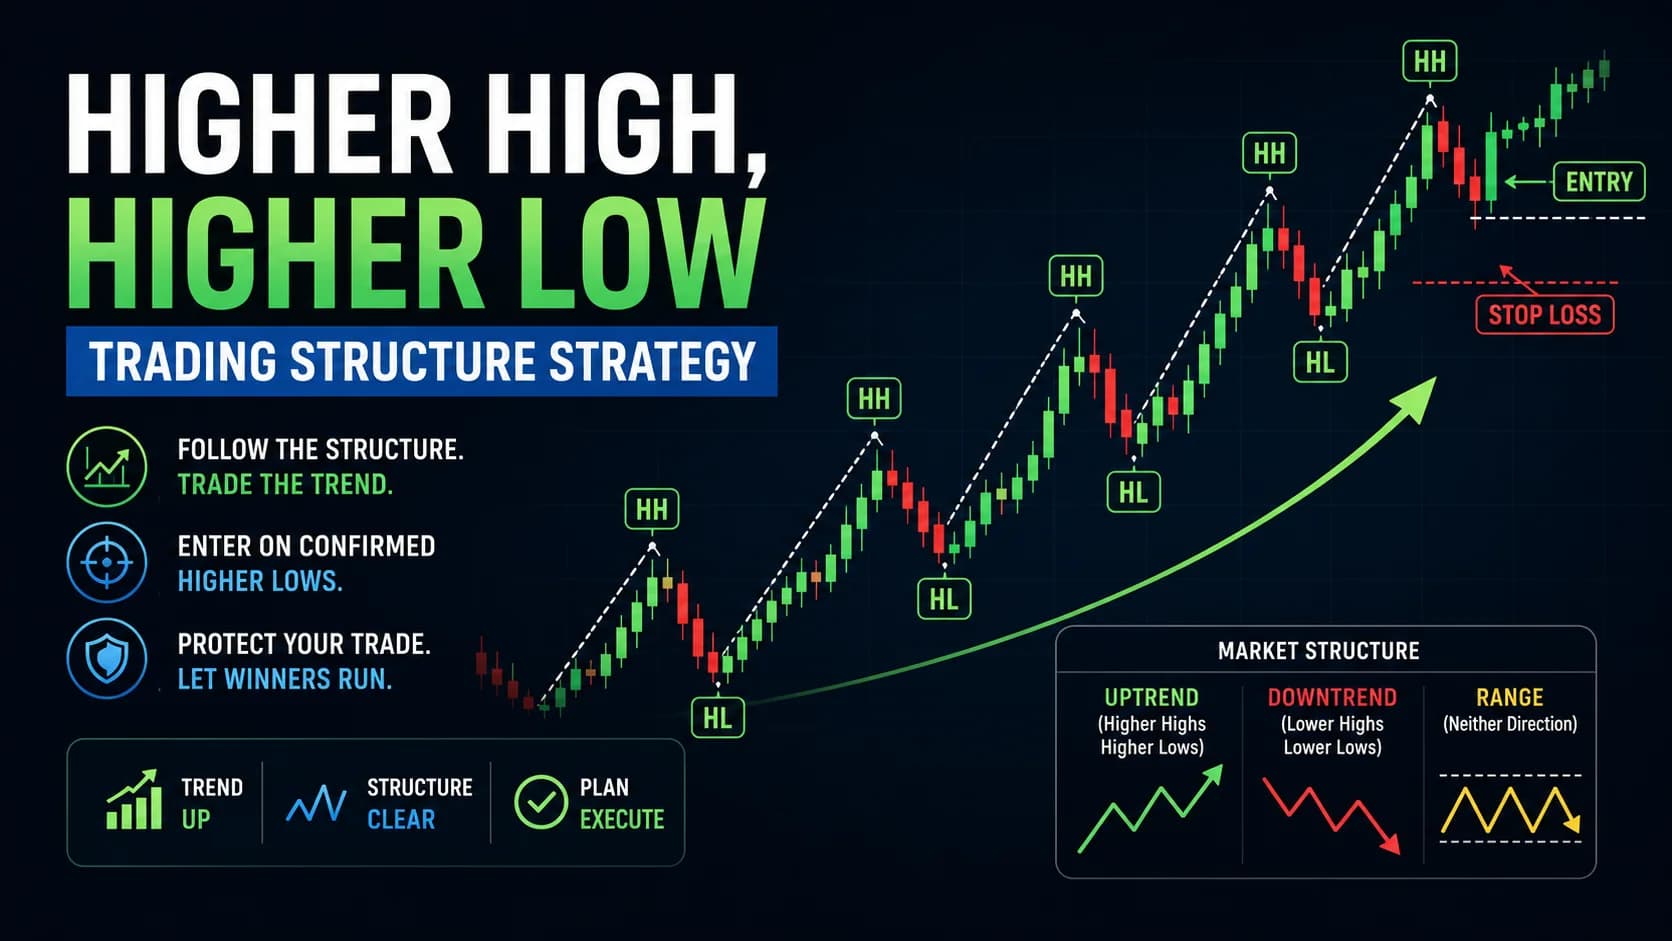
- Enter on a pullback to a fast-moving reference (the 9 EMA, or a recent higher low) that holds after cumulative volume has reached roughly a full float rotation, confirming genuine, broad participation rather than a handful of aggressive orders.
- Component
- Stop Loss
- Rule
- Below the most recent higher low; given the float-driven amplification, this stop is often wider in percentage terms than a comparable setup in a larger-float name.
- Component
- Initial Profit Target + Scaling
- Rule
- Scale into continued strength rather than fixing one static target, consistent with this hub's broader momentum framework, since a genuine multi-rotation runner can extend well beyond an initial target.
- Component
- Trade Management
- Rule
- Trail the stop behind new higher lows; treat each subsequent float rotation as a fresh checkpoint for whether genuine buying is still showing up or whether the move is running on inertia.
- Component
- Invalidation Criteria
- Rule
- A break of the most recent higher low, or cumulative volume stalling well short of a full rotation despite an aggressive price move — a sign the "run" may be a handful of orders rather than broad participation.
| Component | Rule |
|---|---|
| Market Conditions Required | A real, identifiable catalyst combined with cumulative volume approaching or exceeding a full float rotation — not just an elevated RVOL reading. |
| Time of Day | Most commonly develops at the open on a pre-market catalyst, though it can begin at any point in the session on breaking news. |
| Stock Selection Criteria | Float commonly under 20 million shares (with names under a few million showing the sharpest moves); a real, verifiable catalyst rather than pure chat-room chatter. |
| Entry Trigger | Enter on a pullback to a fast-moving reference (the 9 EMA, or a recent higher low) that holds after cumulative volume has reached roughly a full float rotation, confirming genuine, broad participation rather than a handful of aggressive orders. |
| Stop Loss | Below the most recent higher low; given the float-driven amplification, this stop is often wider in percentage terms than a comparable setup in a larger-float name. |
| Initial Profit Target + Scaling | Scale into continued strength rather than fixing one static target, consistent with this hub's broader momentum framework, since a genuine multi-rotation runner can extend well beyond an initial target. |
| Trade Management | Trail the stop behind new higher lows; treat each subsequent float rotation as a fresh checkpoint for whether genuine buying is still showing up or whether the move is running on inertia. |
| Invalidation Criteria | A break of the most recent higher low, or cumulative volume stalling well short of a full rotation despite an aggressive price move — a sign the "run" may be a handful of orders rather than broad participation. |
The float-rotation checkpoint built into both the entry and invalidation criteria deserves emphasis. A stock can spike 30% intraday on relatively light volume if its float is thin enough, and that spike can look identical on a price chart to a genuine, broadly-participated runner — until the volume is checked against the float specifically. Waiting for real rotation, not just a big percentage move, is what separates this setup from chasing a chart that merely looks dramatic.
Position sizing has to account for the wider stops this setup often requires. Because low-float stocks can gap between price levels with little in between, a stop placed at a technically correct level can still represent a wider percentage of the entry price than a comparable stop in a more liquid name — which argues for smaller share size relative to account equity, not the same size used for a large-float momentum trade.
A Walk-Through: Trading a Runner in a Hypothetical Low-Float Stock
Consider a hypothetical biotech stock, ticker YZA, with a float of 4 million shares and average daily volume around 150,000 shares. None of the prices or events below are real; they're constructed to show the mechanics in action.
YZA releases positive Phase 2 trial data before the market open. Pre-market volume builds quickly, reaching roughly 2 million shares by 9:30 AM — already half the entire float, an unusual amount of pre-market participation for a name this size. YZA opens at $8.50, up sharply from a $5.00 prior close, and continues climbing through the first 20 minutes.
By 10:00 AM, cumulative volume reaches 4 million shares — a full float rotation — with YZA trading around $11.00. The stock pulls back to $10.20 on the 9 EMA and holds there rather than breaking down, printing a higher low. A long entry triggers around $10.40, with a stop placed below the $10.20 higher low.
YZA continues higher through the next hour, reaching $13.50 as cumulative volume climbs past a second float rotation, pulling back to a new higher low near $12.60 before continuing. The stop trails up behind each new higher low, with a portion of the position scaled out into strength along the way.
By early afternoon, cumulative volume growth slows noticeably even as price attempts a new high near $14.80 — a divergence between price and the pace of fresh rotation. Shortly after, YZA breaks its most recent higher low near $13.00. That structural break closes the remaining position, consistent with the mirror-image exhaustion signature this hub's parabolic reversal strategy covers in depth for traders looking to fade that same exhaustion from the other side.
Managing the Position as the Runner Develops
Trail the stop behind confirmed higher lows exactly as this hub's general momentum framework specifies, with one addition specific to this setup: treat each new float rotation as a checkpoint rather than assuming the move automatically continues just because it has so far. A second or third rotation accompanied by continued higher lows is a genuinely different, more confirmed situation than price grinding higher on volume that's stalled well short of another rotation.
The one rule that overrides the others: never add to the position on a break of the most recent higher low, hoping the pullback is just noise. In a low-float name, that "noise" can be the start of the exact reversal this hub's parabolic reversal guide covers, and it can develop within minutes rather than giving a trader time to reconsider.
Where This Strategy Fails: Thin Rotation and the Reversal That Follows
The dominant failure mode is mistaking a sharp price move for genuine broad participation when the volume behind it never approached a real float rotation. A stock can gap and spike on a relatively small number of aggressive orders in a thin float, producing a chart that looks like a genuine runner without the underlying participation that makes a runner durable. Checking cumulative volume against the float specifically, not just glancing at a big percentage move, is what catches this before entry rather than after.
A second, related risk is timing: entering late, after several rotations have already occurred and the population of buyers willing to pay up has plausibly been exhausted. This hub's parabolic reversal guide covers the mechanics of that exhaustion signature directly — the same climax-and-reversal pattern that marks a genuine top applies to low-float runners as much as to any other momentum stock, and arguably more violently given the same scarcity that powered the advance.
A third risk is specific to this population of stocks: short interest and borrow dynamics can add fuel to the advance through covering, but that fuel runs out, and when it does, the reversal can be just as sharp as the original move. This hub's short squeeze playbook covers that dynamic directly, and it's worth understanding before sizing a position in a heavily-shorted low-float name specifically.
Adapting the Setup Across Float Bands and Catalyst Types
Micro-float names (roughly under 2 million shares) show the sharpest, fastest version of this setup — a full rotation can happen in minutes rather than hours, and the corresponding moves and reversals compress accordingly. Names in the low tens of millions of shares still qualify but produce a somewhat steadier, slightly slower version of the same dynamic, requiring more cumulative volume to reach the same rotation checkpoints.
Catalyst type shapes how durable a runner tends to be, echoing this hub's broader momentum research: a genuine, material catalyst (a real trial result, a verified contract win, a confirmed buyout rumor) supports a more durable move than pure chat-room-driven attention with no verifiable substance, even though both can produce the exact same float-rotation signature in the moment.
This setup doesn't require an overnight gap the way this hub's Gap and Go strategy does — a low-float name can begin its run entirely intraday on breaking news with no prior gap at all, since the float-rotation mechanic is about volume relative to share count, not about the overnight price change specifically.
Scanning for Low-Float Runners in Real Time
Manually calculating float rotation across a watchlist by hand isn't practical, especially since the number changes continuously through the session as volume accumulates. A useful scan filters for float size directly, combined with relative volume and a real-time or near-real-time rotation calculation where the platform supports it.
Trade Ideas is built to run this kind of scan as a comprehensive scanning and research platform, filtering by float size and volume alongside built-in charting to track a candidate's price structure as rotation accumulates through the session. The scan narrows a broad market down to genuine low-float candidates; confirming the actual pullback-and-hold entry, checked against real rotation, still governs the trade.
Sizing the Low-Float Runner Trade Inside a Broader Plan
This setup produces some of the widest percentage swings of any strategy on this hub, which argues for correspondingly smaller position sizing relative to account equity rather than treating it the same as a large-float momentum trade. Risk defined in R-multiples against the actual stop level — the most recent higher low — keeps that math honest regardless of how exciting the percentage move looks.
The psychological trap here is specific: the same violent moves that create opportunity also create intense pressure to chase a stock well past the point where a genuine pullback-and-hold entry is still available. This hub's guide to FOMO in trading covers this trap directly, and this hub's guide to trading discipline covers the broader habit of waiting for a real entry rather than acting on excitement alone — worth reading before, not after, watching a low-float name run without a position. This strategy belongs on the Strategies Hub as a specific, float-driven application of momentum trading — useful precisely because it insists on checking real rotation before treating any sharp move as a genuine runner.
Common Questions About Trading Low-Float Runners
How is float rotation different from relative volume?
A stock can show a high RVOL reading while still being far from a full float rotation if its float happens to be large relative to its typical volume, and the reverse is also true for names with an unusually small float. Float rotation ties the volume number to the specific scarcity driving this setup, rather than just comparing volume to its own history.
Key Takeaway: Use RVOL to notice a stock is active, and float rotation to judge how significant that activity actually is relative to available supply.
What float size actually counts as "low float" for this setup?
A stock with a 15-million-share float can still qualify and produce a tradable runner, just with a steadier, somewhat less explosive character than a 2-million-share float experiencing the same relative catalyst and volume.
Key Takeaway: Treat float size as a spectrum that shapes the intensity of the setup, not a strict pass/fail threshold.
Why does academic research on illiquidity matter for a day trading setup like this?
That research has also been directly revisited to check whether the effect still holds in more recent markets, and found it persists, if somewhat diminished, decades after the original study — a meaningfully more rigorous foundation than assuming the pattern just because it's widely believed.
Key Takeaway: The float-driven amplification behind this setup isn't trading folklore — it's a documented, repeatedly-tested market characteristic.
Does a full float rotation guarantee the move will continue?
Rotation is a filter for distinguishing real participation from a thin, unreliable spike, not a signal that guarantees continuation on its own. The entry still requires a confirmed pullback and higher low on top of the rotation checkpoint.
Key Takeaway: Treat float rotation as necessary confirmation, not sufficient proof that the move keeps going.
How does this setup relate to the parabolic reversal strategy covered elsewhere on this hub?
Every low-float runner that doesn't simply fade quietly eventually reaches some kind of top, and recognizing that transition is exactly what the parabolic reversal setup is built to catch, using many of the same volume and structure principles from the opposite direction.
Key Takeaway: A trader working this setup should know the parabolic reversal signature well, since it's the most likely way a successful long position eventually needs to exit.
Why do short squeezes so often show up in low-float runner discussions?
That's not a required ingredient of every low-float runner, but it's common enough in heavily-shorted low-float names that understanding the mechanics is worth doing before trading this setup in a name with elevated short interest specifically.
Key Takeaway: Short covering can add real fuel to a low-float runner, but that fuel is finite and its exhaustion can mark the same kind of sharp reversal this setup should be watching for regardless of the cause.
Does this setup require an overnight gap?
A stock can open unremarkably, then begin rotating its float rapidly mid-morning on a fresh headline, producing the identical setup mechanics covered here without ever having gapped at the open.
Key Takeaway: Watch for the float-rotation signature throughout the session, not just at the open.
Why are wider stops often necessary for this setup than for other momentum trades?
That's a direct consequence of the same scarcity that makes the setup attractive in the first place; the amplification that produces outsized gains produces outsized risk at the same time, and the stop distance has to reflect that honestly.
Key Takeaway: Size the position to the wider stop rather than forcing an artificially tight stop that doesn't reflect how the stock actually trades.
Can float rotation be calculated precisely in real time, or is it always an estimate?
Float figures can lag actual share structure changes — a recent offering, an insider sale becoming unrestricted, or a buyback — so treating the float number as approximately correct rather than exact is a reasonable habit, especially in names that have recently changed their share structure.
Key Takeaway: Use float rotation as a strong directional signal, and stay aware that the float figure underlying the calculation can occasionally be stale.
How does patience factor into trading this setup well?
That patience is the direct tradeoff for avoiding the population of chases that enter well after a genuine entry point has passed, betting on a move that's already run further than the setup's own rules would justify.
Key Takeaway: The discipline this setup demands is less about the trade itself and more about tolerating the discomfort of waiting for it properly.
Disclaimer
Article Sources
- Amihud (2002), "Illiquidity and Stock Returns: Cross-Section and Time-Series Effects", Journal of Financial Markets - the foundational measure showing thinly-traded stocks exhibit larger price response per dollar of trading volumecis.upenn.edu
- Amihud (2019), "Illiquidity and Stock Returns: A Revisit", Critical Finance Review - revisits the original 2002 findings nearly two decades later and confirms the effect persists, though somewhat diminishednowpublishers.com
- Diether, Lee & Werner (2009), "Short-Sale Strategies and Return Predictability", Review of Financial Studies - relevant to the short-covering dynamics that frequently accompany heavily-shorted low-float runnersacademic.oup.com