A low-FloatFloat is the number of shares of a company that are actually available for public trading — it excludes shares held by insiders, major institutions with lock-ups, and the company itself.Read definition → stock that goes from $3 to $20 in three trading sessions looks like the last thing anyone should short. And yet the single highest-VolumeVolume is the total number of shares (or contracts) traded during a given time period — it's the primary confirmation tool for all price action, because a price move accompanied by high volume indicates genuine market participation, while tRead definition → candle of that entire move usually prints at the top itself — not on the way up, not a day later, but in the exact bar where the advance finally fails. Learning to recognize that bar, and waiting for the next one to confirm it, is what separates a parabolic reversal trade from a guess about where a stock "has to" turn.
What is a parabolic reversal strategy? A parabolic reversal strategy involves shorting a stock after it completes an unsustainable, near-vertical price advance — entering only once volume, price action, and a specific technical trigger confirm that buying demand has been exhausted, rather than guessing at the top in real time. It targets the single session (sometimes the single hour) where a run-up finally breaks.
Why Shorting a Parabolic Top Isn't the Same Trade as a Breakdown
It's tempting to lump every short-selling setup together, but a parabolic reversal and a breakdown trade solve almost opposite problems. A breakdown setup shorts a stock that's already trending lower and cracking a SupportSupport is a price level where buying pressure has historically overcome selling pressure, causing price to stop declining and reverse — it's the floor where demand enters the market, and when it holds, it's a potential long entry; when it Read definition → level — the TrendA trend is a sustained directional movement in price over time — an uptrend is characterized by a sequence of higher highs and higher lows, a downtrend by lower highs and lower lows — and correctly identifying the current trend direction isRead definition →, and often the broader market, is doing a share of the work. A parabolic reversal does none of that. It shorts a stock at the single most extended point of an uptrend, while the crowd is still buying, before any trend reversal has been confirmed by anything except the move itself running out of room.
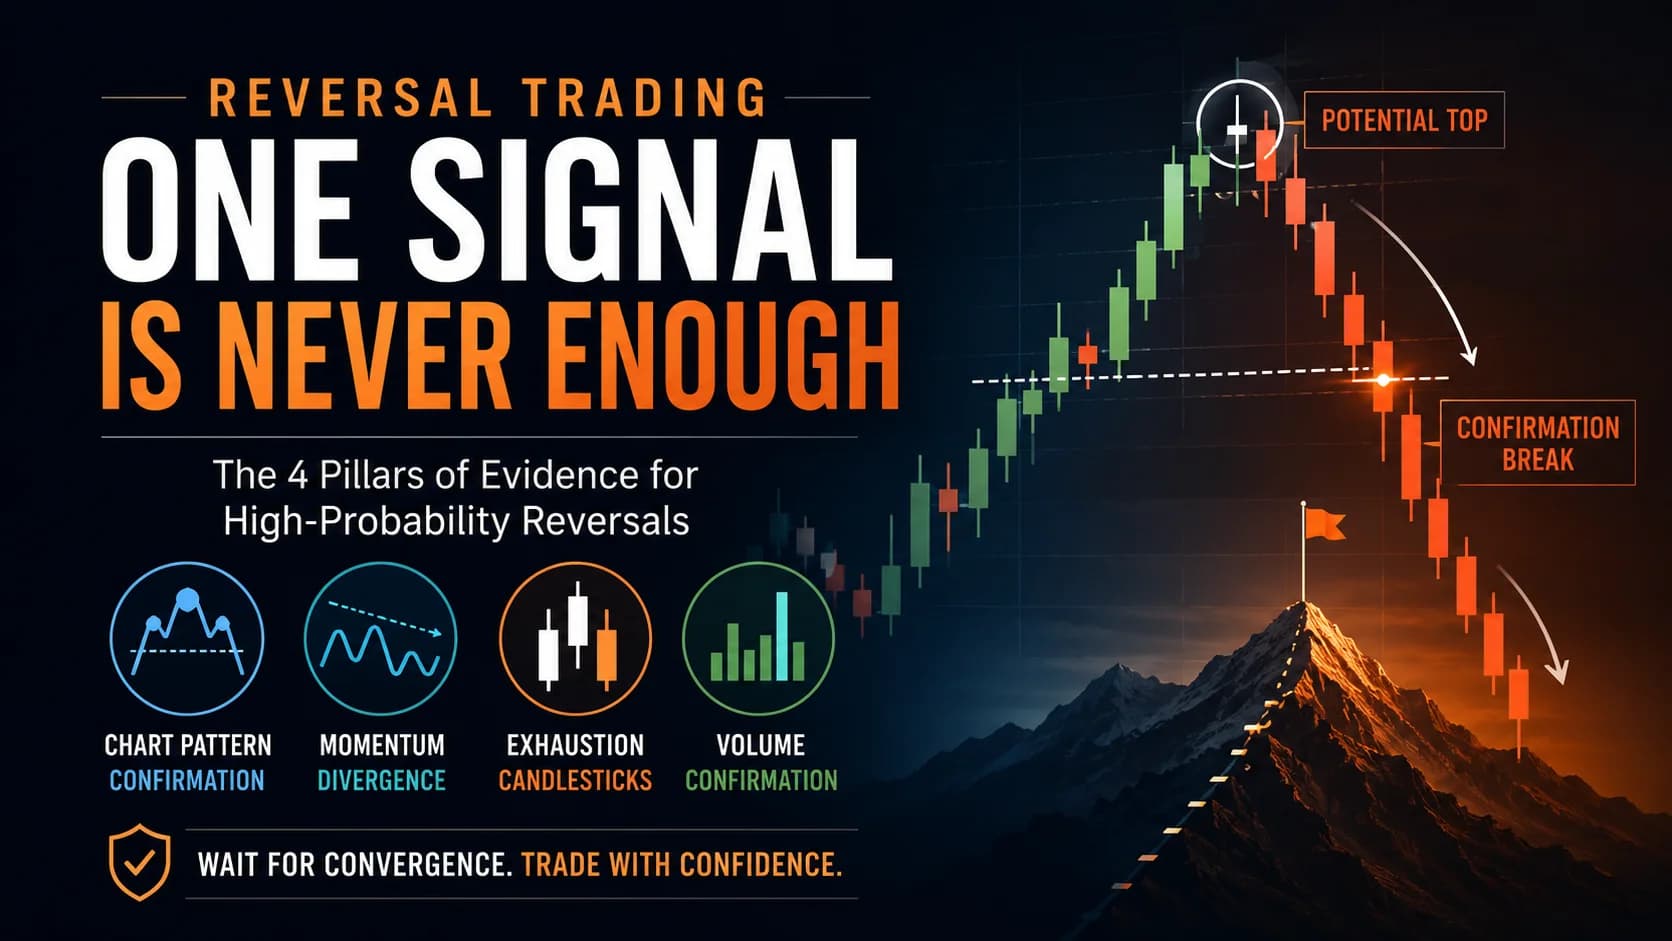
That difference changes the whole risk profile. A breakdown trade that goes wrong usually just chops sideways — annoying, not dangerous. A parabolic short that goes wrong can rip another 30% higher in minutes, because the same buying pressure that created the move hasn't stopped just because a trader decided it should. This guide is a specific application of the broader question this hub's reversal trading playbook asks — how many pieces of evidence need to align before a turn is real — narrowed down to the single most violent and time-compressed version of a top.
It's also not the same trade as fading a short SqueezeA squeeze (short squeeze) occurs when a stock that is heavily shorted rises sharply, forcing short sellers to buy back shares to cover their losing positions — the forced buying adds fuel to the upward move, creating a feedback loop that caRead definition → mid-squeeze, or shorting the first red candle off any high. Those are close cousins. This strategy has a narrower job: catching the specific moment a vertical, volume-climaxing move exhausts itself, with rules mechanical enough that a trader isn't relying on a gut feeling about when "enough is enough."
The Market Conditions That Separate a Parabolic Top From Ordinary Strength
Here's the part most traders get backwards: a stock making new highs is not, on its own, a reason to expect a reversal. Academic research on momentum — most notably George and Hwang's 2004 study on stocks trading near their 52-week highs — found that proximity to a high tends to predict continued strength over the following months, not a reversal. Stocks that are "up a lot" usually just keep going. If that's the whole picture, shorting into strength is closer to gambling than trading.
A genuine parabolic top requires something more specific than strength: acceleration. The move has to be getting steeper, not just continuing — each session's range larger than the last, each pullback shallower, the angle bending toward vertical rather than holding a steady slope. Relative volume needs to be running well above normal, typically in the 5x-to-10x range or higher on the terminal day. And the move needs to have covered several multiples of the stock's own average true range in a compressed window, often one to five sessions, rather than unfolding gradually over months.
Float and short interest matter, but as amplifiers rather than requirements. A name with a float in the low tens of millions of shares or less will produce a sharper, faster version of this pattern than a large-float stock will, because it takes far less buying pressure to move the price. You should understand float, short interest, and share structure before trading this setup, since both numbers shape how violent the move — and the eventual reversal — can get. A real catalyst (a clinical trial update, an earnings surprise, a viral social-media narrative) is common but not universal; some of the sharpest parabolic moves are driven by pure momentum feedback with no fresh news at all.
Time of day is a secondary factor, but not an irrelevant one. Exhaustion signals that print in the first 90 minutes after the open or during the final hour tend to be more reliable than ones that appear between roughly noon and 1:30 PM ET, when volume typically thins out across the market and a small print can look like a climax candle without actually being one.
The Setup Specification: Eight Rules for Timing the Short
Every component below is a hard rule, not a suggestion. Discretion has a place in trading — it doesn't have a place in deciding whether this specific trigger has actually fired.
- Component
- Market Conditions Required
- Rule
- Price has advanced sharply above its recent base in a compressed window (typically one to five sessions), with each session's range larger than the last — an accelerating signature, not just an uptrend.
- Component
- Time of Day
- Rule
- Works at any point in the session; signals in the first 90 minutes or the final hour carry more weight than ones forming between 12:00 and 1:30 PM ET.
- Component
- Stock Selection Criteria
- Rule
- RVOL of 5x or higher on the terminal day; price has moved several multiples of its own average true range within the recent advance; low float amplifies but is not required.
- Component
- Entry Trigger
- Rule
- Let the single highest-volume candle of the entire move (the climax candle) complete, then short on the first following candle that closes below the climax candle's low, on continued elevated volume.
- Component
- Stop Loss
- Rule
- Above the high of that confirming candle, or above the intraday high if the confirming candle hasn't exceeded it — whichever level is higher.
- Component
- Initial Profit Target + Scaling
- Rule
- First scale-out at the session VWAP or the level where the move first broke away from its prior base, whichever is closer; cover a third to half the position there.
- Component
- Trade Management
- Rule
- Cover into further weakness rather than waiting for a bounce; trail the stop down as lower highs form; never add to the position on a bounce against it.
- Component
- Invalidation Criteria
- Rule
- A new high above the confirming candle's high, or a strong-volume reclaim of the climax candle's high, invalidates the setup immediately.
| Component | Rule |
|---|---|
| Market Conditions Required | Price has advanced sharply above its recent base in a compressed window (typically one to five sessions), with each session's range larger than the last — an accelerating signature, not just an uptrend. |
| Time of Day | Works at any point in the session; signals in the first 90 minutes or the final hour carry more weight than ones forming between 12:00 and 1:30 PM ET. |
| Stock Selection Criteria | RVOL of 5x or higher on the terminal day; price has moved several multiples of its own average true range within the recent advance; low float amplifies but is not required. |
| Entry Trigger | Let the single highest-volume candle of the entire move (the climax candle) complete, then short on the first following candle that closes below the climax candle's low, on continued elevated volume. |
| Stop Loss | Above the high of that confirming candle, or above the intraday high if the confirming candle hasn't exceeded it — whichever level is higher. |
| Initial Profit Target + Scaling | First scale-out at the session VWAP or the level where the move first broke away from its prior base, whichever is closer; cover a third to half the position there. |
| Trade Management | Cover into further weakness rather than waiting for a bounce; trail the stop down as lower highs form; never add to the position on a bounce against it. |
| Invalidation Criteria | A new high above the confirming candle's high, or a strong-volume reclaim of the climax candle's high, invalidates the setup immediately. |
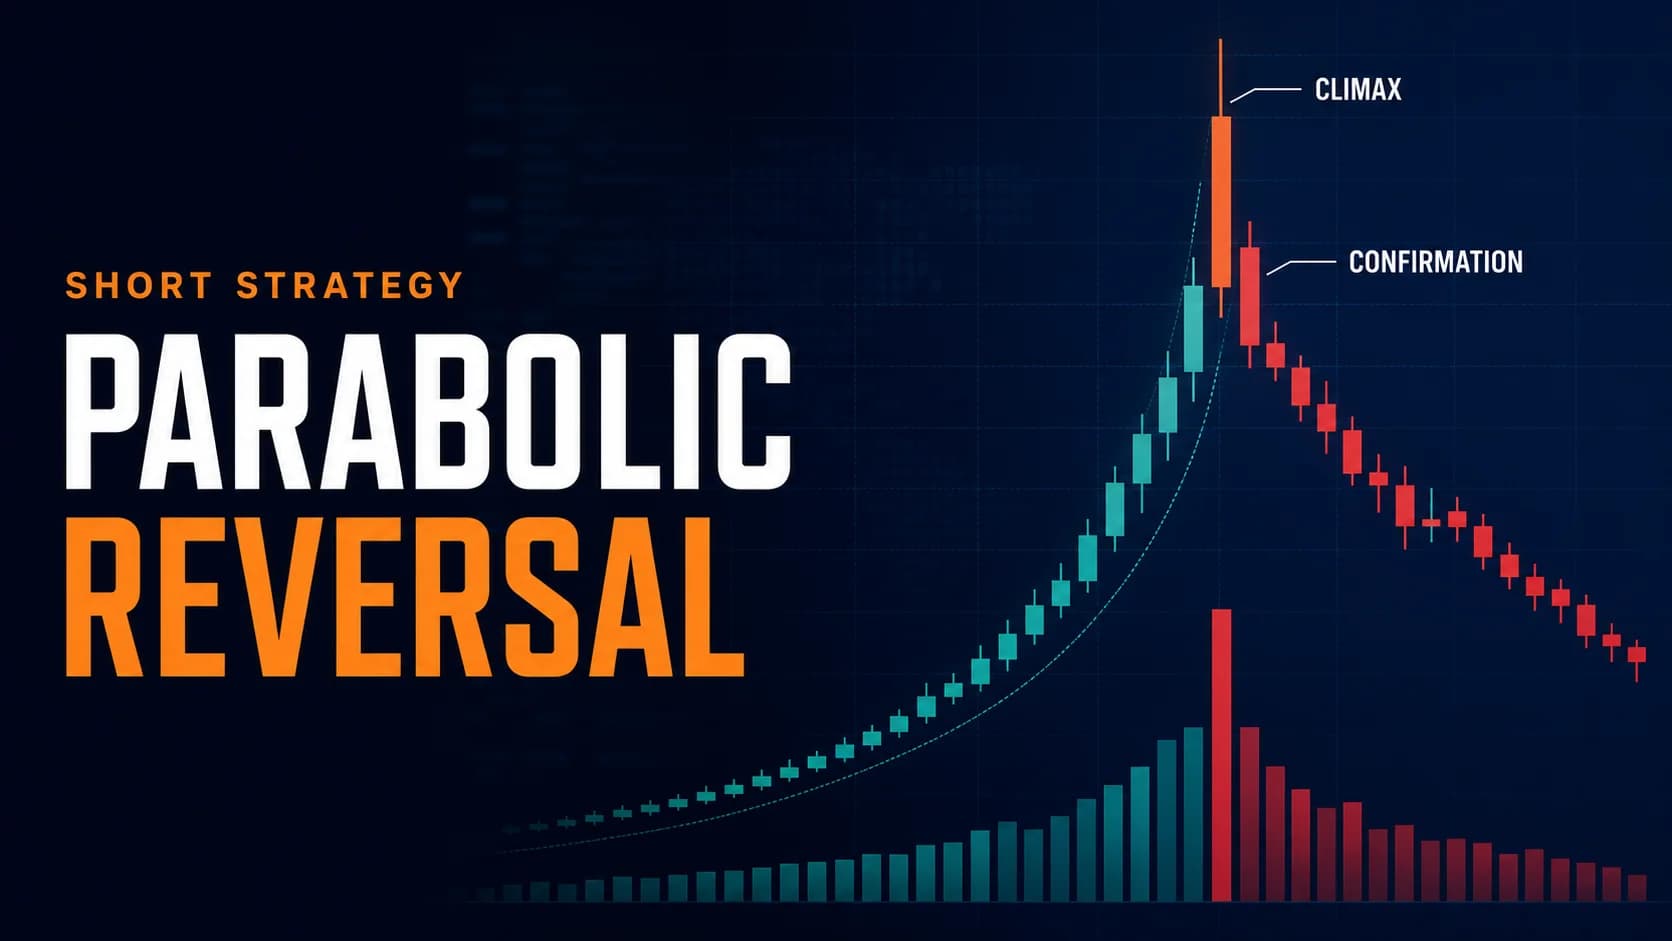
A few of these are worth expanding. The entry trigger is deliberately not "short when it looks tired." It requires two specific candles in sequence: the climax candle, identifiable only in hindsight of a few bars as the single largest volume print of the entire move, and a confirming candle that actually breaks its low. That second candle matters enormously — it's the difference between shorting a pause and shorting a genuine reversal. Skipping it and shorting into the climax candle itself is how traders end up short a stock that immediately rips another leg higher.
The stop-loss rule is intentionally tied to price structure rather than a fixed percentage. Parabolic movers don't respect neat percentage stops; they respect the actual high that was just set. Anchoring the stop there keeps risk defined without being so tight that ordinary post-climax chop knocks a correct trade out before it has room to work.
Profit targets stay conservative on purpose. The VWAP or breakaway level is usually reached quickly if the reversal is real, and covering a meaningful chunk there locks in gains before finding out whether a second leg is coming. The remainder of the position can work toward the base the move launched from, but that target is a bonus, not the plan.
A Minute-by-Minute Walk-Through: Fading the Blow-Off in a Hypothetical Runner
Consider a hypothetical small-cap biotech, ticker XYZ, following a positive but early-stage clinical trial update. None of the prices or events below are real; they're constructed to show the mechanics in action.
XYZ closes Monday at $3.10. Tuesday, on the initial news, it runs to $5.80 (up 87%) on heavy volume. Wednesday it gaps to $8.40, stretches intraday to $11.20, and settles at $9.90 as some of the early gains get sold into strength. That's two full sessions of acceleration — exactly the kind of compressed, steepening advance the setup looks for, not a slow grind.
Thursday is the parabolic day. XYZ gaps to $13.50 at the open and keeps climbing through the first hour, tagging a high of $19.75 by 10:40 AM ET with relative volume near 22x its 20-day average. Between 10:35 and 10:40, a single 5-minute candle prints roughly 2.1 million shares — nearly ten times the size of the 5-minute bars from earlier that morning. That candle opens near $18.40, spikes to $19.75, and closes back down at $18.60, leaving a long upper wick. This is the climax candle.
The next 5-minute candle, from 10:40 to 10:45, closes at $17.55 — below the climax candle's $18.40 low — on continued volume of roughly 900,000 shares. That close is the entry trigger. A short is initiated around $17.50 to $17.55, with a stop placed above the intraday high at $19.75 (plus a small buffer, say $19.90), since that level sits above the confirming candle's own high.
By 11:15 AM, VWAP for the session has caught up to roughly $15.80. A third to half the position covers there. The stock continues fading through midday, eventually testing the $13.50 gap-up level and, later in the session, drifting back toward Wednesday's $9.90 close. The remainder of the position works toward that zone, with the stop trailed down behind each new lower high along the way.
Notice what the trade did not require: guessing the exact tick of the top. The entry came at $17.55, roughly $2.20 below the actual high of $19.75. That gap between the top and the entry isn't a flaw in the setup — it's the cost of waiting for confirmation instead of guessing, and it's a cost worth paying every time.
Managing the Short Once the Reversal Confirms
Once the position is on, the job shifts from analysis to discipline. Cover into further weakness rather than waiting for a bounce to add conviction — if the thesis is right, the stock keeps giving ground, and there's no requirement to wait for a specific bounce before locking in part of the gain.
Trail the stop down as new lower highs form on the way down, rather than leaving it fixed at the original level indefinitely. This does two things: it protects profit as the move develops, and it forces an exit automatically if the stock starts making higher lows instead of lower ones, which is often the earliest sign that a second leg is building.
The one rule that matters more than any other here: never add to the position on a bounce against it. A bounce in a stock that just printed a parabolic top can be nothing — or it can be the first push of a squeeze that erases the entire trade. Averaging into that uncertainty, hoping the original read was right, is how a well-executed setup turns into an account-level problem.
The Second-Leg Squeeze: Why This Setup Blows Up Traders Who Get It Half-Right
If there's one way this trade goes wrong more often than any other, it's this: a chunk of the original move was fueled by short sellers getting squeezed, and the population of traders shorting "too early" becomes the buying pressure that creates a second leg higher.
This isn't a hypothetical risk — it's close to the mechanical definition of how parabolic moves in heavily shorted, low-float names actually work. Momentum buyers pile in, price rises, existing short positions come under pressure, and those shorts are forced to buy back stock to stop the bleeding. That forced buying adds fuel on top of the original demand, which is exactly why some of the most extreme parabolic moves in market history have occurred in stocks with unusually high short interest relative to their float. This hub covers the mechanics of that dynamic directly in its short squeeze playbook, and it's worth reading alongside this guide, not after a bad trade makes the point the hard way.
The practical lesson is that shorting a parabolic mover means shorting into the same mechanical force that may have already proven, once, that it can overwhelm the available float. Waiting for the climax-and-confirmation sequence described earlier exists specifically to filter out the first leg of a squeeze — the point where price is still finding new highs because forced buyers haven't finished covering. Traders who short the first sign of weakness, rather than waiting for the confirmed break of the climax candle's low, are the ones most likely to get run over by a second leg they had no way of predicting from a single red candle.
There's a second, quieter failure mode worth naming honestly: research on short selling — including Diether, Lee, and Werner's 2009 study on short-sale strategies — has found that short sellers who trade into recent strength do, on average, correctly anticipate weaker returns ahead. That's supportive of this strategy's core logic. But "on average" isn't "every time," and a study built on daily data across a broad universe of stocks doesn't guarantee any single trade works out. Position size accordingly.
Adapting the Setup Across Float Sizes, Catalysts, and Instruments
The core mechanics hold across markets, but the intensity of the setup changes with what's being traded. Large-float, mega-cap names can become genuinely overbought and reverse after a strong run, but with hundreds of millions of shares outstanding, no single day's volume typically overwhelms the float the way it does in a stock with a float of a few million shares. Large-float exhaustion tends to unwind over several sessions with smaller candles and far less squeeze risk — a slower, tamer cousin of the setup described above.
Low-float names compress the entire cycle — advance, climax, reversal — into hours instead of days, and they're where this strategy shows its sharpest edge and its sharpest risk simultaneously. Borrow availability becomes a real constraint here: shares can become hard to borrow or entirely unavailable right when the setup looks best, which leads directly into the options-based variation covered below.
Buying puts instead of shorting shares sidesteps both the borrow-availability problem and the unlimited-loss profile of a short position, at the cost of paying a premium that's often elevated precisely because implied volatility spikes at the top of a parabolic move. Traders who value defined risk over avoiding time decay tend to prefer this version once they're comfortable with options pricing mechanics.
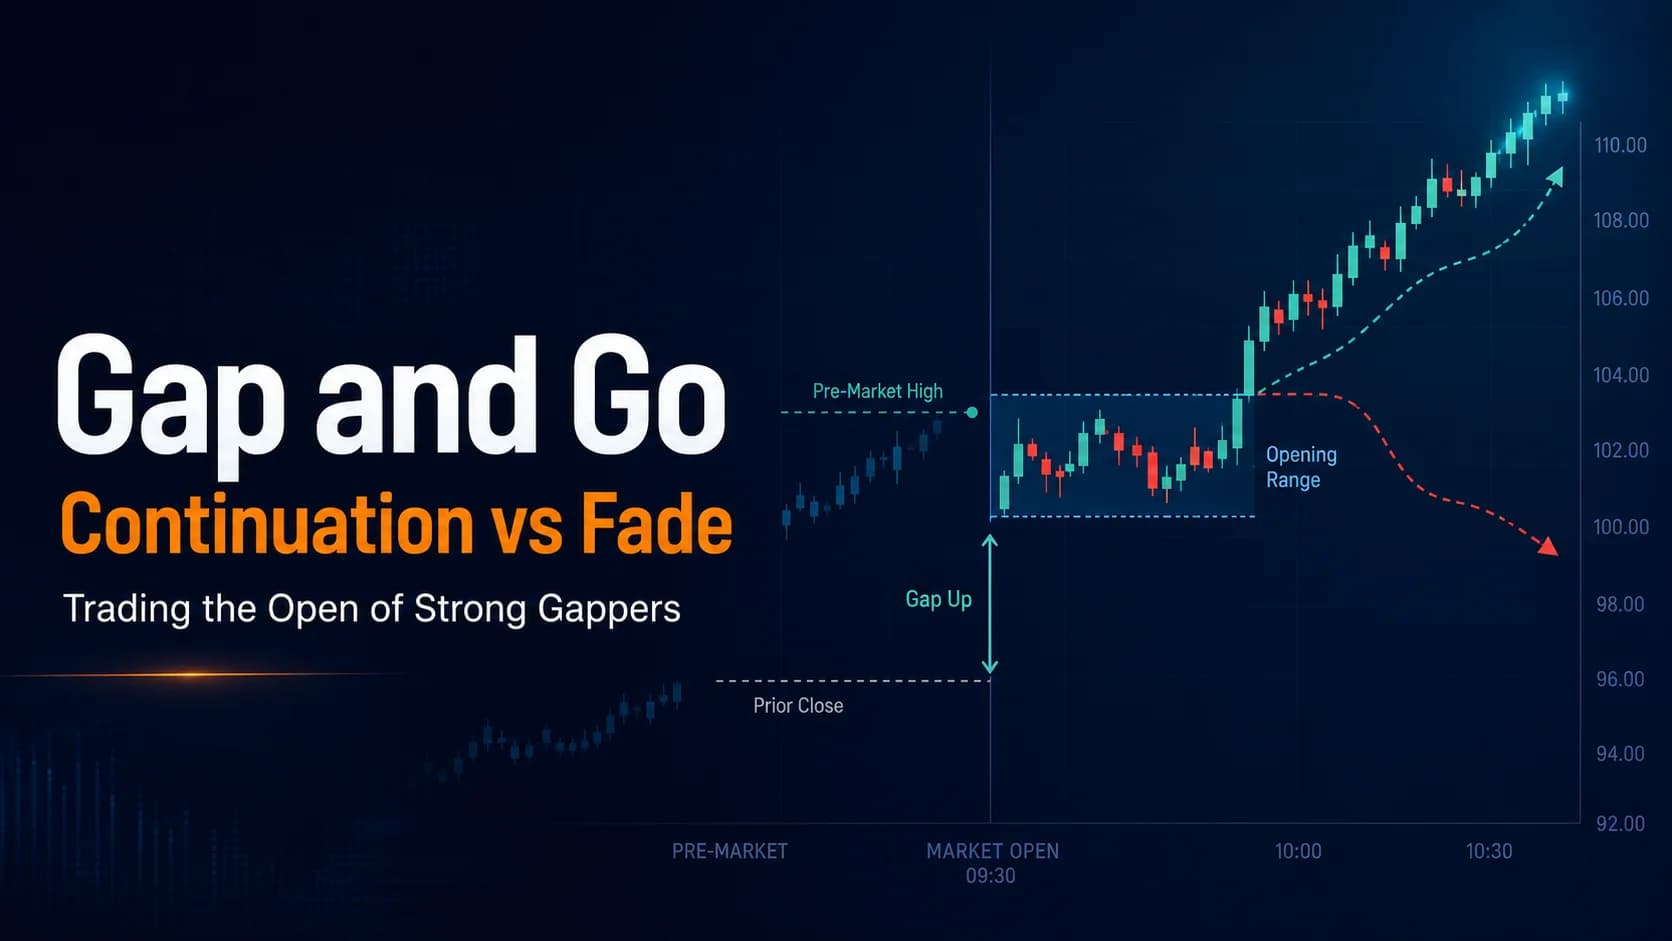
The setup also doesn't require a gap. Multi-day runners frequently do climax with an overnight or pre-market gap, since reduced liquidity outside regular hours tends to produce outsized moves. But a stock can just as easily go parabolic entirely within a single regular session — a modest open followed by acceleration through the morning purely on volume and momentum, climaxing and reversing before lunch. The rules in the setup specification apply the same way either way.
Scanning for Exhaustion Before the Reversal Candle Even Prints
Manually flipping between charts hoping to catch a climax candle as it happens doesn't scale, especially since dozens of stocks can be making outsized moves on any given morning. A useful scan combines three conditions: a percentage-gainer filter for stocks up sharply over the past one to five sessions, a relative volume filter set well above the 5x threshold discussed earlier, and a float filter to separate low-float candidates (where this setup moves fastest) from large-float ones (where it unfolds more slowly).
Trade Ideas is built to run scans like this continuously through the session as a comprehensive scanning and research platform — surfacing gappers and momentum names by percentage move, relative volume, and float in real time, alongside built-in charting to review the candidates the scan returns without switching platforms. That narrows a market of thousands of stocks down to a short list worth watching closely. It doesn't replace the climax-and-confirmation sequence covered earlier — a scanner finds candidates, it doesn't confirm that any single one has actually topped.
Sizing the Parabolic Short Inside a Broader Trading Plan
This strategy is a specialist tool, not a daily bread-and-butter setup. Genuine parabolic exhaustion — the accelerating, volume-climaxing version described throughout this guide, not just "a stock that's up a lot" — shows up in a small number of names on any given week. Treating it as a core strategy to trade every session invites forcing the pattern onto moves that don't actually qualify.
Position sizing deserves particular care here. Because stops are anchored to a recently printed high rather than a fixed percentage, the dollar risk per share can be wider than in most other setups on this hub, which argues for smaller share size relative to account equity, not the same size used for a standard breakout or pullback trade. Sizing every trade — including this one — as a defined risk in R-multiples, rather than a fixed share count, keeps one outsized loser from doing damage a whole week of correct trades can't offset.
There's a psychological dimension worth naming directly, too. Shorting into a crowd that's still buying enthusiastically requires tolerating a specific kind of discomfort that a trend-following or pullback trade never asks for. Skip the work on managing fear and greed and you'll likely do one of two things: chase the move yourself before it tops, or panic-cover a correct short at the first uncomfortable bounce. Neither failure is really about the setup — both come from being unprepared for how loud the crowd gets right before it's wrong. This strategy belongs on the Strategies Hub as one tool among many, reached for when the specific signature described here actually shows up, not as a default response to any stock that's had a strong run.
Common Questions About Shorting a Parabolic Top
Is a "parabolic reversal" the same thing as the Parabolic SAR indicator?
Parabolic SAR (Stop and Reverse) places dots above or below price that flip sides when a trend changes direction, and it's built to trail a position in an established trend — it doesn't measure acceleration, volume, or how stretched a move has become. A stock can be genuinely parabolic, accelerating with volume climaxing, while Parabolic SAR is still calmly trailing along below price, showing nothing unusual at all. Search for one expecting the other, and you'll either miss the real setup or act on a signal that was never built to catch it.
Key Takeaway: Treat the name overlap as a coincidence — this strategy is about reading price and volume directly, not about any single indicator.
How is shorting a parabolic top different from trading a breakdown in a bear market?
That difference changes almost everything about the trade. A breakdown setup has momentum, and often broader market weakness, providing tailwind; a parabolic short has neither — it's a bet purely on exhaustion mechanics in a single name, entered while the crowd is still buying. That's why the entry rules here are stricter and the invalidation is faster: there's no trend to fall back on if the read turns out wrong.
Key Takeaway: Parabolic reversal and breakdown trading solve different problems — one rides an existing decline, the other calls the exact moment an advance runs out of road.
Why does the volume on the climax candle matter more than the price it reaches?
A stock can print a new high on unremarkable volume and simply be continuing its trend; that's not exhaustion, it's strength. The climax candle is different because a disproportionate number of shares change hands relative to the rest of the move — often the single largest bar of the entire multi-session advance on whatever timeframe is being traded. That imbalance is consistent with what Karpoff's research on the price-volume relationship would predict: extreme price changes arrive with extreme volume, and it's the volume side of that pairing that reveals distribution taking place, not just another leg up.
Key Takeaway: A new high on light volume is trend continuation; a new high on the heaviest volume of the entire move is the signature this setup is built to catch.
What's the single biggest reason a parabolic short gets stopped out?
This is the setup's signature failure mode, and it's worth understanding mechanically rather than emotionally. When part of the original move was driven by short sellers getting squeezed, the population of traders shorting "too early" becomes additional buying pressure the moment they're forced to cover. That's why this strategy waits for the climax candle and its confirming candle instead of shorting the first sign of weakness — acting early doesn't just risk being wrong, it can actively contribute to the very continuation that stops the trade out.
Key Takeaway: Confirmation exists specifically to keep a trader out of the first leg of a squeeze, not just to improve the entry price.
Does this setup only work on low-float stocks?
A large-cap stock can become technically overbought and reverse after a strong run, but with hundreds of millions or billions of shares outstanding, no single day's volume typically overwhelms the float the way it can in a stock with a float of a few million shares. Large-float exhaustion tends to unwind over several sessions, with smaller candles and less squeeze risk, while low-float exhaustion compresses the entire cycle into hours. The mechanics described throughout this guide apply to both; the position sizing and stop placement should not.
Key Takeaway: Scale position size to float and volatility, not to a fixed dollar or share amount used across every stock.
What RVOL reading actually separates a genuine exhaustion day from a normal strong session?
Below that range, a big green day is often just a stock in a strong, sustainable uptrend — exactly the kind of stock the broader momentum literature, including George and Hwang's research on stocks near their highs, shows tends to keep working rather than reverse. RVOL running well above 10x, especially alongside a visibly steepening intraday angle, is where the acceleration becomes unusual enough to treat as a real candidate. The number is a filter for narrowing a watchlist, not a trigger to act on by itself.
Key Takeaway: Use RVOL to build a list of candidates, then wait for the climax-and-confirmation sequence before acting on any single name.
What scan filters would actually surface parabolic exhaustion candidates in real time?
A platform like Trade Ideas can run this kind of multi-condition scan continuously through the session, surfacing gappers and momentum names by percentage move, RVOL, and float rather than requiring a trader to manually flip between charts hoping to catch a climax candle as it happens. The scan does the finding; the setup rules covered earlier still govern the entry.
Key Takeaway: A scanner narrows hundreds of moving stocks down to a short list — it doesn't replace waiting for the climax-and-confirmation sequence to complete.
Why do hard-to-borrow fees change the math on this trade?
This is a mechanical reality of short selling that a price chart alone never shows: a broker needs locatable shares to lend before a short sale can execute at all, and demand for those shares spikes exactly when a stock is running hardest. A trade that looks clean on the chart can turn out expensive, limited to a small number of shares, or entirely unavailable to short, depending on borrow supply that morning. Check locate availability and the fee before sizing the trade — that's part of the setup, not an afterthought.
Key Takeaway: Confirm shares are actually available to borrow, and at what fee, before assuming the mechanical entry rules alone decide whether the trade is viable.
Can buying puts replace a short position for this setup?
A long put on a stock exhausting a parabolic move caps the maximum loss at the premium paid, which matters given how violent a failed short can be if a second leg develops. The tradeoff is that options on small, fast-moving names often carry wide bid-ask spreads and rich premiums precisely because implied volatility is elevated at the top of a parabolic move — the same excitement that creates the setup also makes the insurance expensive. Traders who prefer defined risk over borrow-fee uncertainty tend to lean toward this version once they understand how that pricing works.
Key Takeaway: Puts trade borrow risk and unlimited loss for premium cost and time decay — neither version removes risk, it just relocates where the risk sits.
Does the reversal have to happen on a gap, or can it develop without one?
Multi-day runners often do climax with an overnight or pre-market gap, since reduced liquidity outside regular hours tends to combine with news catalysts to produce the most dramatic single moves. But a stock can just as easily go parabolic intraday — opening only modestly higher, then accelerating through the morning on nothing but volume and momentum before climaxing and reversing well before the close. The setup rules covered earlier apply the same way in either case; only the specific time window changes.
Key Takeaway: Watch for the acceleration-and-climax signature itself, not for a gap, since the gap is common but never required.
Disclaimer
Article Sources
- De Bondt & Thaler (1985), "Does the Stock Market Overreact?", The Journal of Finance - foundational research on market overreaction to dramatic price moves and the reversals that tend to followonlinelibrary.wiley.com
- Diether, Lee & Werner (2009), "Short-Sale Strategies and Return Predictability", Review of Financial Studies - empirical evidence that short sellers trading into recent strength correctly anticipate weaker returns aheadacademic.oup.com
- Karpoff (1987), "The Relation Between Price Changes and Trading Volume: A Survey", Journal of Financial and Quantitative Analysis - the empirical basis for reading a volume climax alongside pricecambridge.org
- George & Hwang (2004), "The 52-Week High and Momentum Investing", The Journal of Finance - evidence that proximity to a high tends to predict continued strength rather than reversal on its ownonlinelibrary.wiley.com
- Bulkowski, "Gauging Gaps" - long-standing empirical documentation of exhaustion gaps and how quickly they tend to fillthepatternsite.com