
The Morning Star / Evening Star Reversal Strategy

In this article10 sections
Two respected research approaches looked at the same three-candle pattern and reached opposite conclusions. One found it reverses price roughly seven times out of ten. The other, using a statistical method built specifically to weed out patterns that only look meaningful by chance, found no measurable edge at all. Both are worth taking seriously, and understanding why they disagree is more useful than picking a side.
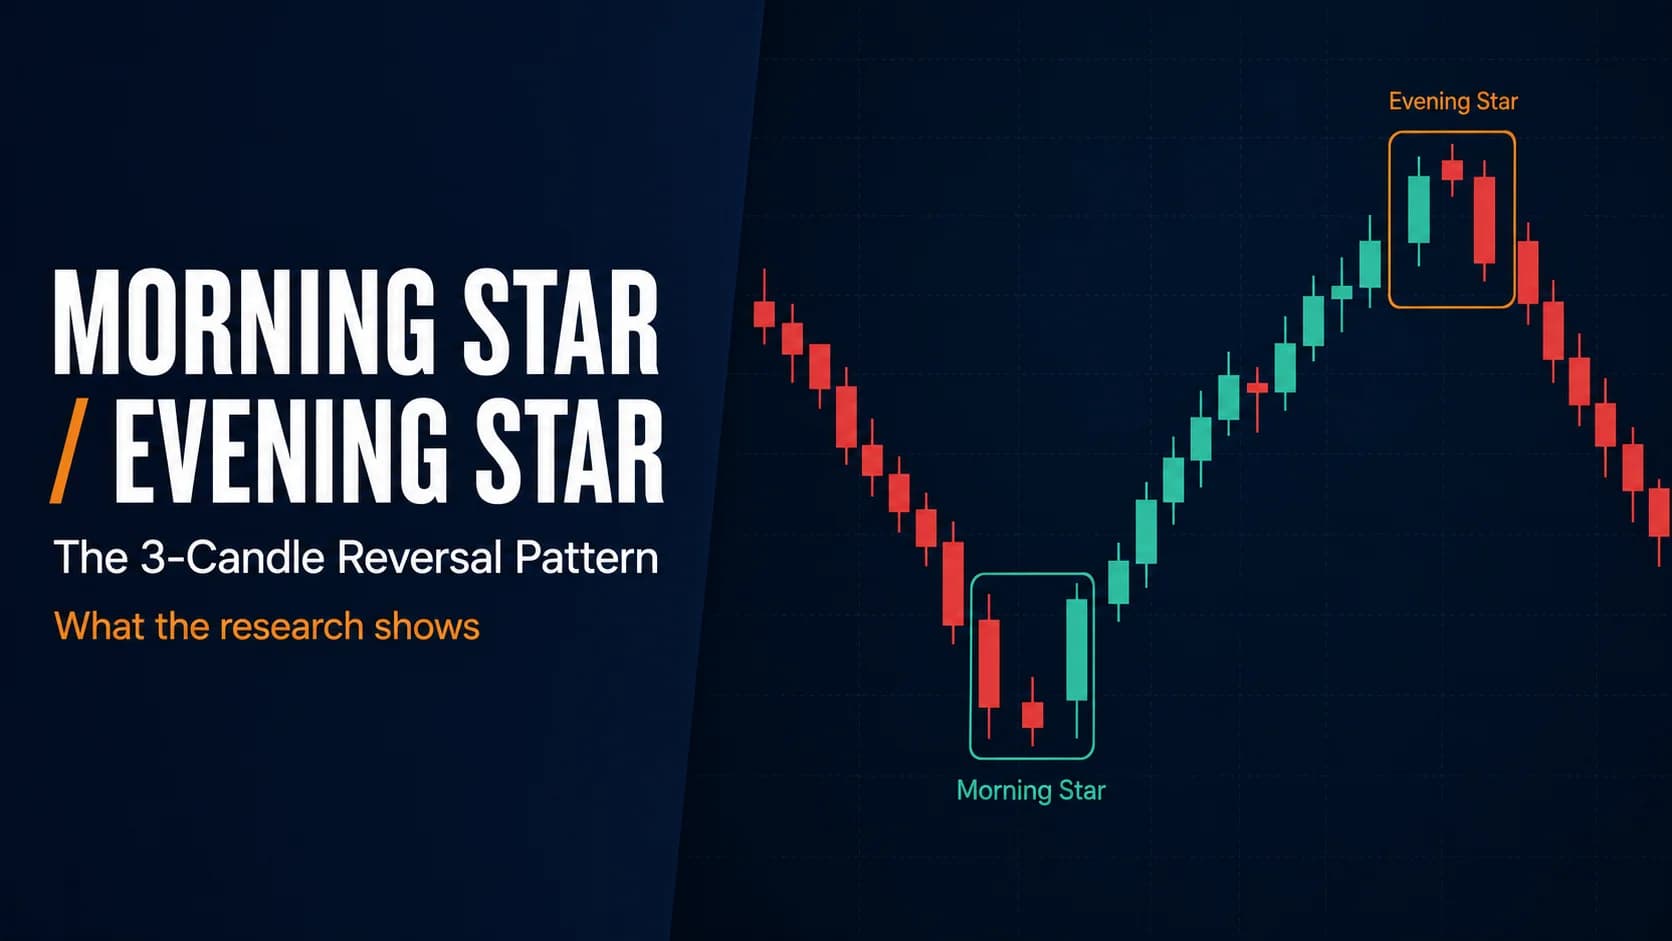
What is the morning star / evening star strategy? The morning star is a bullish, three-candle reversal pattern that forms at the bottom of a downtrend; the evening star is its exact mirror, a bearish three-candle pattern that forms at the top of an uptrend. Both consist of a long candle in the trend's direction, a small-bodied "star" candle showing indecision, and a long candle in the opposite direction that closes well back into the first candle's body.
Why This Is a Shape-Based Pattern, Not a Volume or Day-Count One
Every reversal setup covered elsewhere on this hub is built around a different kind of evidence. The parabolic reversal strategy reads a volume climax. The reversal volume spike strategy reads a statistical anomaly in trading volume itself. The first red day strategy reads a classification applied across whole daily sessions. This pattern reads none of that. It's defined entirely by the shape and relative position of three consecutive candles — their body sizes, whether they gap, and how far the third candle pierces back into the first.
That makes it one of the oldest forms of technical analysis in existence, tracing back to Japanese rice trading centuries before modern volume data or statistical software existed. It also makes it something genuinely different to evaluate: there's no volume threshold or day count to check, just a specific visual and structural relationship between three bars that either holds up or doesn't.
The Exact Criteria That Separate a Real Star Pattern From Random Three Candles
A morning star requires three specific things in sequence. Readers who need a refresher on reading candlestick charts at a basic level should start there before this section. First, a long bearish candle continuing an existing downtrend — a real body, not a doji or a thin bar, showing sellers still in clear control. Second, a small-bodied candle that gaps down from the first candle's close, or at minimum shows little overlap with it; this candle can close up or down, and its narrow range is what signals hesitation rather than continued conviction in either direction. Third, a long bullish candle that closes well back into the first candle's body — the further it pierces, ideally past the body's midpoint, the more convincing the reversal.
The evening star is the exact same structure inverted: a long bullish candle continuing an uptrend, a small-bodied star gapping up from it, then a long bearish candle closing well back into the first candle's body.
Each candle in the sequence has a specific psychological story behind it, and understanding that story helps explain why the pattern's proponents find it so intuitive. The first candle represents the existing trend still firmly in control — sellers pressing a downtrend, or buyers pressing an uptrend, with real conviction. The star candle represents a moment where that conviction visibly stalls: neither side can push price meaningfully further, which is exactly the kind of pause that tends to precede an actual change in control. The third candle represents the other side stepping in decisively enough to erase a meaningful portion of the prior trend candle in a single move. Whether that story translates into a statistically reliable trading edge is a separate question, covered honestly below.
One honest modernization is worth stating directly. Classical candlestick theory, developed for daily charts in markets with genuine overnight gaps, treats the gap on either side of the star candle as a meaningful reliability signal. On intraday timeframes in modern, continuously-traded markets, true gaps are far less common outside of the session open — a 5-minute or 15-minute chart rarely produces the clean gaps a daily chart does. Most traders applying this pattern intraday relax the gap requirement and focus on the core relationship instead: a small-bodied candle showing real hesitation, sandwiched between two long candles pointing in opposite directions.
What Rigorous Testing Actually Found
This is where honesty matters more than enthusiasm. Marshall, Young, and Rose's 2006 study in the Journal of Banking & Finance tested 14 candlestick patterns, including reversal patterns built on this same three-candle logic, using a bootstrap methodology specifically designed to generate random price series and check whether real candlestick signals beat what chance alone would produce. On Dow Jones Industrial Average stocks over a ten-year period, they found no statistically significant value. Horton's 2009 follow-up study examined nine candlestick patterns, including star patterns specifically, across 349 S&P 500 stocks, and concluded that using stars, crows, or doji patterns to trade individual stocks isn't a recommended approach on its own.
Thomas Bulkowski's own research, built from a private testing methodology across nearly five million candle lines for his Encyclopedia of Candlestick Charts, tells a different story. By his measurements, the evening star acts as a genuine bearish reversal in the large majority of cases he sampled, ranking among the stronger candlestick patterns he's tested for reversal reliability — though he's also transparent that it's a comparatively rare pattern to find, which means fewer samples back up that number than back up more common patterns.
Neither researcher is wrong about their own data; the disagreement comes down to methodology. A bootstrap test specifically controls for what a random sequence of candles would produce by chance, which is a stronger check against the possibility that a pattern only looks meaningful in hindsight. A simpler before-and-after performance measurement, however large the sample, doesn't rule out that same possibility as rigorously. The honest takeaway isn't that one candlestick book is right and the academic literature is wrong, or vice versa — it's that this specific pattern's standalone predictive power is genuinely more contested than its popularity would suggest, which argues strongly for treating it as one piece of confirming evidence rather than a signal to trade in isolation.

The Setup Specification: Eight Rules for Trading the Pattern
Every component below is a hard rule for identifying and trading a valid pattern — not a suggestion for what "usually" counts.
- Component
- Market Conditions Required
- Rule
- A clear existing trend before the pattern — a downtrend for a morning star, an uptrend for an evening star. The pattern forming inside a directionless range is a weaker, lower-confidence version.
- Component
- Time of Day
- Rule
- Works on any timeframe; on intraday charts, relax the classical gap requirement and focus on the star candle's small body and lack of overlap instead.
- Component
- Stock Selection Criteria
- Rule
- No specific float or volume threshold required, though a real support level (morning star) or resistance level (evening star) underneath or above the pattern adds meaningful confirmation.
- Component
- Entry Trigger
- Rule
- Enter after the third candle closes, typically at the following candle's open — never mid-pattern, before the third candle has actually confirmed.
- Component
- Stop Loss
- Rule
- Below the lowest point of the three-candle pattern for a morning star; above the highest point of the three-candle pattern for an evening star.
- Component
- Initial Profit Target + Scaling
- Rule
- First scale-out at the nearest prior support or resistance level; a measured-move target using the first candle's height is a common secondary target.
- Component
- Trade Management
- Rule
- Trail the stop behind new higher lows (morning star) or lower highs (evening star) as the reversal develops.
- Component
- Invalidation Criteria
- Rule
- A new low below the pattern (morning star) or new high above the pattern (evening star) invalidates the setup immediately.
| Component | Rule |
|---|---|
| Market Conditions Required | A clear existing trend before the pattern — a downtrend for a morning star, an uptrend for an evening star. The pattern forming inside a directionless range is a weaker, lower-confidence version. |
| Time of Day | Works on any timeframe; on intraday charts, relax the classical gap requirement and focus on the star candle's small body and lack of overlap instead. |
| Stock Selection Criteria | No specific float or volume threshold required, though a real support level (morning star) or resistance level (evening star) underneath or above the pattern adds meaningful confirmation. |
| Entry Trigger | Enter after the third candle closes, typically at the following candle's open — never mid-pattern, before the third candle has actually confirmed. |
| Stop Loss | Below the lowest point of the three-candle pattern for a morning star; above the highest point of the three-candle pattern for an evening star. |
| Initial Profit Target + Scaling | First scale-out at the nearest prior support or resistance level; a measured-move target using the first candle's height is a common secondary target. |
| Trade Management | Trail the stop behind new higher lows (morning star) or lower highs (evening star) as the reversal develops. |
| Invalidation Criteria | A new low below the pattern (morning star) or new high above the pattern (evening star) invalidates the setup immediately. |
The entry rule deserves emphasis: acting before the third candle closes defeats the entire purpose of the pattern, since the third candle's close, and how far it pierces the first candle's body, is what separates a real reversal from a star candle that goes nowhere. Waiting costs a small amount of the move in exchange for real confirmation.
Volume adds a meaningful layer of confidence where it's available. A morning star with lighter-than-average volume on the first candle and a clear pickup in volume on the third candle is a stronger version of the pattern than the same shape with flat volume throughout — the same logic this hub applies to every reversal setup, just checked against a specific candlestick shape instead of a standalone volume threshold.
A Candle-by-Candle Walk-Through: Trading a Morning Star in a Hypothetical Downtrend
Consider a hypothetical mid-cap stock, ticker JKL, trading on an hourly chart after a multi-hour decline into a known support zone. None of the prices below are real; they're constructed to show the mechanics in action.
Hour 1: JKL opens at $22.80 and closes at $21.50 — a long bearish candle continuing the day's downtrend, with real conviction behind the move.
Hour 2: JKL opens at $21.40, trades in a narrow $21.00 to $21.55 range, and closes at $21.45 — a small-bodied star candle showing almost no net movement after the prior hour's sharp drop. There's little to no true gap here since this is an intraday chart, but the body barely overlaps hour 1's close, and the narrow range is the signal that matters.
Hour 3: JKL opens at $21.50 and climbs to close at $22.70 — a long bullish candle that pierces back through almost the entire body of hour 1's decline, well past the midpoint. This is the confirming candle.
A long position is initiated at the open of hour 4, around $22.70 to $22.80, with a stop below the pattern's lowest point at $21.00 (with a small buffer). The first target sits at the nearest resistance level above, with a secondary measured-move target adding hour 1's roughly $1.30 range on top of the pattern's low.
An evening star at the top of an uptrend works identically in reverse. Picture JKL, weeks later, climbing through a multi-hour rally into a level where price has stalled before. Hour 1 opens at $28.20 and closes at $29.60 — a long bullish candle pressing into that overhead level with real conviction. Hour 2 opens at $29.70, trades in a narrow $29.55 to $29.90 range, and closes at $29.65 — a small-bodied star showing the rally has lost its momentum right at the level that mattered. Hour 3 opens at $29.55 and closes at $28.35, piercing back down through most of hour 1's body. A short position is initiated at the open of hour 4 near $28.30, with a stop above the pattern's high at $29.90, targeting the level from which the rally originally launched.
Managing the Position Once the Third Candle Confirms
Trail the stop behind new higher lows for a morning star, or new lower highs for an evening star, using the same discipline this hub applies to every reversal setup. Because the entry already waited for full confirmation, there's less reason to exit at the first sign of resistance — let the position work toward the first target rather than trimming reflexively.
The one habit to avoid: adding to the position if the pattern's own invalidation level breaks. A new low below a morning star, or a new high above an evening star, means the reversal didn't hold, and averaging into that outcome compounds a loss the setup was specifically designed to define in advance.

Adapting the Setup Across Variants and Confirmation Layers
The doji star variant — where the middle candle is specifically a doji, with its open and close at or near the same price — is generally considered a stronger version of the pattern than an ordinary small-bodied star, since a doji represents a more extreme moment of indecision than a small body with some directional lean. Both Bulkowski's data and classical candlestick theory treat the doji version as the higher-confidence variant, even though it's rarer. A doji forming as the star candle also tends to draw more attention on a chart, precisely because its shape is visually distinctive compared to an ordinary small-bodied candle, which can make it easier to spot across a watchlist even without a scanning tool doing the work.
Given the honest split in the academic evidence, pairing this pattern with an independent form of confirmation is worth doing deliberately rather than treating the candle shape alone as sufficient. A morning star forming exactly at a well-established support level, or an evening star forming at a level where price has failed before, carries more weight than the same shape appearing in the middle of nowhere. That said, academic testing that added momentum-indicator filters like RSI or stochastics to candlestick signals generally found only modest improvement at best — filtering doesn't turn a weak signal into a strong one by itself, which argues for treating confirmation as a genuine second, independent piece of evidence (a real support or resistance level, a broader trend context) rather than another derivative of the same price data.
Scanning for the Pattern Across a Watchlist
Manually scanning chart after chart for a specific three-candle shape doesn't scale across a broad watchlist, and pattern-recognition scanning is exactly the kind of repetitive visual task worth automating. A useful scan filters for stocks with a recent long trend candle followed by a narrow-range candle, then flags names worth checking by eye for the confirming third candle as the session develops.
Trade Ideas is built to run pattern and technical scans like this as a comprehensive scanning and research platform, with built-in charting to review each candidate's candle structure directly without switching tools. The scan narrows a broad list down to real candidates; confirming the actual three-candle relationship, and waiting for the third candle to close, still governs the entry.
Sizing the Star Pattern Trade Inside a Broader Plan
Given the genuinely mixed research record, this pattern earns a place on this hub as a confirming tool and a way of reading price structure — not as a standalone edge to size up aggressively on its own. Traders who treat every morning star or evening star as a high-confidence signal, independent of trend context or a real support and resistance level, are extending more confidence to the pattern than the more rigorous academic literature supports. Part of that overconfidence is simply human: people are prone to seeing meaningful patterns in what's sometimes closer to noise, a tendency this hub's guide to cognitive biases in trading covers in more depth, and candlestick patterns — visually satisfying, named, and taught everywhere — are a natural target for exactly that bias.
Position size should reflect that honestly: similar to or smaller than the size used for setups on this hub with cleaner supporting evidence, sized as a defined risk in R-multiples against the pattern's own high or low. This strategy belongs on the Strategies Hub as a way of reading candle-level price structure — genuinely useful alongside trend, support and resistance, and volume, but not a substitute for any of them.
Common Questions About Trading Morning Star and Evening Star Patterns
How is this different from the parabolic reversal or reversal volume spike strategies covered elsewhere on this hub?
A stock can form a textbook morning star or evening star on completely unremarkable volume, and the pattern still technically qualifies. Volume can strengthen the read, as described in the setup specification, but it isn't part of the core definition the way it is for this hub's other reversal setups.
Key Takeaway: This is a price-shape pattern first; volume is a confirming layer, not a requirement.
Does the star candle actually need to gap, or is that requirement outdated?
The underlying idea — a small-bodied candle representing real hesitation between two long, opposite-direction candles — still holds without a textbook gap. Insisting on a full gap on a 5-minute or 15-minute chart would filter out most valid patterns simply because that timeframe rarely produces true gaps at all.
Key Takeaway: Treat the gap as a bonus confirmation on charts where it naturally occurs, not a hard requirement everywhere.
What's the difference between a morning star and a morning doji star?
Both practitioner testing and classical theory treat the doji version as the stronger signal, since a doji represents a more extreme moment of indecision than a small body that still closed meaningfully higher or lower than it opened.
Key Takeaway: A doji middle candle is a genuine upgrade in signal quality, not just a stricter technicality.
Do candlestick patterns like this actually have academic backing?
Neither side is simply wrong; the disagreement reflects real differences in how each approach controls for the possibility that a pattern only looks meaningful in hindsight. That genuine split is a good reason to treat this pattern as one input among several rather than a standalone, statistically-proven edge.
Key Takeaway: Respect the pattern's long history and practitioner track record, but don't mistake either for settled academic proof.
How far does the third candle need to pierce into the first candle's body?
A third candle that barely closes into the edge of the first candle's body is a much weaker version of the pattern than one that closes near the first candle's open, effectively erasing most of the prior trend candle in a single move.
Key Takeaway: Use the depth of the third candle's close as a rough confidence gauge, not just a pass/fail checkbox.
What's the most common way traders misidentify this pattern?
A long trend candle followed by a small-bodied candle is only two-thirds of the pattern. Without a genuine, deep-piercing third candle, what looks like a forming star can just as easily resolve as trend continuation instead of reversal.
Key Takeaway: Don't call the pattern before the third candle has actually closed and confirmed the reversal.
Does this pattern work on intraday timeframes, or only daily charts?
The core three-candle logic — trend candle, indecision candle, confirming candle — translates to a 15-minute or hourly chart the same way it does to a daily one; only the gap expectation needs adjusting for the timeframe in use.
Key Takeaway: Apply the same three-candle structure at any timeframe, adjusting only the gap expectation for how continuously the instrument trades.
Should this pattern be used standalone, or does it need confirmation?
Academic testing that added momentum-indicator filters to candlestick signals generally found only modest improvement, which suggests the most useful confirmation isn't another derivative of the same price data but something genuinely independent, like a level where the market has actually reacted before.
Key Takeaway: Confirm with real support and resistance context, not just another indicator built from the same candles.
Why does Bulkowski's data show such a high reversal rate if academic studies are skeptical?
A pattern can show a high raw reversal rate and still fail a bootstrap test, if the broader market or that stock's own volatility would have produced a similar-looking move with or without the specific three-candle shape preceding it. Neither number is fabricated; they're answering genuinely different questions about the same pattern.
Key Takeaway: A high reversal rate answers "did price move as expected," while a bootstrap test answers the harder question of "more than chance would predict anyway."
Does this pattern work better in some markets than others?
That split is consistent with a market-efficiency explanation: candlestick patterns may retain more genuine value in markets that are less thoroughly analyzed by professional and algorithmic traders, while in heavily-scrutinized markets like U.S. large-caps, any edge a simple visual pattern once offered has likely been arbitraged away.
Key Takeaway: Don't assume a finding from one market's stocks automatically transfers to a different market with different levels of analyst and algorithmic attention.
Disclaimer
Article Sources
- Marshall, Young & Rose (2006), "Candlestick Technical Trading Strategies: Can They Create Value for Investors?", Journal of Banking & Finance - a bootstrap-methodology study finding no statistically significant value for 14 candlestick patterns on Dow Jones stocks
- Horton (2009), "Stars, Crows, and Doji: The Use of Candlesticks in Stock Selection", The Quarterly Review of Economics and Finance - a follow-up study focused specifically on star-and-doji patterns, reaching a similarly skeptical conclusion
- Bulkowski, "Evening Star Candle Pattern" - practitioner research finding a high reversal rate for this pattern across nearly five million tested candle lines
Was this helpful?
Be the first to weigh in

Written by
Kazi Mezanur RahmanFounder, independent researcher, and editor of DayTradingToolkit, a one-person publication focused on risk-first trading education, documented tool research, and clear explanations.
Keep Reading
Strategies
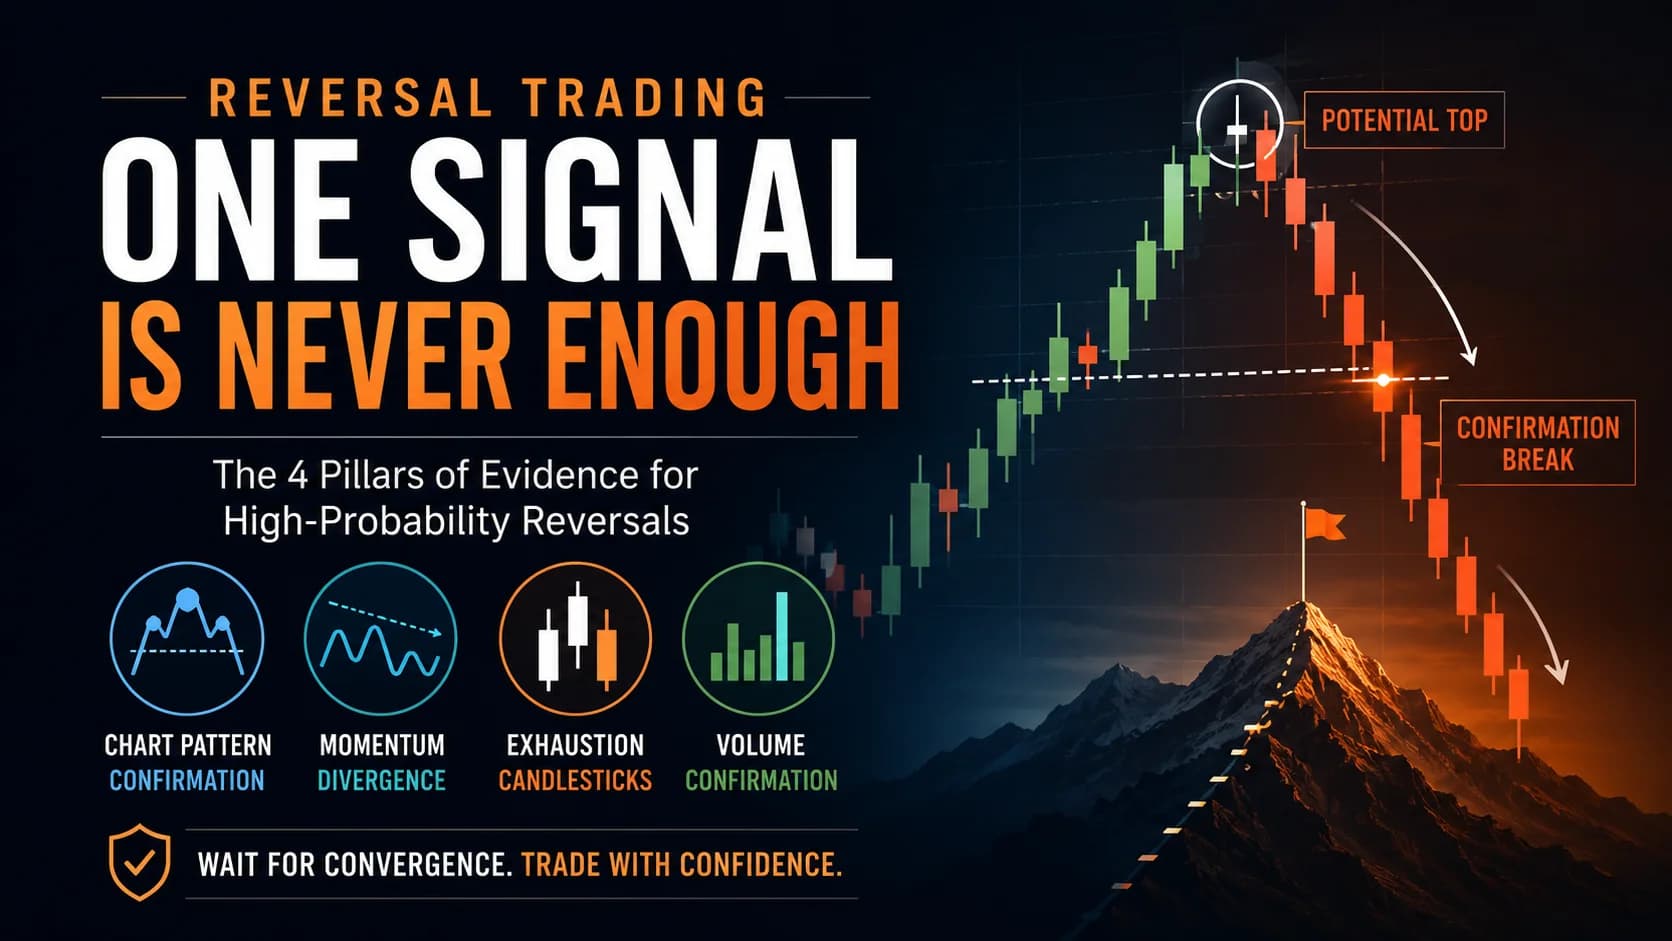
The Reversal Trading Playbook: How to Call a Market Turn
No single indicator calls a top or bottom. This guide covers the four pillars of reversal evidence and how many need to align before a trade is justified.
Strategies
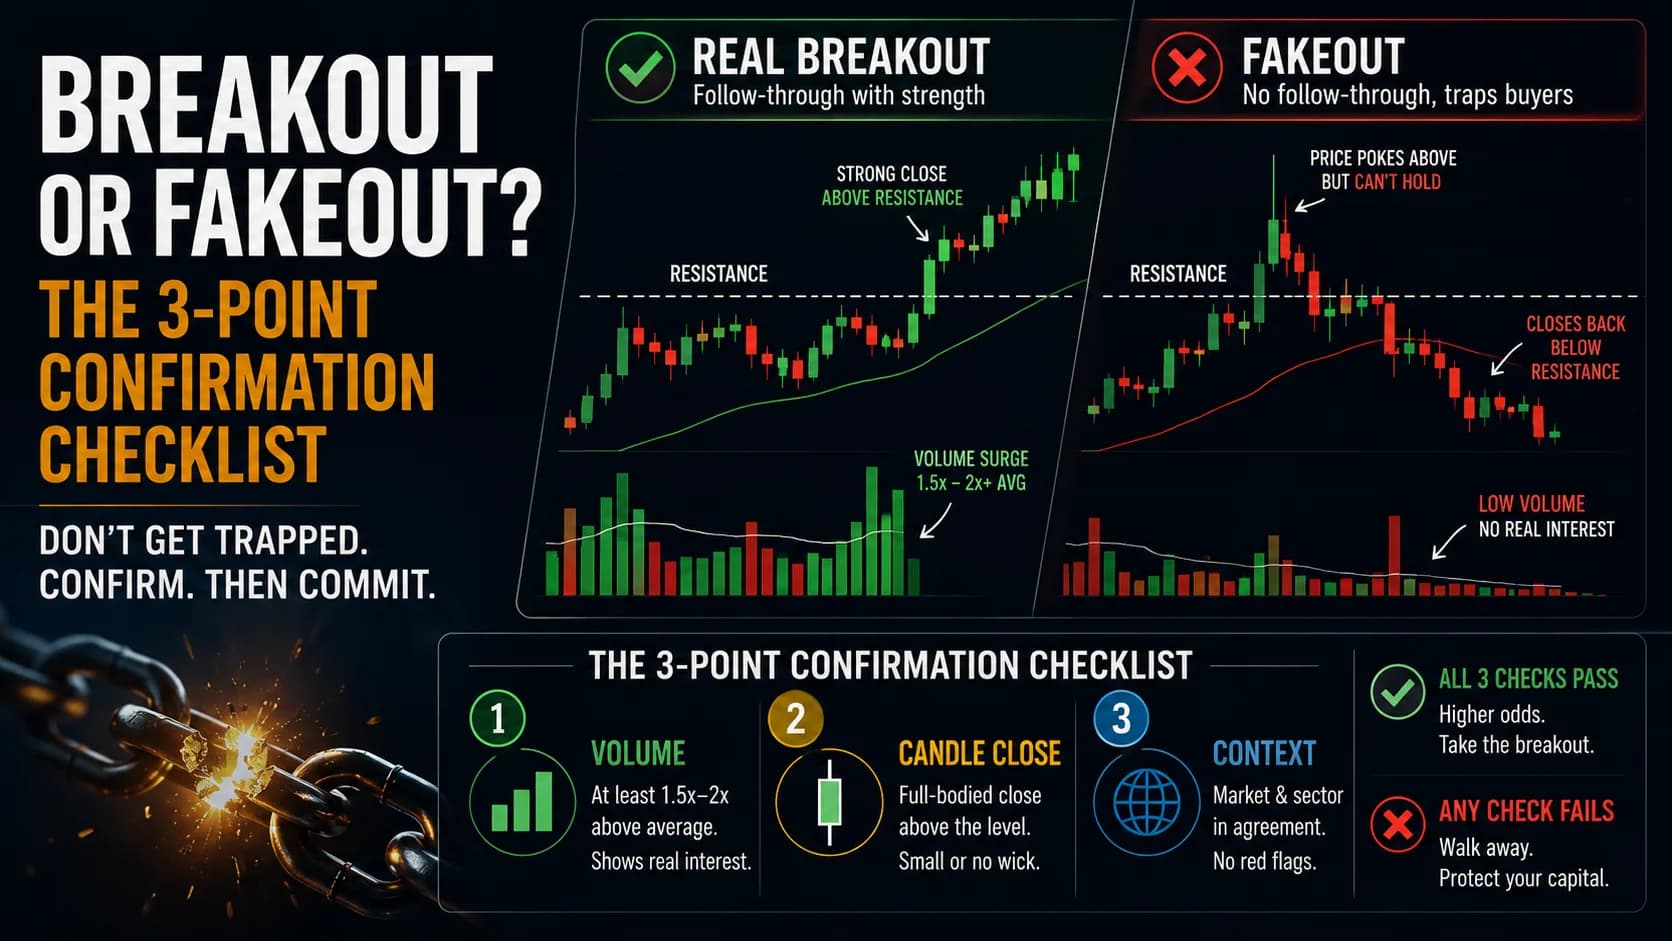
The Breakout vs. Fakeout Strategy: Our 3-Point Checklist
Not every break of resistance is real. This guide covers the volume, candle-close, and context checks that separate a genuine breakout from a costly trap.
Strategies
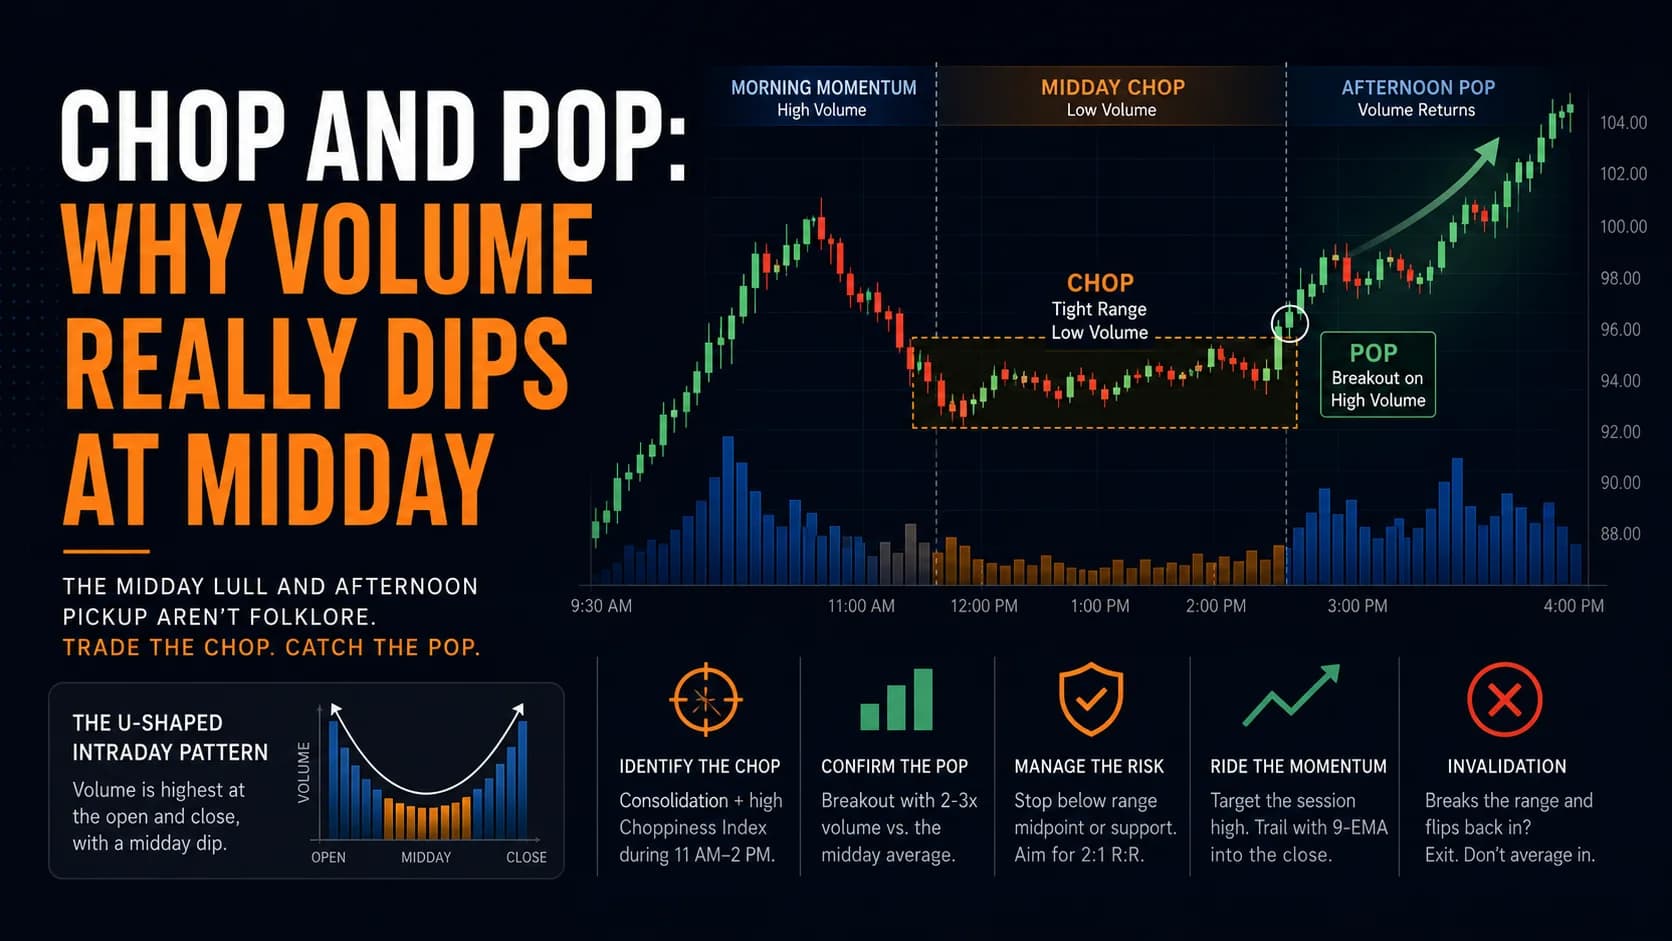
The "Chop & Pop": Our Playbook for Trading Afternoon Reversals
The midday lull and afternoon pickup aren't trading folklore. This guide covers the research behind it, quantifying the chop, and trading the pop properly.
Strategies
Life in the Fast Lane: An Introduction to Scalping Techniques
Scalping promises quick, repeatable wins, but the real economics are brutal. This guide covers the mindset, tools, and honest math before you try it yourself.
Comments
No comments yet. Be the first to share your thoughts.