A stock that's tripled over three green days trades one session in the red, and half the traders watching it start arguing about whether the run is over. The argument itself is the tell. A multi-day runner doesn't need a crash to signal exhaustion — it just needs to close below where it closed the day before, for the first time since the run began. That single, simple fact is the entire basis of one of the oldest short-selling patterns in small-cap trading.
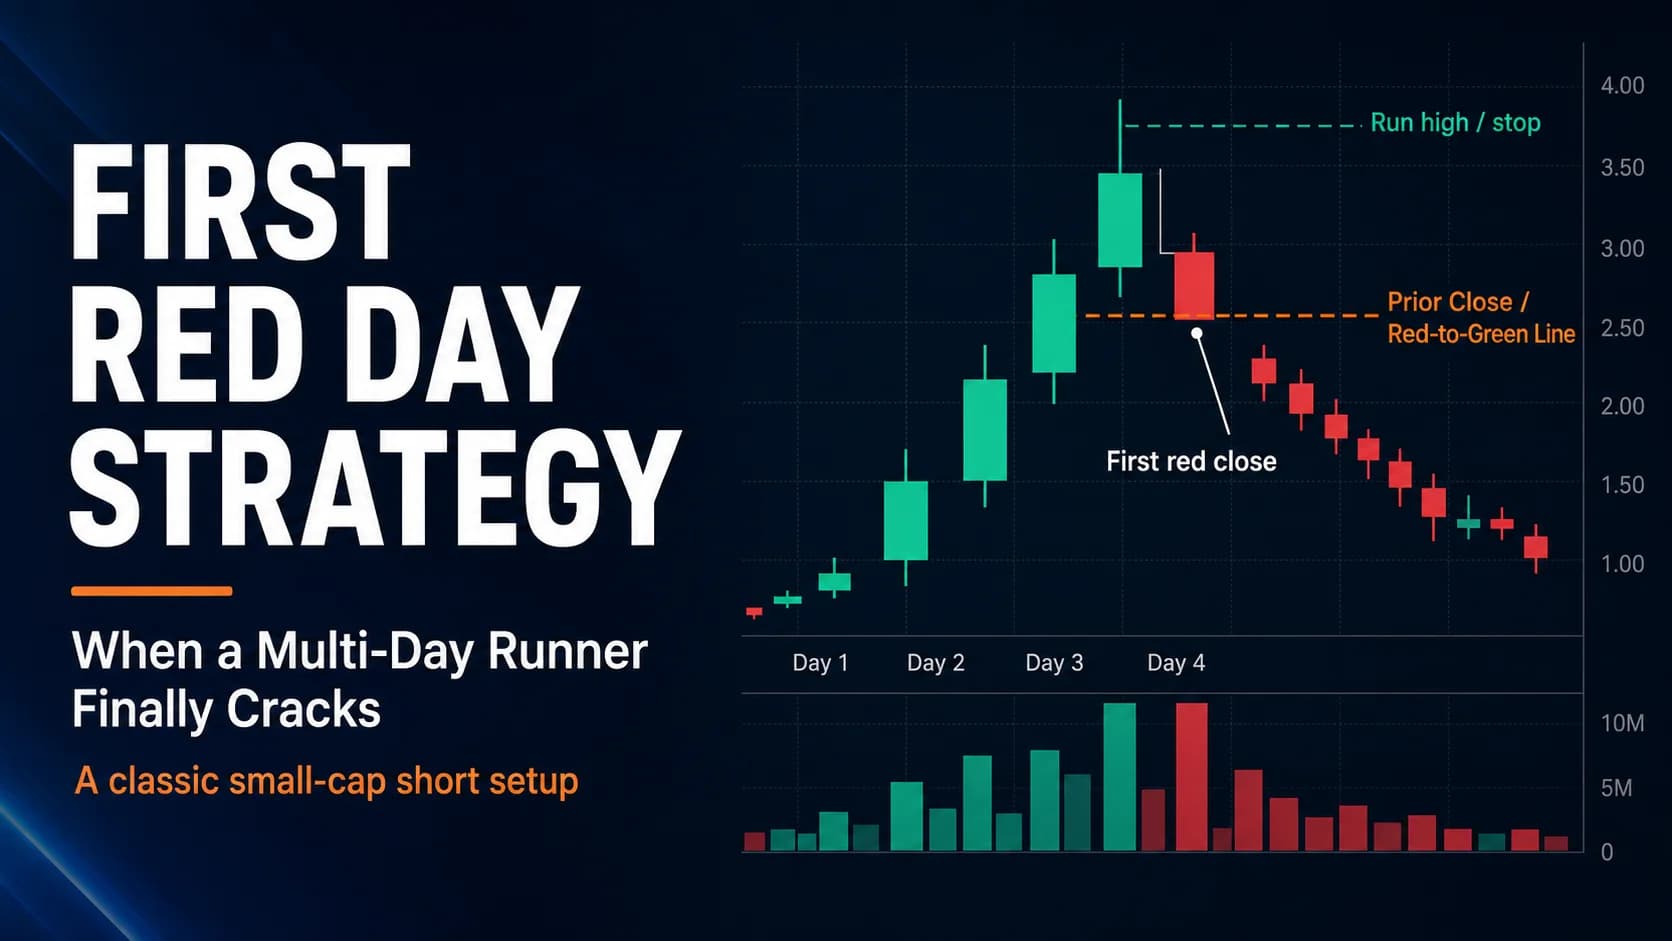
What is the first red day strategy? The first red day strategy involves shorting a small-cap or low-FloatFloat is the number of shares of a company that are actually available for public trading — it excludes shares held by insiders, major institutions with lock-ups, and the company itself.Read definition → stock the first time it closes below the prior session's close after a multi-day run of consecutive green days. It treats that prior close as a specific price level — not a vague sense that a stock "looks tired" — and waits for price to break and hold below it before entering.
Why the First Red Day Is a Daily Pattern, Not an Intraday One
Every reversal setup on this hub has, so far, been built around a single candle: a climax bar, a statistical VolumeVolume is the total number of shares (or contracts) traded during a given time period — it's the primary confirmation tool for all price action, because a price move accompanied by high volume indicates genuine market participation, while tRead definition → spike, a specific intraday shape. The first red day works on a completely different unit of analysis. It's a classification applied across whole trading sessions — Day 1, Day 2, Day 3 of a run — and the signal it watches for is the first entire session that closes lower than the one before it, not any particular candle within that session.
That distinction matters because it changes what "confirmation" even means. This hub's parabolic reversal strategy waits for a specific intraday climax candle and its confirming follow-through, all within one session. The first red day setup instead asks a simpler daily question — did today close below yesterday's close, after a real run of green days before it — and treats the prior day's close itself as the level that has to break and hold. A stock can look shaky intraday for hours and still close green; a stock can open weak, ChopChop is a market condition where price oscillates back and forth in a tight, directionless range with no follow-through in either direction — breakouts fail, pullbacks reverse, and every trade feels like a coin flip.Read definition → around all day, and close a fraction below yesterday's close and qualify. The daily close is what counts, not the shape of any single bar.
It's also worth being direct about why this pattern gets taught so often: it's genuinely one of the oldest, most repeated setups in small-cap Short SellingShort selling is borrowing shares from a broker and selling them at the current price with the intention of buying them back later at a lower price — profiting from the price decline, but with theoretically unlimited loss potential if the sRead definition →, precisely because the underlying behavior it exploits — late buyers chasing a run, then getting trapped when the run pauses — repeats constantly in low-float names with real retail attention.
What Actually Qualifies a Stock as a "Runner" Worth Shorting
Not every stock that's up two days in a row is a candidate. A first red day only means something after a genuine run: this hub's own A+ setup filtering framework applies directly here — the goal is finding the handful of names that meet a real bar, not treating every green stretch as a setup.
A qualifying run typically shows at least two, and more reliably three or more, consecutive sessions closing higher than the one before, each on volume well above the stock's normal average, with the stock's cumulative gain running into multiples of where it started. Low float amplifies the pattern the same way it does throughout this hub's reversal setups — fewer shares available to trade means the same dollar amount of buying or selling moves price further, producing sharper runs and sharper reversals. A real CatalystA catalyst is the specific event or news item that triggers unusual price movement in a stock — earnings reports, FDA decisions, analyst upgrades, acquisition announcements, product launches, and short squeeze setups are all catalysts. WithRead definition → is common (a clinical trial update, a contract announcement, a name recognizable from retail chat rooms and social media) but the specific news matters less than the fact that a genuine crowd has formed around the stock.
One underused warning sign worth watching for: a green day that fails to hold its own intraday highs. A session that gaps up, spikes to a new high, and then fades to close only modestly green is often straining even though the daily candle still counts as another green day. That kind of session frequently precedes the actual first red day and is worth treating as an early alert rather than waiting for the red close itself to start paying attention.
The Setup Specification: Eight Rules for Trading the Crack
Every component below is a hard rule, because the entire value of this pattern comes from a specific, checkable price level rather than a subjective sense that a run is done.
- Component
- Market Conditions Required
- Rule
- At least two, more reliably three or more, consecutive daily closes higher than the prior close, on volume well above normal, with a real catalyst or retail-driven crowd behind the move.
- Component
- Time of Day
- Rule
- Can trigger at any point in the session once price breaks and holds below the prior day's close; entries late in the day add overnight gap risk since the short is usually held through the close.
- Component
- Stock Selection Criteria
- Rule
- Low float amplifies the setup; a fading intraday high on the most recent green day is an optional but valuable early warning sign that the run is straining.
- Component
- Entry Trigger
- Rule
- Price breaks below the prior day's close (the "red-to-green" line) and holds below it rather than reclaiming; a more conservative variant waits for the full session to close below that level before shorting the next session's weakness instead.
- Component
- Stop Loss
- Rule
- Above the high of the entire run for an initial, small-size entry; a tighter stop above the current day's high or a recent lower high can be used for follow-up entries once more confirmation exists.
- Component
- Initial Profit Target + Scaling
- Rule
- First scale-out at the session VWAP or the prior green day's close, whichever is closer; further targets toward the level the run originally launched from.
- Component
- Trade Management
- Rule
- Cover into continued weakness; never add to the position on a reclaim of the prior day's close — that reclaim is the primary invalidation signal, not noise to ignore.
- Component
- Invalidation Criteria
- Rule
- Price reclaims and holds above the prior day's close, or the stock makes a new high above the run's high.
| Component | Rule |
|---|---|
| Market Conditions Required | At least two, more reliably three or more, consecutive daily closes higher than the prior close, on volume well above normal, with a real catalyst or retail-driven crowd behind the move. |
| Time of Day | Can trigger at any point in the session once price breaks and holds below the prior day's close; entries late in the day add overnight gap risk since the short is usually held through the close. |
| Stock Selection Criteria | Low float amplifies the setup; a fading intraday high on the most recent green day is an optional but valuable early warning sign that the run is straining. |
| Entry Trigger | Price breaks below the prior day's close (the "red-to-green" line) and holds below it rather than reclaiming; a more conservative variant waits for the full session to close below that level before shorting the next session's weakness instead. |
| Stop Loss | Above the high of the entire run for an initial, small-size entry; a tighter stop above the current day's high or a recent lower high can be used for follow-up entries once more confirmation exists. |
| Initial Profit Target + Scaling | First scale-out at the session VWAP or the prior green day's close, whichever is closer; further targets toward the level the run originally launched from. |
| Trade Management | Cover into continued weakness; never add to the position on a reclaim of the prior day's close — that reclaim is the primary invalidation signal, not noise to ignore. |
| Invalidation Criteria | Price reclaims and holds above the prior day's close, or the stock makes a new high above the run's high. |
The stop-loss rule deserves the most explanation, because it's genuinely wider than the stops used elsewhere on this hub. Anchoring the primary stop to the entire run's high — rather than a tighter intraday level — reflects real uncertainty about whether the run is actually finished; a stock can pull back for a session and resume climbing. That width is exactly why an initial entry should be small. A tighter stop above the current day's high is available for traders who want to add risk after the reclaim-or-hold question resolves in the short's favor, at the direct cost of a higher chance of getting stopped out prematurely on ordinary intraday noise.
Position sizing has to account for that wide primary stop directly. Risking a normal-sized position against a stop set at the run's high — sometimes 50% or more above the entry — turns an ordinary loss into an account-level event. Small initial size, sized to that wider stop rather than a habitual share count, is what makes the setup survivable when the read is wrong.
A Day-by-Day Walk-Through: Trading the Crack in a Hypothetical Runner
Consider a hypothetical low-float biotech, ticker GHI, following a positive early-stage trial update. None of the prices or events below are real; they're constructed to show the mechanics in action.
Day 1 (Monday): GHI closes at $2.10, up from a $1.40 prior close, on heavy volume as the news breaks. This is the run's first green day.
Day 2 (Tuesday): GHI gaps to $3.50, runs intraday to $4.80, and settles at $4.20 — another green day, and a strong one, with the close well off the intraday high but still a clear continuation.
Day 3 (Wednesday): GHI gaps again to $5.60 and spikes intraday to $7.90 — the most extended point of the run — before fading hard to close at $5.10. The daily candle is still green (up from Tuesday's $4.20), but giving back nearly $2.80 from the intraday high is the early warning sign described above: the run is straining even though the close still counts as a continuation.
Day 4 (Thursday): GHI opens at $4.90 — already below Wednesday's $5.10 close — and never reclaims that level through the session, drifting to a low of $3.80 before closing at $4.00. This is the first red day: the first session to close below the prior day's close since the run began.
An initial short is taken once it's clear during Thursday's session that the $5.10 level is holding as resistance rather than being reclaimed — say around $4.85 to $4.90 — sized small given a primary stop placed above the run's high near $7.90 (with a modest buffer). By the following session, GHI continues fading, testing the $3.50 gap level and, further out, working back toward the $2.10 area where the run first began. A tighter stop above a subsequent lower high can be used to add risk once the position has more confirmation behind it, without needing to risk the full distance to the run's high on that additional size.
Managing the Short Once the Red Day Confirms
Cover into continued weakness rather than waiting for a specific target to feel satisfying — if the read is right, the stock keeps giving up the gains from the run, session after session, and there's no requirement to hold for a single all-or-nothing exit.
Trail the stop down as new lower highs form across subsequent sessions, applying the same daily-level logic the entry used. The one rule that overrides every other consideration: never add to the position on a reclaim of the original prior-day close. That reclaim is the setup's own invalidation signal, not a dip to buy into with more risk.
Where This Strategy Fails: Reclaim Risk and Overtrading the Setup
The most common way this trade goes wrong is simple: the stock reclaims the prior day's close and keeps running. A single red day inside a genuine multi-day mania doesn't guarantee the mania is over — some of the most extended runners in small-cap history have paused for a red day and then resumed climbing for another week. That's precisely why the entry rule requires the level to hold, not just to be touched, and why the stop sits above the run's high rather than somewhere tighter and more comfortable.
Overtrading this exact pattern is a second, quieter failure mode. Because the first red day is a well-known, frequently-taught setup, it's tempting to force it onto every stock that's had two decent green days, or to keep re-shorting the same name through multiple failed attempts hoping the next one is the real crack. Many practitioners who trade this setup regularly cap themselves to a small handful of attempts on any single name before stepping aside — a discipline worth building deliberately rather than discovering the hard way. This hub's guide to overtrading covers the broader version of this same trap.
There's an honest academic wrinkle worth naming too. Classic momentum research — Jegadeesh and Titman's foundational 1993 study — documents that buying past winners and selling past losers is profitable over 3-to-12-month holding periods, and the paper is explicit that this effect does not operate over very short horizons. That's not a contradiction of this setup; it's a reminder that the first red day is a different phenomenon operating on a different timescale, concentrated specifically in the kind of small, illiquid, retail-driven stocks where academic research on short-run reversals (Avramov, Chordia, and Goyal's 2006 study among the most direct) finds the largest effects. That same research is honest that measured contrarian profits in their broad samples were often smaller than likely transaction costs — a reminder that execution discipline, not just the existence of the pattern, is what separates a real edge from a paper one.
Finally, short squeeze risk applies directly to this setup. A low-float runner that's attracted heavy short interest during its climb can still squeeze violently even after a red day, especially if any positive news reignites buying before the stop is hit.
Adapting the Setup Across Run Lengths and Confirmation Layers
Longer, more extended runs — four, five, or more consecutive green days — tend to produce more reliable first red days than shorter two-day pops, simply because more late buyers have accumulated at higher prices and have more to lose if the stock stalls. Shorter runs still qualify but deserve smaller size and a higher bar for the other conditions in the setup specification.
This pattern also complements other setups rather than replacing them. A first red day that develops alongside a failed retest of the run's highs, or a stock that gaps up and immediately sells off (a pattern sometimes called "gap and crap"), adds a layer of confirmation beyond the daily close alone. None of these variations changes the core mechanical trigger — the prior day's close still has to break and hold — but stacking a second, independent piece of evidence on top of it can help filter which qualifying setups are worth taking.
The long-side mirror of this pattern exists too: a stock that's had several consecutive red days finally closing green can mark the start of a bounce, using the same daily-classification logic in reverse. The entry, stop, and invalidation levels translate directly; only the direction changes.
Scanning for Multi-Day Runners Before the Red Day Prints
Manually tracking which small-cap stocks are on Day 2, Day 3, or Day 4 of a run, across a market with dozens of momentum names active at once, isn't practical without a scanning tool built for the job. A useful scan combines a multi-day percentage-gainer filter (cumulative gain over several sessions, not just today) with a float filter and a relative volume condition, to separate genuine multi-day runners from stocks having one unrelated good day.
Trade Ideas is built to run this kind of scan continuously as a comprehensive scanning and research platform, tracking cumulative multi-day performance and float alongside built-in charting to review each candidate's daily structure without switching tools. The scan narrows the market down to genuine runners worth watching for the first red day; confirming the actual break-and-hold below the prior close still governs the entry.
Sizing the First Red Day Trade Inside a Broader Plan
This is a short-selling strategy built around wide, structurally-necessary stops, which means position size has to flex to match. Risking the same dollar amount as a tighter intraday setup, at a stop set above an entire multi-day run's high, means using meaningfully fewer shares — the R-multiple framework this hub applies to every strategy is what keeps that math honest rather than left to feel.
The psychological trap here is specific and worth naming directly. Multi-day runners generate intense social-media and chat-room attention while they're climbing, and it's easy to let recency bias — the last few attempts worked, so this one should too — override the setup's actual qualifying criteria. This hub's guide to cognitive biases in trading covers this pattern in more depth. This strategy belongs on the Strategies Hub as a specific, well-defined tool for a specific situation — a genuine multi-day runner cracking for the first time — not a default reflex applied to any stock that's had a couple of green days.
Common Questions About Trading the First Red Day
How is the first red day different from the parabolic reversal strategy covered elsewhere on this hub?
A stock can qualify for a first red day without ever printing a dramatic intraday climax candle — it just has to close red after closing green for several sessions in a row. The two setups can and do overlap on the same runner, but they're triggered by different evidence and can fire at different times.
Key Takeaway: Use the parabolic reversal setup for a specific intraday exhaustion signature, and this setup for the simpler, daily question of whether the run itself has actually stopped.
What exactly is the "red-to-green line" and why does it matter?
Unlike a support or resistance level derived from chart patterns, this line is defined purely by yesterday's closing print, which makes it unambiguous and easy to mark before the session even opens. That clarity is the entire appeal of the setup: there's no interpretation required to know whether the stock is currently red or green relative to that line.
Key Takeaway: Mark the prior close before the session opens, and treat a hold below it — not just a brief touch — as the actual signal.
What's the most common way a first red day short fails?
This is why the entry rule requires the level to hold rather than just be touched intraday, and why the primary stop sits above the entire run's high rather than somewhere tighter that would feel more comfortable but get hit far more often by ordinary continuation.
Key Takeaway: A reclaim of the prior close isn't a minor annoyance to trade around — it's the setup's own built-in signal that the thesis was wrong.
How many consecutive green days are actually required before a stock qualifies?
Shorter two-day pops still technically qualify but deserve smaller size and a stricter read on the other conditions — real catalyst, low float, elevated volume — since a short run gives less evidence that a genuine crowd has actually formed around the stock.
Key Takeaway: Treat the day count as one input among several, not a single pass/fail threshold on its own.
Does the short have to wait for the full day to close red, or can it enter intraday?
The intraday version captures more of the move but carries a higher chance of getting caught by a same-day reclaim; the next-session version gives up some of the initial drop in exchange for a fully confirmed daily close before risking capital.
Key Takeaway: The intraday entry trades speed for confirmation risk, and the next-session entry trades some of the move for a cleaner signal — neither is strictly correct.
Why do many traders cap themselves to only a few attempts on this setup per stock?
Capping attempts at a small handful per name forces a step back to reassess whether the read on the stock is actually correct, rather than mechanically repeating the same trade on the same name out of frustration or sunk-cost thinking.
Key Takeaway: A defined attempt limit is a discipline tool, not an admission that the setup doesn't work.
Is there a long-side version of this pattern?
The entry, stop, and invalidation structure translate directly; only the direction of the trade and the level being watched change.
Key Takeaway: The daily open-close classification framework works in both directions — this guide focuses on the short side because it's the more classically taught version.
Why is overnight gap risk a bigger concern here than in other setups on this hub?
A low-float runner with active retail attention can gap significantly on overnight news, a halt resumption, or simply renewed buying interest with no news at all, and that gap happens before any stop-loss order can execute at the intended level.
Key Takeaway: Size positions with the possibility of a gap against the trade in mind, not just the intraday range.
Does this pattern only work because these stocks are being manipulated?
FINRA has documented that low-float stocks with sudden retail attention are frequent targets of coordinated promotion, which likely amplifies how sharply some of these runners fall once the buying stops. That's a contributing factor, not the sole explanation — plenty of qualifying runs have no promotional element at all and still produce a tradable first red day.
Key Takeaway: Promotion can make the pattern sharper in specific names, but the underlying mechanic works on ordinary momentum exhaustion too.
Disclaimer
Article Sources
- Jegadeesh & Titman (1993), "Returns to Buying Winners and Selling Losers: Implications for Stock Market Efficiency", The Journal of Finance - the foundational momentum study, explicit that the effect operates over 3-to-12-month horizons rather than short-term onesonlinelibrary.wiley.com
- Avramov, Chordia & Goyal (2006), "Liquidity and Autocorrelations in Individual Stock Returns", The Journal of Finance - documents that short-run return reversals concentrate in high-turnover, low-liquidity stocksonlinelibrary.wiley.com
- Diether, Lee & Werner (2009), "Short-Sale Strategies and Return Predictability", Review of Financial Studies - empirical evidence that short sellers trading into recent strength correctly anticipate weaker returns aheadacademic.oup.com
- FINRA, "Avoiding Pump-and-Dump Scams" - regulatory guidance on the float-control and promotional tactics common in the low-float stocks this pattern targetsfinra.org