Most traders eyeball a VolumeVolume is the total number of shares (or contracts) traded during a given time period — it's the primary confirmation tool for all price action, because a price move accompanied by high volume indicates genuine market participation, while tRead definition → bar and call it "huge" the same way they'd call a stock "cheap" — based on a feeling, not a number. A candle that looks enormous on one stock's chart is completely unremarkable on another, and the same stock's own idea of "unusual" volume changes by time of day and by how jumpy it's been lately. Trading volume spikes without accounting for any of that is how traders end up reacting to noise. This guide covers the statistical version of the signal: a specific, quantifiable threshold for what counts as a genuine volume spike, paired with the price behavior that turns it into a tradable bottom.
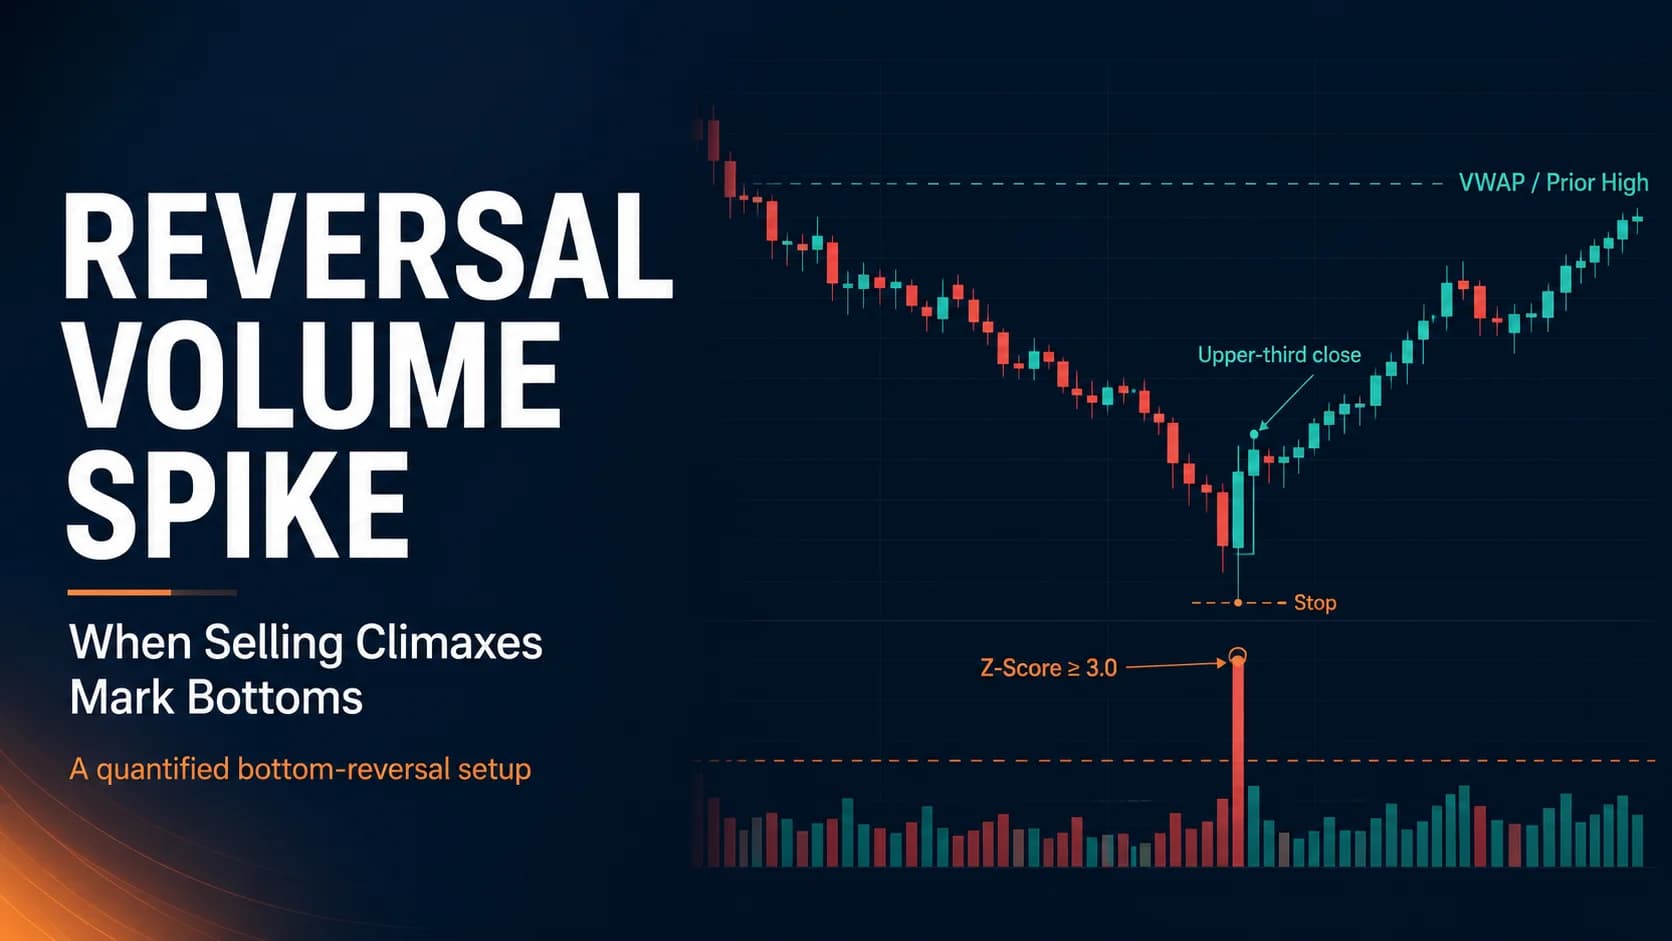
What is the reversal volume spike strategy? The reversal volume spike strategy involves buying a stock at the exact candle where selling volume becomes a statistical outlier relative to that stock's own recent history, provided the same candle also closes back in the upper portion of its RangeA range (or trading range) is a price zone where a stock oscillates between a defined support floor and resistance ceiling without making meaningful new highs or lows — price is consolidating rather than trending, and the dominant trade is Read definition →. It's a narrower, more quantifiable cousin of capitulation buying — built around a measurable number rather than a narrative about panic.
Why a Volume Spike Reversal Isn't the Same Trade as Full Capitulation
A full capitulation event — the multi-session, accelerating, forced-selling kind of decline this hub covers elsewhere in its bottom-buying playbooks — is dramatic, rare, and usually easy to recognize after the fact. A reversal volume spike is a lower-drama, higher-frequency cousin of the same underlying idea: it doesn't require a preceding accelerating decline, doesn't require MarginMargin is money borrowed from your broker, secured by the cash and securities in your account, that lets you hold a larger position than your own cash would allow. For example, with the standard 50% initial margin, $10,000 of equity can buyRead definition → calls or fund redemptions in the background, and can appear on a single ordinary session inside an otherwise unremarkable trading range.
That difference matters for how often each setup actually shows up. Genuine capitulation is rare enough that a trader might see it in a handful of individual names a week and across the whole market only a few times a year. A statistically significant volume spike at a swing low, by contrast, happens constantly — in dozens of stocks on any given session — which is exactly why this version needs a harder, more mechanical filter than "that candle looks big." Eyeballing volume doesn't scale across that many candidates; a number does.
It's also a different trade than the short-side mirror of this pattern — a volume spike marking exhaustion at the top of an advance rather than the bottom of a decline. The statistical method described here applies to both directions in principle, but this guide stays focused on the long side: selling climaxes that mark bottoms.
What Actually Counts as a Statistically Significant Volume Spike
Readers who need a refresher on reading volume and buying/selling pressure should start there before this section. Relative VolumeRelative volume (RVOL) compares a stock's current trading volume to its average volume for the same time of day, expressed as a multiple — a stock with 5x RVOL is trading five times more actively than normal, signaling unusual interest and Read definition → — comparing today's volume to a stock's typical volume — is the tool most traders reach for first, and it's a reasonable starting filter. But RVOL treats every stock's volume history as if it were equally consistent, and it isn't. A stock whose volume barely varies day to day only needs a modest increase to be genuinely unusual; a stock whose volume already swings wildly needs a much bigger jump before it means anything at all. Two stocks can both show "3x average volume" on a given candle, with one representing a true statistical outlier and the other representing an ordinary Tuesday.
A Z-score fixes that blind spot. The calculation is simple: take the candle's volume, subtract the rolling average volume over a chosen lookback period, and divide by the standard deviation of volume over that same period. A Z-score of 3.0 or higher means the candle's volume sits three standard deviations above what's typical for that specific stock — a genuine, rare outlier, normalized to that stock's own behavior rather than judged against a flat multiplier that treats every name the same way.
Academic research on the price-volume relationship supports building a signal this way. Karpoff's foundational survey established that volume is systematically tied to the magnitude of price changes, and Admati and Pfleiderer's theoretical work on intraday trading patterns explains why that relationship isn't uniform throughout the day — informed and LiquidityLiquidity in trading refers to how easily you can enter and exit a position at a fair price — a liquid stock has high volume and a tight bid-ask spread, allowing large orders to be filled quickly without moving the price, while an illiquid Read definition → traders concentrate their activity at specific points in the session, which means a raw volume number needs context to mean anything.
That context has to include time of day specifically. Wood, McInish, and Ord's research on NYSE transaction data documented that returns and volume both behave differently in the first 30 minutes after the open, at the close, and during the rest of the session — the classic U-shaped intraday pattern, where activity is naturally elevated near the open and close and thinner in between. A Z-score calculated against a single flat daily baseline will flag the open and close constantly and miss real anomalies at midday. The baseline needs to be built from the same time-of-day window being evaluated, not the whole session lumped together.
The Setup Specification: Eight Rules for Trading the Spike
Every component below is a hard rule, not a suggestion, because the entire premise of this version of the strategy is replacing a feeling with a number.
- Component
- Market Conditions Required
- Rule
- None specific to the broader trend — this signal can appear inside a range, a routine pullback, or a multi-session decline alike; the qualifying condition is the statistical anomaly itself.
- Component
- Time of Day
- Rule
- Calculate the volume Z-score against a baseline built from the same time-of-day window, not a flat daily average, to avoid false flags during the naturally heavier open and close.
- Component
- Stock Selection Criteria
- Rule
- Volume Z-score of 3.0 or higher on the candle in question, relative to a rolling 20-period baseline; price at or near a meaningful recent swing low.
- Component
- Entry Trigger
- Rule
- The spike candle itself must close in the upper third of its own range — a same-candle reversal shape — while its Z-score clears the 3.0 threshold; enter at or near that close.
- Component
- Stop Loss
- Rule
- Below the low of the spike candle.
- Component
- Initial Profit Target + Scaling
- Rule
- First scale-out at the session VWAP or the nearest prior swing high, whichever is closer; sell a third to half the position there.
- Component
- Trade Management
- Rule
- Trail the stop up as higher lows form; never add to the position on a fresh low against it.
- Component
- Invalidation Criteria
- Rule
- A new low below the spike candle's low invalidates the setup immediately.
| Component | Rule |
|---|---|
| Market Conditions Required | None specific to the broader trend — this signal can appear inside a range, a routine pullback, or a multi-session decline alike; the qualifying condition is the statistical anomaly itself. |
| Time of Day | Calculate the volume Z-score against a baseline built from the same time-of-day window, not a flat daily average, to avoid false flags during the naturally heavier open and close. |
| Stock Selection Criteria | Volume Z-score of 3.0 or higher on the candle in question, relative to a rolling 20-period baseline; price at or near a meaningful recent swing low. |
| Entry Trigger | The spike candle itself must close in the upper third of its own range — a same-candle reversal shape — while its Z-score clears the 3.0 threshold; enter at or near that close. |
| Stop Loss | Below the low of the spike candle. |
| Initial Profit Target + Scaling | First scale-out at the session VWAP or the nearest prior swing high, whichever is closer; sell a third to half the position there. |
| Trade Management | Trail the stop up as higher lows form; never add to the position on a fresh low against it. |
| Invalidation Criteria | A new low below the spike candle's low invalidates the setup immediately. |
The entry trigger deserves the most explanation, because it's the piece that separates this version from a slower, more conservative capitulation entry that waits for an entirely separate confirming candle. Here, both conditions — the statistical volume outlier and the reversal shape — have to show up on the same candle. That's a real tradeoff: it means acting faster, sometimes within seconds of a candle closing, in exchange for accepting a higher rate of false signals than a two-candle confirmation would produce. The stop below the spike candle's low is what keeps that tradeoff honest.
The stop-loss and target rules stay anchored to the specific candle and nearby price structure rather than a fixed percentage, for the same reason they do throughout this hub's reversal playbooks: a statistically unusual candle doesn't respect round-number stops, but it does respect the actual low it just printed.
A Minute-by-Minute Walk-Through: Trading the Spike in a Hypothetical Range
Consider a hypothetical mid-cap consumer stock, ticker DEF, that's spent six weeks trading in an unremarkable range between $60 and $65. None of the prices or events below are real; they're constructed to show the mechanics in action.
There's no accelerating decline here — DEF isn't in crisis. A minor same-store-sales data point disappoints expectations, nothing severe enough to be called a crisis, and the stock gaps down modestly to $58.50 at the open. It drifts lower through the first 40 minutes on ordinary volume, nothing statistically unusual yet.
At 10:20 AM ET, a single 5-minute candle opens at $56.80, probes down to $55.00, and closes at $57.90 — back in the upper third of its own $2.90 range. That candle prints roughly 640,000 shares against a rolling 20-period baseline average of 110,000 shares and a standard deviation of roughly 90,000 — a Z-score of about 5.9, well past the 3.0 threshold, calculated against the correct time-of-day baseline rather than a flat daily average. Both conditions are met on the same bar: a genuine statistical outlier, closing strong.
A long position is initiated at or near that $57.90 close, with a stop placed below the spike candle's low at $55.00 (with a small buffer, say $54.80). By 11:10 AM, VWAP has caught up to roughly $59.40, and a third to half the position sells there. DEF continues recovering through midday, eventually reclaiming $60 and drifting back toward the $63 area — the nearest prior swing high inside its recent range. The remainder of the position targets that zone, with the stop trailed up behind each new higher low.
Notice what this trade didn't need: a multi-week decline, a crisis narrative, or forced sellers dumping shares to meet a margin call. It needed one statistically abnormal candle that closed strong, in an otherwise ordinary stock having an ordinary bad morning.
Managing the Position Once the Spike Confirms
Once the position is on, resist the urge to take profit at the first sign of strength just because the entry felt uncertain going in. If the reversal is genuine, price keeps building on the spike candle's low rather than immediately giving it back — let the position work toward the first scale-out level before deciding whether to trim.
Trail the stop up behind new higher lows as they form, the same discipline this hub applies across every reversal setup. The one habit to avoid without exception: adding to the position if price makes a fresh low below the spike candle. A single statistical outlier is evidence, not proof, and treating a failed signal as a reason to average down turns a small, well-defined loss into an open-ended one.
Where This Setup Fails: False Spikes and Outcome Bias
The most common way this strategy produces a losing trade is a data artifact masquerading as a genuine signal. Late prints, corrected trades, and block trades reported after the fact can all generate an isolated tall volume bar that doesn't reflect real intrabar buying and selling — the number looks like an outlier because of how or when it was reported, not because of genuine participation. Checking that a spike shows up consistently across the data feed being used, rather than trusting a single anomalous print, is part of running this setup correctly.
There's a second, quieter failure mode worth naming honestly: outcome bias. It's easy to notice the volume spikes that preceded a strong bounce and forget about the much larger number of statistically identical spikes that simply marked temporary absorption before the decline continued. A Z-score above 3.0 describes an unusual amount of volume — it does not, by itself, describe which direction that unusual volume is about to resolve. The same-candle reversal shape requirement exists specifically to filter for the outcome this strategy wants, but it's a filter, not a guarantee, and a percentage of statistically valid signals will still fail.
Because of both of these, position sizing should assume a real, non-trivial failure rate rather than treating a clean Z-score reading as high-confidence proof. The stop below the spike candle's low is doing real work here, not just serving as a formality.
Thin liquidity creates a third, more subtle problem: the statistic itself gets unreliable before the trade does. A Z-score depends on a stable rolling average and standard deviation, and a stock that only trades a few thousand shares in a typical period doesn't have enough volume history to make either number meaningful — one unusually large or small session can swing the baseline itself, producing a Z-score that looks extreme mostly because the sample behind it is too thin to calculate a trustworthy average from. This setup works best on names with enough regular volume that the rolling baseline reflects genuine typical behavior, not a handful of noisy data points.
Adapting the Setup Across Timeframes and Baselines
The core statistical method holds across timeframes, but the lookback period needs to scale with the timeframe being traded. A 20-period baseline on a 5-minute chart captures roughly the trailing hour and a half of activity; the same 20-period baseline on a daily chart captures a month. Shorter lookbacks react faster to genuine regime changes but produce noisier, more frequent false signals; longer lookbacks are more stable but slower to reflect a stock that's recently become more or less volatile than its older history suggests.
This same statistical framework can be pointed at the mirror-image question — an abnormal volume spike marking exhaustion at the top of an advance instead of the bottom of a decline — using the same Z-score math with the reversal-shape condition flipped to a weak close instead of a strong one. This guide stays scoped to the bottom-buying version; the mechanics translate directly for anyone trading the top-side application covered in this hub's short-selling reversal content.
Some traders lower the Z-score threshold to 2.0 in exchange for more frequent signals and a higher false-positive rate, or raise it to 4.0 for rarer but more reliable candidates closer to genuine capitulation-grade events. Neither choice is correct in isolation — it's a direct tradeoff between signal frequency and signal quality that should match how much monitoring attention is actually available during the session.
Because every condition here reduces to a number — a Z-score threshold and a same-candle close location — this version of the setup lends itself to systematic testing in a way a discretionary read of "does this look like capitulation" doesn't. Traders comfortable with backtesting a defined rule set can run this exact specification against historical data and see, for a specific stock or watchlist, how often a given threshold actually produced a bounce that reached the first scale-out level versus how often it failed. That's a meaningfully different kind of validation than reviewing a handful of remembered capitulation trades.
Scanning for Statistical Volume Anomalies in Real Time
Manually calculating a rolling Z-score across a watchlist of any real size isn't practical by hand, and it's exactly the kind of repetitive numerical filter a scanning platform is built to run continuously. A useful scan combines a volume-anomaly or relative-volume filter with a price-near-support condition, narrowing a broad market down to candidates worth checking for the same-candle reversal shape by eye.
Trade Ideas is built to run this kind of multi-condition scan as a comprehensive scanning and research platform, surfacing unusual volume activity alongside built-in charting to check the reversal shape on each candidate without switching tools. The scan still only narrows the list — confirming the same-candle statistical-and-shape combination described in the setup specification is still the actual trigger.
Sizing the Volume Spike Trade Inside a Broader Plan
Because this version of the setup shows up far more often than full capitulation, it's tempting to treat it as a bread-and-butter daily strategy rather than a selective tool. Resist that — a high signal count is exactly the situation where trading discipline separates traders who stay selective from traders who take every marginal setup just because it's available. A high signal frequency combined with a real false-positive rate, from both data artifacts and ordinary statistical noise, means position size should stay modest and consistent rather than scaling up just because candidates are common.
Sizing every trade as a defined risk in R-multiples, anchored to the distance between entry and the spike candle's low, keeps the higher frequency of this setup from turning into higher aggregate risk. This strategy belongs on the Strategies Hub as a quantifiable complement to the hub's more narrative-driven reversal setups — useful precisely because it replaces a feeling about volume with a number, not because the number is infallible.
Common Questions About Trading Reversal Volume Spikes
How is this different from waiting for a full capitulation bottom?
That difference shows up in how often each setup appears. Capitulation is dramatic and rare; a qualifying volume spike shows up constantly across a broad watchlist, which is exactly why this version leans on a hard statistical threshold instead of a narrative about panic and forced sellers.
Key Takeaway: Use this setup for the frequent, lower-drama version of the signal, and reserve the full capitulation framework for genuine multi-session panic events.
Why use a Z-score instead of a simpler relative volume multiple?
Two stocks can both show the same raw multiple of average volume on a given candle and mean completely different things — one because that stock's volume barely moves day to day, the other because that stock is always volatile and a big number is unremarkable for it specifically. The Z-score normalizes for that difference.
Key Takeaway: A Z-score answers "is this unusual for this stock," not just "is this a big number," which is the more useful question for filtering real anomalies.
What causes a volume spike signal to be false?
Checking that a spike shows up consistently in the data feed being used, rather than trusting a single anomalous print in isolation, is a real part of executing this setup correctly. A spike that only appears in one data source and not another is a signal to skip the trade, not force it.
Key Takeaway: Treat an isolated, unconfirmed volume print with more suspicion than one that shows up consistently across the tape.
Does a statistically significant volume spike guarantee the direction of the reversal?
It's easy to remember the volume spikes that preceded a strong bounce and forget the larger number of statistically identical spikes that simply marked temporary absorption before a decline continued. That selective memory is a real bias worth guarding against when reviewing past trades.
Key Takeaway: The Z-score and the reversal shape are both required conditions, and neither one alone is sufficient evidence to enter.
Can this setup mark a top instead of a bottom?
This guide stays scoped to the bottom-buying version of the signal, since the mechanics and risk considerations for shorting an exhausted top deserve their own dedicated treatment rather than a brief mention here.
Key Takeaway: The Z-score math is direction-agnostic; only the shape condition and the trade direction change between the two versions.
What lookback period should the rolling average and standard deviation use?
A shorter lookback reacts faster to a stock that's recently become more active but produces noisier, more frequent signals; a longer lookback is more statistically stable but slower to reflect a genuine recent shift in how that stock trades. There's no single correct number — it's a tradeoff between responsiveness and stability that should match the timeframe in use.
Key Takeaway: Match the lookback length to the timeframe being traded, and expect to adjust it if a stock's typical volume behavior changes meaningfully.
What scan filters would actually surface these candidates?
Running this kind of scan continuously catches candidates far faster than manually calculating a rolling Z-score across a watchlist by hand, especially across a broad market on an active session. The scan narrows the list; the same-candle statistical-and-shape combination still governs the actual entry.
Key Takeaway: A scanner replaces the manual math, not the judgment call on whether the reversal shape is genuinely there.
Does the reversal candle need to be a specific pattern, like a hammer?
Requiring a strict named pattern on top of the statistical threshold would filter out valid signals that don't happen to form a textbook shape. The upper-third close is a simpler, more inclusive version of the same underlying idea: buyers stepped in and pushed price back up before the candle finished printing.
Key Takeaway: Focus on where the candle closes within its own range, not on matching a specific named candlestick shape.
Does this setup work on thinly-traded or illiquid stocks?
The math behind a Z-score assumes the baseline it's measured against is itself reasonably stable. A name that trades only a few thousand shares on a typical day doesn't have enough history for that baseline to mean much, and a single unusual session can distort the average and standard deviation being used to judge the very next candle. This setup is best reserved for stocks with enough regular volume that the rolling baseline reflects real typical behavior.
Key Takeaway: Check that a stock has a reasonably stable volume history before trusting a Z-score calculated from it.
Can this approach be backtested more rigorously than a discretionary capitulation read?
Running the exact specification — a chosen Z-score threshold and a same-candle upper-third close — against a stock's history shows concretely how often that combination actually preceded a move to the first scale-out level, versus how often it failed, rather than relying on a handful of remembered examples.
Key Takeaway: The more a setup can be reduced to explicit numbers, the more honestly it can be tested before real capital is put behind it.
Disclaimer
Article Sources
- Karpoff (1987), "The Relation Between Price Changes and Trading Volume: A Survey", Journal of Financial and Quantitative Analysis - the foundational survey establishing that volume is systematically tied to the magnitude of price changescambridge.org
- Admati & Pfleiderer (1988), "A Theory of Intraday Patterns: Volume and Price Variability", The Review of Financial Studies - explains why volume concentrates at specific points in the session rather than distributing evenlyacademic.oup.com
- Wood, McInish & Ord (1985), "An Investigation of Transactions Data for NYSE Stocks", The Journal of Finance - documents the U-shaped intraday pattern behind why a volume baseline must account for time of dayonlinelibrary.wiley.com
- Jain & Joh (1988), "The Dependence between Hourly Prices and Trading Volume", Journal of Financial and Quantitative Analysis - further empirical evidence on the hourly structure of the price-volume relationshipdoi.org