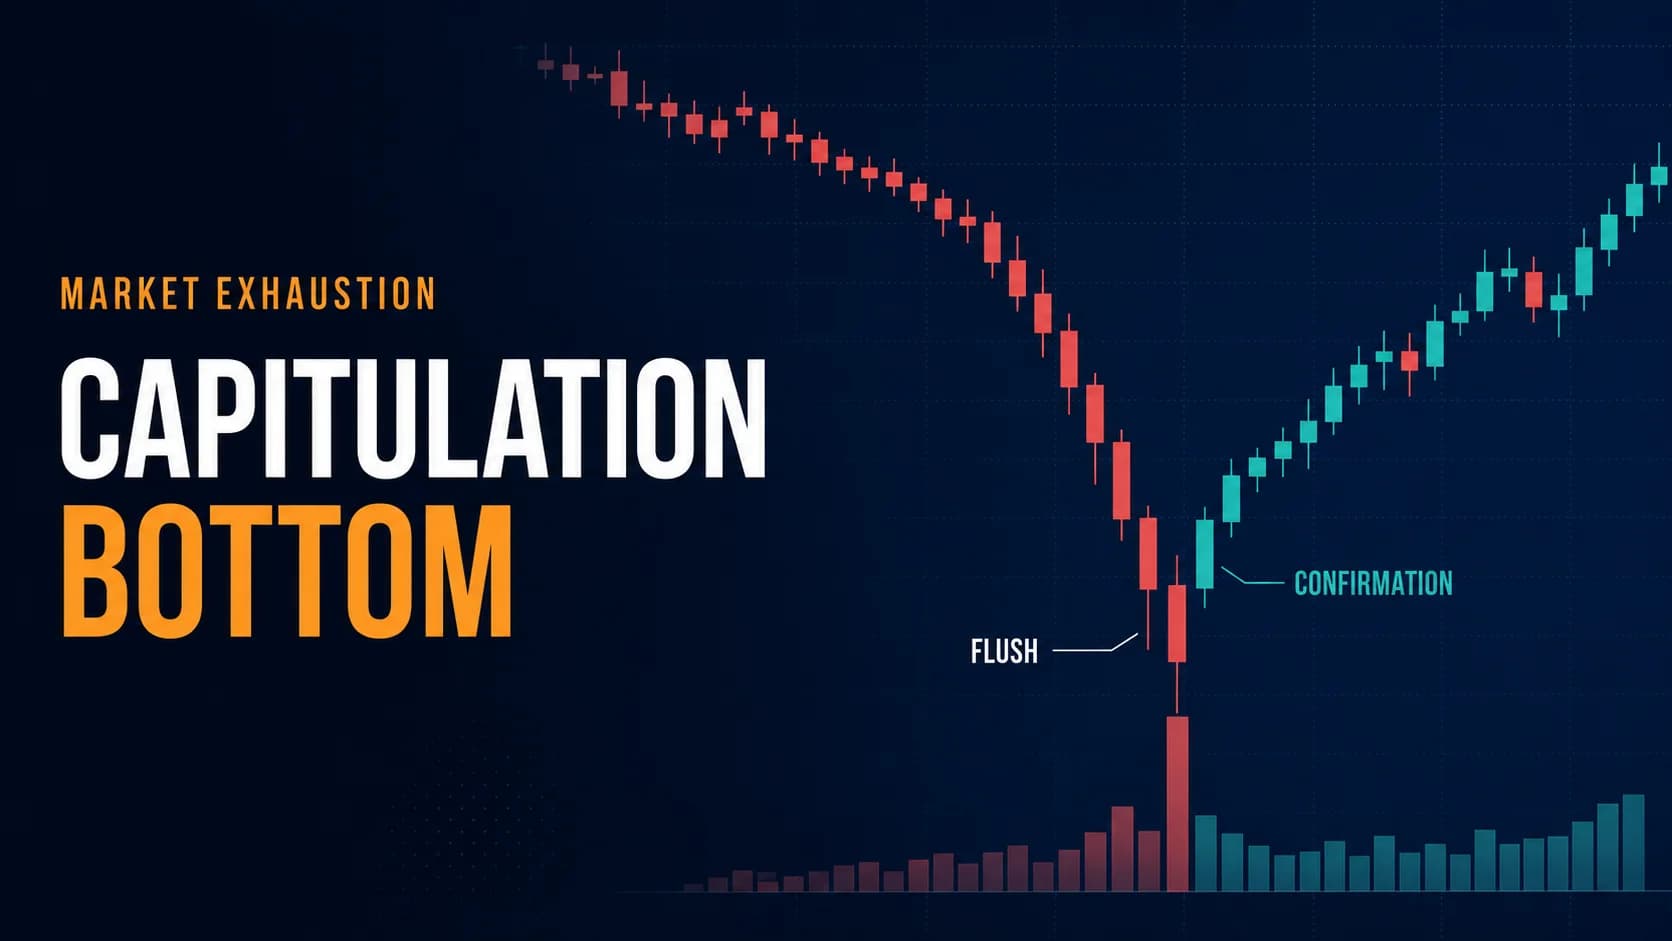
A stock down 40% in three weeks, gapping lower again on no new news, looks like the last thing anyone should buy. But the single highest-VolumeVolume is the total number of shares (or contracts) traded during a given time period — it's the primary confirmation tool for all price action, because a price move accompanied by high volume indicates genuine market participation, while tRead definition → candle of that entire decline usually prints right at the bottom — the exact bar where the last forced seller finally runs out of shares to dump. Learning to recognize that bar, and waiting for the next one to confirm it, is what separates buying a genuine capitulation bottom from catching a falling knife on the way to a Lower LowA lower low is when price makes a swing low that is below the previous swing low, confirming a downtrend in market structure — the mirror image of a higher low, and one of the two components (with lower highs) that defines a bearish trend.Read definition →.
What is a capitulation bottom strategy? A capitulation bottom strategy involves buying a stock after it completes a panic-driven, accelerating decline — entering only once volume, price action, and a specific technical trigger confirm that forced and fearful selling has been exhausted, rather than guessing at the bottom in real time. It targets the single session, sometimes the single hour, where a sell-off finally breaks.
Why Buying Capitulation Isn't the Same Trade as Buying a Dip
Every long entry after a decline gets called "buying the dip" by somebody, but a capitulation buy and a routine dip-buy are solving completely different problems. The hub's pullback trading strategy buys a shallow PullbackA pullback is a temporary counter-trend price movement within an established trend — in an uptrend, a pullback is a short-term decline that offers a lower-risk entry point before the trend resumes, as opposed to a reversal which signals theRead definition → inside an established uptrend — the TrendA trend is a sustained directional movement in price over time — an uptrend is characterized by a sequence of higher highs and higher lows, a downtrend by lower highs and lower lows — and correctly identifying the current trend direction isRead definition → is still intact, and the pullback is a pause, not a crisis. A capitulation buy has none of that SupportSupport is a price level where buying pressure has historically overcome selling pressure, causing price to stop declining and reverse — it's the floor where demand enters the market, and when it holds, it's a potential long entry; when it Read definition →. It buys into a stock that's actively falling apart, often on real bad news, with no established uptrend anywhere nearby to lean on.
That difference changes the entire risk calculation. A pullback that fails usually just chops sideways for a while. A capitulation buy that fails can mean the stock keeps falling and takes out a new low within the hour, because the forced selling that created the decline hasn't finished just because a trader decided it should be over. This guide is a specific application of the broader question this hub's reversal trading playbook asks — how many pieces of evidence need to align before a turn is real — narrowed down to the single most violent version of a bottom: the one built entirely on exhausted panic rather than a technical level holding.
It's also not the same trade as guessing that "it's fallen enough" or averaging into a losing position hoping for a bounce. Those habits get traders into far more trouble than they get them out of. This strategy has a narrower job: catching the specific moment an accelerating, volume-climaxing decline exhausts itself, with rules mechanical enough that nobody has to rely on a gut feeling about when the selling is finally done.
The Conditions That Separate Real Capitulation From an Ordinary Sell-Off
Most down days aren't capitulation. A stock can drop 5%, even 10%, on unremarkable volume and just be having a normal bad day inside a normal downtrend — that's not exhaustion, that's just weakness continuing. Treating every red day as a buying opportunity is how traders turn one bad position into three.
Genuine capitulation needs the same specific signature this hub's parabolic reversal strategy looks for on the way up, mirrored on the way down: acceleration, not just decline. Each session's drop larger than the last, each brief bounce weaker and shorter than the one before it, the angle steepening toward vertical rather than holding a steady slope. Relative volume needs to run well above normal on the terminal down day — commonly in the 5x-to-10x range, sometimes higher when the decline is driven by forced selling rather than ordinary profit-taking.
"Genuine capitulation needs the same specific signature this hub's parabolic reversal strategy looks for on the way up, mirrored on the way down: acceleration, not just decline."
"Forced selling" is the key phrase, and it's worth being specific about what causes it: margin calls that force a broker to liquidate a position regardless of price, fund redemptions that force a manager to raise cash into weakness, and stop-loss orders cascading on top of each other as each triggered stop pushes price low enough to trigger the next one. None of these sellers are making a considered decision about value — they're selling because they have to, at whatever price is available, and that's precisely what produces the volume climax this setup is built to catch.
Broader market context matters more here than it does for a single-stock momentum top. A stock capitulating during a broad market sell-off, when the VIX is spiking to extreme levels, is behaving very differently than a stock capitulating in isolation on company-specific bad news — both can produce a genuine bottom, but the broad-market version tends to resolve faster once the wider panic subsides. Readers trading in genuinely stressed, high-VIX conditions should also see this hub's dedicated high-VIX trading strategy for the regime-level playbook; this guide stays focused on the specific bottom-buying signature itself.
Time of day works the same way it does for exhaustion tops: signals confirming in the first 90 minutes after the open or in the final hour tend to carry more weight than ones forming in the thin, low-conviction window between roughly noon and 1:30 PM ET.
The Setup Specification: Eight Rules for Timing the Buy
Every component below is a hard rule, not a suggestion. The goal is a mechanical answer to "has the selling actually stopped," not a feeling about it.
- Component
- Market Conditions Required
- Rule
- Price has declined sharply from a recent level in a compressed window (typically one to five sessions), with each session's drop larger than the last — an accelerating decline, not just weakness.
- Component
- Time of Day
- Rule
- Works at any point in the session; signals in the first 90 minutes or the final hour carry more weight than ones forming between 12:00 and 1:30 PM ET.
- Component
- Stock Selection Criteria
- Rule
- RVOL of 5x or higher on the terminal down day; price has moved several multiples of its own average true range within the recent decline; broad market stress (elevated VIX) amplifies but is not required.
- Component
- Entry Trigger
- Rule
- Let the single highest-volume candle of the decline (the flush candle) complete, then buy on the first following candle that makes a higher low than the flush candle and closes back above the flush candle's open, on continued elevated volume.
- Component
- Stop Loss
- Rule
- Below the low of the flush candle, or below the confirming candle's low if it undercuts the flush candle — whichever level is lower.
- Component
- Initial Profit Target + Scaling
- Rule
- First scale-out at the session VWAP or the level where the decline first accelerated away from its prior base, whichever is closer; sell a third to half the position there.
- Component
- Trade Management
- Rule
- Add exposure only on strength, never on a fresh low against the position; trail the stop up as higher lows form; treat any new low below the flush candle as a reason to exit, not a reason to average down.
- Component
- Invalidation Criteria
- Rule
- A new low below the confirming candle's low, or a strong-volume breakdown below the flush candle's low, invalidates the setup immediately.
| Component | Rule |
|---|---|
| Market Conditions Required | Price has declined sharply from a recent level in a compressed window (typically one to five sessions), with each session's drop larger than the last — an accelerating decline, not just weakness. |
| Time of Day | Works at any point in the session; signals in the first 90 minutes or the final hour carry more weight than ones forming between 12:00 and 1:30 PM ET. |
| Stock Selection Criteria | RVOL of 5x or higher on the terminal down day; price has moved several multiples of its own average true range within the recent decline; broad market stress (elevated VIX) amplifies but is not required. |
| Entry Trigger | Let the single highest-volume candle of the decline (the flush candle) complete, then buy on the first following candle that makes a higher low than the flush candle and closes back above the flush candle's open, on continued elevated volume. |
| Stop Loss | Below the low of the flush candle, or below the confirming candle's low if it undercuts the flush candle — whichever level is lower. |
| Initial Profit Target + Scaling | First scale-out at the session VWAP or the level where the decline first accelerated away from its prior base, whichever is closer; sell a third to half the position there. |
| Trade Management | Add exposure only on strength, never on a fresh low against the position; trail the stop up as higher lows form; treat any new low below the flush candle as a reason to exit, not a reason to average down. |
| Invalidation Criteria | A new low below the confirming candle's low, or a strong-volume breakdown below the flush candle's low, invalidates the setup immediately. |
A few of these deserve more detail. The entry trigger requires two specific candles, not one. The flush candle is identifiable only once a few bars have passed and it's clear nothing since has matched its volume; the confirming candle has to actually make a higher low and reclaim the flush candle's open, not just stop falling. Buying into the flush candle itself, before that confirmation exists, is how traders end up long a stock that immediately makes a new low.
The stop-loss rule stays anchored to price structure rather than a flat percentage, for the same reason it does in the mirror-image short setup: a capitulating stock doesn't respect neat percentage stops, but it does respect the actual low that was just set. Profit targets stay conservative on purpose — the VWAP or breakaway level is usually reached quickly if the bounce is real, and locking in a meaningful portion there protects the trade before finding out whether the bounce has more room or fails early.
A Minute-by-Minute Walk-Through: Buying the Flush in a Hypothetical Decline
Consider a hypothetical mid-cap industrial stock, ticker ABC, following a guidance cut and an analyst downgrade. None of the prices or events below are real; they're constructed to show the mechanics in action.
ABC has fallen from $80 to $52 over three weeks as the bad news settles in — a real decline, but an orderly one so far, without the acceleration this setup requires. On the fourth Monday, ABC gaps down to $48 at the open and keeps sliding through the first half hour on heavy selling. By 10:10 AM ET, relative volume is running near 8x the 20-day average, and price is in free fall.
Between 10:10 and 10:15, a single 5-minute candle prints roughly 1.8 million shares — more than eight times the size of the 5-minute bars from earlier that morning. That candle opens near $44.00, plunges to a low of $41.50, and claws back to close at $43.80. This is the flush candle: the point where forced sellers, whoever they are, finally run out of shares to dump.
The next 5-minute candle, from 10:15 to 10:20, prints a higher low at $42.90 and closes at $45.20 — back above the flush candle's $44.00 open — on continued heavy volume near 1.1 million shares. That close is the entry trigger. A long position is initiated around $45.10 to $45.20, with a stop placed below the flush candle's low at $41.50 (with a small buffer, say $41.20), since that level sits below the confirming candle's own low.
By 11:00 AM, VWAP for the session has caught up to roughly $47.80. A third to half the position sells there. ABC continues stabilizing through midday, eventually reclaiming the $48 gap-down level and, later in the session, working back toward $52 — the level from which the decline first accelerated. The remainder of the position targets that zone, with the stop trailed up behind each new higher low along the way.
Notice what the trade did not require: buying the exact tick of the bottom. The entry came at $45.20, roughly $3.70 above the actual low of $41.50. That gap between the low and the entry isn't a flaw — it's the cost of waiting for confirmation instead of guessing, and on a trade this violent, it's a cost worth paying every time.
Managing the Position Once the Bounce Confirms
Once the position is on, the job shifts from analysis to discipline. Let winners work rather than taking the first sign of strength as a full exit signal — if the thesis is right, the stock keeps recovering ground, and there's no requirement to sell everything the moment it stops falling.
Trail the stop up as new higher lows form on the way up, rather than leaving it fixed at the original level indefinitely. This protects gains as the bounce develops and forces an exit automatically if the stock starts printing lower highs instead of higher ones — often the earliest sign that the bounce is failing.
The one rule that matters more than any other here: never add to the position on a fresh low against it. A pullback after a capitulation bounce can be healthy digestion — or it can be the start of a second wave of forced selling that erases the entire trade. Averaging down into that uncertainty, hoping the original read was right, is how a well-executed setup turns into an account-level problem.
The Second Flush: Why One Capitulation Doesn't Always Mark the Bottom
If there's one way this trade goes wrong more often than any other, it's assuming the first capitulation event is the last one. In an extended decline, especially a broad market sell-off, forced selling can arrive in waves rather than all at once — and each wave can look, in the moment, exactly like the exhaustion signature this setup is built to catch.
The most honest illustration of this is the 2008 financial crisis. On October 10, 2008, the S&P 500 opened at 902, traded down to 839, and reversed to close at 899, with the VIX spiking to a then-record 76 and SPY volume running close to four times its average — a textbook volume climax by every measure in the setup specification above. It was a real capitulation event. It was not the bottom. The index's final low didn't arrive until March 2009, nearly five months and several more waves of forced selling later.
Compare that to March 23, 2020, when the VIX hit an all-time closing high near 83 and SPY printed a wide-range reversal day on volume well over 350 million shares. That session was both a genuine capitulation event and the actual bottom — the S&P 500 rallied roughly 70% over the following twelve months. Both events showed the same signature. Only one of them was the last flush.
There's no reliable way to know in the moment which version is unfolding, which is exactly why this strategy treats every capitulation buy as a defined-risk trade with a hard stop below the flush candle, not a conviction call that the bottom is permanently in. The setup rules exist to catch the bounce when it comes, not to predict whether it's the final one.
Adapting the Setup Across Single Stocks, Indexes, and Instruments
The core mechanics hold whether the instrument is a single stock or a broad index, but the drivers differ in an important way. Single-stock capitulation is usually triggered by something specific to that company — a guidance cut, a failed drug trial, a lawsuit, an accounting concern — and the recovery, when it comes, tends to be gradual as the market re-underwrites the new information. Index-level capitulation (SPY, QQQ, and similar broad instruments) is more often driven by macro fear, and because it isn't tied to any single company's fundamentals being permanently impaired, the bounce that follows can be sharper and faster once the broader panic exhausts itself.
Both versions can be traded with calls instead of buying shares outright. A long call on a stock or ETF flushing out on heavy volume caps the maximum loss at the premium paid, which matters given how violent a failed capitulation buy can be if a second flush develops. The tradeoff is the same one that shows up in any options-based variation: premiums on the exact stocks and sessions where this setup appears are often elevated, since implied volatility spikes are part of what a capitulation event actually is.
Sentiment-only capitulation — a stock or index that's fallen hard purely on fear, without a specific new negative catalyst on the capitulation day itself — tends to produce cleaner, faster recoveries than capitulation tied to a genuine deterioration in the underlying business or economy. Knowing which kind is unfolding changes how much of the position, if any, should be held past the first scale-out target.
Scanning for Capitulation Before the Bounce Even Shows Up
Watching every falling stock hoping to catch the exact flush candle doesn't scale, particularly during a broad sell-off when dozens of names can be down double digits at once. A useful scan combines three conditions: a percentage-decliner filter for stocks down sharply over the past one to five sessions, a relative volume filter set well above the 5x threshold discussed earlier, and a filter for stocks trading meaningfully below their recent average true range extension to the downside.
Trade Ideas is built to run scans like this continuously through the session as a comprehensive scanning and research platform — surfacing decliners and volume outliers by percentage move and RVOL in real time, alongside built-in charting to review candidates without switching platforms. That narrows a chaotic, fast-moving list of falling stocks down to a short list worth watching closely for the flush-and-confirmation sequence. It doesn't replace waiting for that sequence to complete — a scanner finds candidates, it doesn't confirm that any single one has actually bottomed.
Sizing the Capitulation Buy Inside a Broader Trading Plan
This strategy is a specialist tool, reached for during genuine panic, not a daily setup to trade every time a stock has a red day. Real capitulation — the accelerating, volume-climaxing version described throughout this guide, not just "a stock that's fallen a lot" — shows up in a small number of names on any given week, and shows up across the whole market only a handful of times a year.
Position sizing deserves the same care here that it does on the short side of this pattern. Because stops are anchored to a recently printed low rather than a fixed percentage, the dollar risk per share can run wider than in most other setups on this hub, arguing for smaller share size relative to account equity rather than the size used for a standard breakout or pullback trade. Sizing every trade as a defined risk in R-multiples, rather than a fixed share count, keeps one second-flush loser from undoing a week of otherwise correct trades.
The psychological load here is real and worth naming directly. Buying into a stock that's actively falling apart, while headlines and social media sentiment are uniformly negative, asks for a different kind of discomfort tolerance than a trend-following trade ever does. Skip the work on managing fear and greed and the two likely failure modes are predictable: freezing and missing the confirmed entry entirely, or buying too early, before the flush candle has even completed, because the price already "looks cheap." This strategy belongs on the Strategies Hub as one tool among many, reached for when the specific signature described here actually shows up — not as a reflex response to any stock or index having a bad week.
Common Questions About Buying a Capitulation Bottom
How is capitulation buying different from a routine dip-buy in an uptrend?
That difference changes the entire risk calculation behind the trade. The hub's pullback trading strategy works because the broader trend supports the entry; a capitulation buy has no such support, which is why the entry rules here are stricter and the stop is placed at a structurally different point — below a panic low rather than below a routine pullback low.
Key Takeaway: Pullback trading and capitulation buying solve different problems — one buys a pause inside strength, the other calls the exact moment a decline runs out of sellers.
Is this the same thing as catching a falling knife?
The phrase exists as a warning because most attempts to buy a falling stock are exactly that: guesses, made because the price feels cheap, with no mechanical evidence that the selling has actually stopped. This setup is built to be the disciplined alternative — it accepts giving up the exact bottom tick in exchange for evidence that forced selling has genuinely exhausted itself before any capital goes to work.
Key Takeaway: The confirming candle is what separates this strategy from the exact behavior its critics are worried about.
Why does the volume on the flush candle matter more than how far the price has already fallen?
A stock can make a new low on unremarkable volume and simply still be in a normal downtrend; that's continuation, not exhaustion. The flush candle is different because a disproportionate number of shares change hands relative to the rest of the decline, consistent with Karpoff's research on the price-volume relationship: extreme price changes arrive with extreme volume, and on the way down, that volume signature is what reveals forced sellers finishing their liquidation rather than a routine down day continuing.
Key Takeaway: A new low on light volume is trend continuation; a new low on the heaviest volume of the entire decline is the signature this setup is built to catch.
What's the biggest reason a capitulation buy fails?
This is the setup's signature failure mode, and the 2008 financial crisis is the clearest illustration: the October 10 climax was a genuine capitulation event by every measure, but the market's actual low didn't arrive until nearly five months later. That's why this strategy treats every entry as a defined-risk trade with a hard stop below the flush candle, never as a conviction call that the absolute bottom is in.
Key Takeaway: A confirmed stop-out isn't proof the strategy failed — it's proof this was the first flush, not the last one, and the risk was contained accordingly.
Does this only work on individual stocks, or does it work on broad index sell-offs too?
Index-level capitulation also comes with a useful confirming signal that individual stocks don't offer on their own: the VIX. A broad sell-off accompanied by an extreme VIX spike, followed by a wide-range reversal day on heavy volume, is the same flush-and-confirmation signature described throughout this guide, just measured across the whole market rather than one name.
Key Takeaway: Use the same entry logic for both, but treat an elevated VIX as additional confirming context specifically for index-level trades, not a requirement for single-stock ones.
What VIX level or RVOL reading actually signals genuine capitulation versus an ordinary bad day?
Below that range, a sharp down day is often just normal volatility inside a stock or market that's still finding its footing — not the specific acceleration-and-volume-climax signature this strategy targets. The number is a filter for narrowing a watchlist to serious candidates, not a trigger to act on by itself.
Key Takeaway: Use RVOL and VIX context to build a short list of candidates, then wait for the flush-and-confirmation sequence before acting on any single name.
What scan filters would actually surface capitulation candidates in real time?
Running this kind of scan continuously through a volatile session finds candidates far faster than manually flipping between charts, especially when dozens of stocks are red at once. The scan still only does the finding; the flush-and-confirmation sequence covered earlier governs the actual entry.
Key Takeaway: A scanner narrows a chaotic sell-off down to a short list — it doesn't replace waiting for the confirming candle to actually print.
How is a genuine capitulation bounce different from a dead cat bounce?
The two look identical in their first few minutes, which is exactly why this strategy doesn't chase the initial bounce off the flush candle's low. The stop placed below the flush candle's low is the mechanism that tells the difference: if the bounce is a dead cat, price eventually breaks that level and the trade exits with contained risk; if it's genuine, the higher low holds and the position keeps working.
Key Takeaway: The stop below the flush candle isn't just risk management — it's the tool that distinguishes a real bottom from a dead cat bounce in progress.
Does capitulation require bad news, or can it happen without a specific catalyst?
Cascading stop-losses and margin calls don't need new information to trigger; they need price to hit a level that forces selling regardless of the reason it got there. A stock already in a multi-week decline on an earlier piece of bad news can capitulate on a day with no news at all, simply because forced sellers finally hit their trigger levels simultaneously.
Key Takeaway: Watch for the acceleration-and-volume-climax signature itself, not for a specific headline, since the catalyst is often already priced in by the time the actual flush prints.
Disclaimer
Article Sources
- De Bondt & Thaler (1985), "Does the Stock Market Overreact?", The Journal of Finance - found that market overreaction to dramatic price moves is asymmetric and more pronounced for losers than for winnersonlinelibrary.wiley.com
- Kahneman & Tversky (1979), "Prospect Theory: An Analysis of Decision under Risk", Econometrica - the foundational research on loss aversion that explains why forced, panic-driven selling accelerates exactly when losses are largesteconometricsociety.org
- Odean (1998), "Are Investors Reluctant to Realize Their Losses?", The Journal of Finance - documents investors' strong general reluctance to sell losing positions, which is what makes genuine capitulation selling a meaningful, rare signal rather than routine behavioronlinelibrary.wiley.com
- Karpoff (1987), "The Relation Between Price Changes and Trading Volume: A Survey", Journal of Financial and Quantitative Analysis - the empirical basis for reading a volume climax alongside price on the way down as well as the way upcambridge.org