It sounds backwards at first: a stock trading at its highest price in a year should, intuitively, feel like the worst time to buy. It's already expensive relative to its own recent history. And yet decades of research point in the opposite direction — stocks breaking to new 52-week highs have, on average, continued outperforming afterward, not reversed.
Every other pattern covered elsewhere in this hub — the VCP, the Bollinger Band Squeeze, the inside day — rests on the same underlying logic: contraction precedes expansion. The 52-week high BreakoutA breakout is when price moves decisively beyond a defined level — a resistance zone, a consolidation boundary, a chart pattern boundary, or a prior high — suggesting that the previous supply at that level has been overcome.Read definition → runs on a completely different mechanism, rooted in investor psychology rather than volatility cycles.
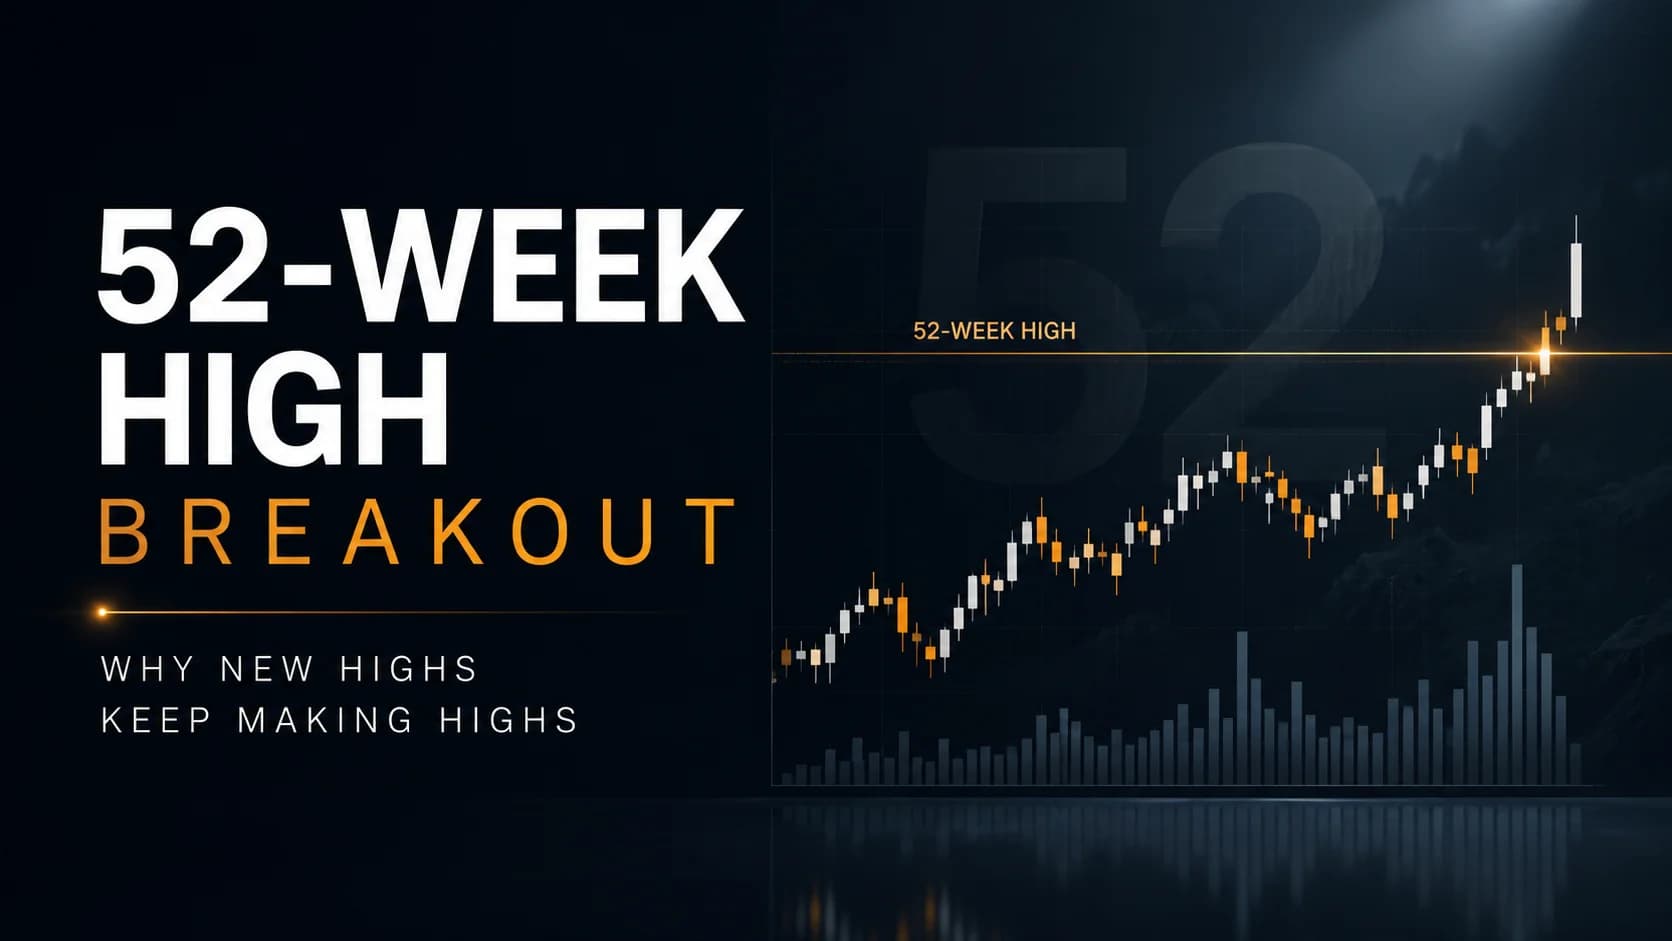
What is a 52-week high breakout? It's a strategy built around a stock closing above its highest price of the trailing 12 months. The pattern's significance comes from a well-documented behavioral tendency called anchoring — investors mentally fix on the 52-week high as a reference point and become reluctant to buy above it, even when new information justifies a higher price, which delays the market's full adjustment and creates the momentum this setup is designed to capture.
Why This Level Works: Anchoring, Not Volatility Compression
George and Hwang (2004), published in the Journal of Finance, found that a stock's nearness to its 52-week high was a stronger predictor of future returns than its own past returns or its industry's past returns — a striking result, since prior returns were the standard basis for momentum-investing research up to that point. Their explanation draws on the anchoring bias documented by psychologists Amos Tversky and Daniel Kahneman: investors use the 52-week high as a mental reference point, and even when genuinely positive news arrives, they're reluctant to BidThe bid is the highest price a buyer is currently willing to pay. When you sell with a market order, you receive the bid price.Read definition → a stock above that familiar ceiling right away. This causes prices to underreact to good news near the old high, and the resulting momentum shows up only once the price finally does clear it.
This is a fundamentally different explanation from the contraction-precedes-expansion logic behind the other patterns in this module. There's no requirement here that volatility has been compressing, no multi-stage base, no narrowing daily RangeA range (or trading range) is a price zone where a stock oscillates between a defined support floor and resistance ceiling without making meaningful new highs or lows — price is consolidating rather than trending, and the dominant trade is Read definition →. The entire signal is a single price level — the highest close of the past year — and the behavioral tendency of market participants around that specific number.
An Important Caveat About the Research's Time Horizon
Honesty matters here: George and Hwang's study measured returns over 6- to 12-month holding periods, ranking stocks monthly by their ratio of current price to 52-week high — a medium-term, portfolio-level academic methodology, not a day-trading study. Their finding that momentum profits from this signal don't reverse in the long run is genuinely significant for understanding why the level matters, but it isn't direct evidence about intraday price behavior on the specific day a stock crosses its 52-week high.
The honest takeaway: the academic research supports the idea that a 52-week high breakout reflects a real, slow-resolving underreaction rather than mere noise — which is useful context for a day trader deciding whether to treat the level seriously. It doesn't predict what happens in the first hour after the breakout candle closes, which is a separate, shorter-horizon question this guide's setup specification addresses using the same VolumeVolume is the total number of shares (or contracts) traded during a given time period — it's the primary confirmation tool for all price action, because a price move accompanied by high volume indicates genuine market participation, while tRead definition → and confirmation tools used elsewhere in this hub.
The 52-Week High Breakout: A Setup Specification
- Component
- Market Conditions Required
- Rule
- Stock closing at or breaking above its 52-week high; ideally showing relative strength against the broader market in the sessions leading into the break
- Component
- Time of Day
- Rule
- 9:45 AM–3:30 PM ET, consistent with the general breakout confirmation framework
- Component
- Stock Selection Criteria
- Rule
- No specific multi-stage base is required, unlike the VCP — the core requirement is simply a genuine, volume-confirmed close at a new 52-week high, ideally in a stock already showing broader relative strength
- Component
- Entry Trigger
- Rule
- A full-bodied candle closing above the prior 52-week high on volume meaningfully above the recent average, consistent with the standard breakout confirmation checklist
- Component
- Stop Loss
- Rule
- Below the most recent meaningful swing low or a fixed percentage below entry, sized to the stock's typical volatility
- Component
- Initial Profit Target
- Rule
- No fixed measured-move target — since the underlying research found no long-run reversal following this signal, a trailing stop (tied to a moving average) is a more consistent approach than a fixed price projection
- Component
- Trade Management
- Rule
- Trail the stop as the position develops rather than taking a full profit at a predetermined level, consistent with the research's finding that momentum from this signal tends to persist rather than mean-revert
- Component
- Invalidation Criteria
- Rule
- A close back below the prior 52-week high shortly after the breakout, particularly on rising volume — this suggests the level failed to hold as new support
| Component | Rule |
|---|---|
| Market Conditions Required | Stock closing at or breaking above its 52-week high; ideally showing relative strength against the broader market in the sessions leading into the break |
| Time of Day | 9:45 AM–3:30 PM ET, consistent with the general breakout confirmation framework |
| Stock Selection Criteria | No specific multi-stage base is required, unlike the VCP — the core requirement is simply a genuine, volume-confirmed close at a new 52-week high, ideally in a stock already showing broader relative strength |
| Entry Trigger | A full-bodied candle closing above the prior 52-week high on volume meaningfully above the recent average, consistent with the standard breakout confirmation checklist |
| Stop Loss | Below the most recent meaningful swing low or a fixed percentage below entry, sized to the stock's typical volatility |
| Initial Profit Target | No fixed measured-move target — since the underlying research found no long-run reversal following this signal, a trailing stop (tied to a moving average) is a more consistent approach than a fixed price projection |
| Trade Management | Trail the stop as the position develops rather than taking a full profit at a predetermined level, consistent with the research's finding that momentum from this signal tends to persist rather than mean-revert |
| Invalidation Criteria | A close back below the prior 52-week high shortly after the breakout, particularly on rising volume — this suggests the level failed to hold as new support |
The absence of a fixed Profit TargetA profit target is a predetermined exit price where you plan to close a winning trade and lock in gains — defined before you enter the position based on the risk-reward ratio you require and the next significant resistance or support level,Read definition → in this setup is a deliberate departure from several other breakout patterns in this hub. A measured-move target makes sense for a pattern built around a specific chart geometry; a 52-week high breakout is fundamentally a momentum-continuation signal, and the research behind it specifically argues against expecting a quick reversal back to the old range.
A Walk-Through: Trading a Confirmed New High
Picture a mid-cap industrial stock — call it ABC — that's spent the past several months grinding higher, outperforming its sector along the way. Its 52-week high sits at $64.50, set eight months earlier. The stock approaches that level again, testing it twice over two weeks without clearing it.
On the third attempt, ABC closes at $65.20 — a new 52-week high — on volume running 2.2x the recent average. That's the entry trigger: a confirmed close above the old ceiling with real volume behind it. The stop goes below the most recent swing low, around $61.80. Rather than setting a fixed target, the position is managed with a trailing stop tied to the 20-day moving average, allowing the trade to continue as long as the stock keeps making higher highs and higher lows.
Now picture an alternate version: ABC closes at $64.80 — barely above the old high — on volume only slightly above average. Two sessions later, it drifts back to $63.90, closing below the old 52-week high. That's the invalidation signal: the breakout failed to hold, and the position should already be closed rather than held on the assumption the level will eventually be reclaimed.
Where the 52-Week High Breakout Fails
The most common failure is treating every new 52-week high as automatically tradeable, without checking for the same volume confirmation any other breakout requires. A stock drifting to a marginal new high on unremarkable volume isn't demonstrating the same underreaction-then-catch-up dynamic the research describes — it may simply be grinding sideways at an elevated level without real conviction behind it.
It also fails around stocks approaching a 52-week high for the first time after a long, thin trading history, or on names with genuinely low liquidity, where a "new high" may reflect a lack of trading activity rather than the kind of broad-based underreaction the anchoring explanation depends on.
And it fails when the setup is applied without any attention to the broader market environment. A stock breaking to new highs while the overall market is in a clear downtrend is fighting a stronger, broader force, even if the anchoring mechanism behind the individual stock's level is sound in isolation.
A final, quieter failure mode is abandoning the trailing-stop discipline the setup calls for and instead taking a quick, small profit at the first sign of strength. Because the underlying research specifically found this signal's momentum tends to persist rather than reverse, exiting early on a modest gain works against the exact dynamic that gives the setup its edge in the first place — the payoff from this pattern tends to come from staying with a genuine move, not from capturing a small, fast gain and moving on.
Why Old Highs Can Act as Resistance Before They're Cleared
The same anchoring bias that explains the post-breakout momentum also explains why a stock often struggles on its first, second, or even third approach to a prior high before finally clearing it. Investors who bought near the old high and watched the stock pull back often look to sell "back to even" once the price returns to that level, creating real supply exactly at the price other investors are reluctant to pay above. This is part of why 52-week highs are frequently tested multiple times before a genuine breakout occurs, rather than being cleared cleanly on the first attempt.
This has a practical implication worth noting: a stock's second or third attempt at a 52-week high isn't automatically a weaker signal than its first attempt, the way a repeatedly-tested horizontal support or resistance level can be. Each unsuccessful test absorbs some of the "back to even" selling pressure described above, which can mean the eventual successful break faces less resistance than the very first attempt did — a genuinely different dynamic from an ordinary support or resistance level, where repeated failed tests can just as easily signal the level is strengthening as weakening.
Tools for Screening New 52-Week Highs
Manually tracking which stocks are approaching or breaking their 52-week high across a broad universe isn't realistic without a dedicated scan.
A platform like Trade Ideas can screen specifically for stocks making new 52-week highs on elevated volume, narrowing a broad market down to the names actually showing this specific, research-backed signal rather than requiring a manual review of every stock's yearly price history.
Where This Fits a Complete Trading Plan
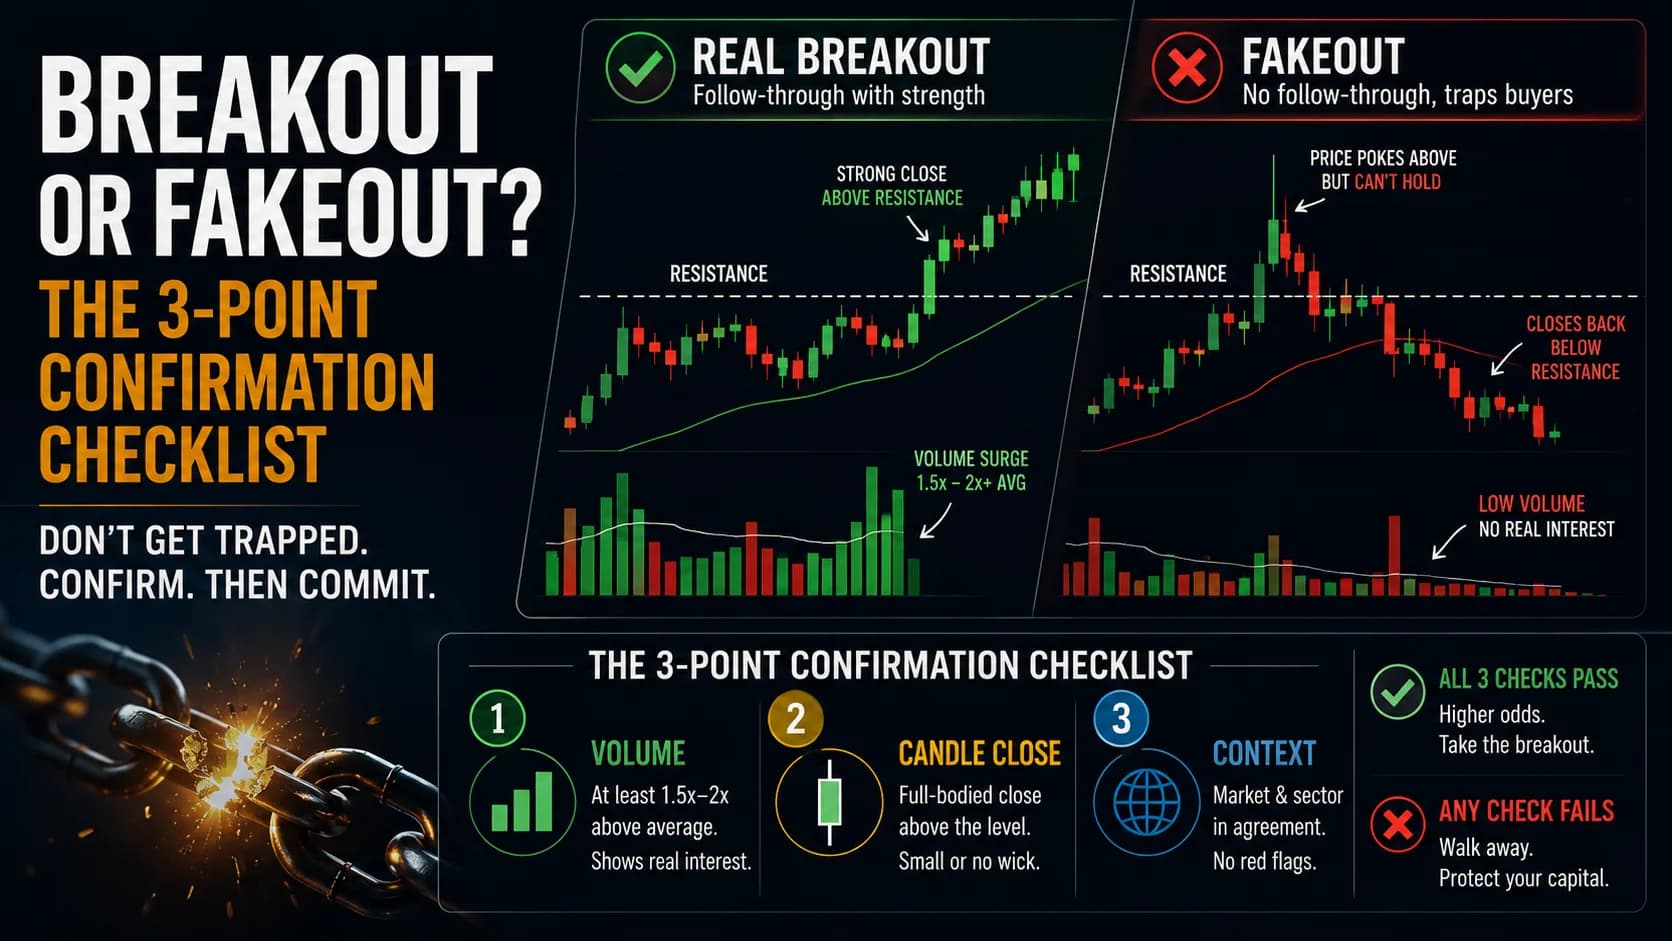
The 52-week high breakout still needs to clear the same basic confirmation logic covered in the breakout vs. fakeout checklist — volume and candle-close confirmation matter here just as much as with any other level, even though the underlying reason this particular level carries weight is different. For the deeper volume-reading techniques that can add confidence to a new-high breakout specifically, the volume breakout guide covers pace, OBV, and volume profile structure that apply directly here.
For the rest of the breakout and breakdown setups this guide complements, the Strategies Hub organizes the full library by market condition.
Frequently Asked Questions About 52-Week High Breakouts
Why does a 52-week high matter more than an ordinary resistance level?
This gives the 52-week high a behavioral explanation that ordinary support and resistance levels don't necessarily have — it isn't just a level that's been tested before, it's a specific price that investor psychology treats as a meaningful ceiling, which is part of why breaking it tends to matter more than clearing an arbitrary nearby level.
Key Takeaway: Treat the 52-week high as carrying added behavioral weight beyond an ordinary technical level, based on documented anchoring research.
Is the academic research behind this strategy directly about day trading?
The research supports the idea that the 52-week high reflects a genuine, slow-resolving underreaction rather than random noise, which is useful context for treating the level seriously. It doesn't provide direct evidence about what happens in the hours immediately following an intraday breakout of the level.
Key Takeaway: Use the academic research as evidence the level has real behavioral significance, not as a study of intraday trading outcomes specifically.
What is anchoring, and why does it explain this pattern?
This creates a gap between what the available information would suggest a stock is worth and what investors are actually willing to pay, right around the old high. That gap only closes gradually, which is the source of the momentum effect once the price does finally clear the level.
Key Takeaway: Anchoring bias delays, rather than prevents, the market's adjustment to good news near the 52-week high — which is exactly why a genuine break tends to carry follow-through.
Why does this setup use a trailing stop instead of a fixed profit target?
A fixed measured-move target makes more sense for a pattern defined by specific chart geometry, like a base or a range. A 52-week high breakout is fundamentally a momentum-continuation signal, and capping the potential gain with a rigid target works against the research finding that motivated the setup in the first place.
Key Takeaway: Let a trailing stop manage the exit, rather than a fixed target, consistent with the persistence the research documents.
Why do stocks often struggle on the first attempt to clear a 52-week high?
This is the same anchoring mechanism working from the supply side — a specific, identifiable group of investors has a strong behavioral reason to sell right at the old high, which is part of why multiple attempts are often needed before a genuine breakout occurs.
Key Takeaway: Expect resistance at a 52-week high to come partly from investors selling to break even, not purely from arbitrary chart-based selling.
Does this strategy require the multi-stage base the VCP requires?
The two patterns can overlap in practice, since a VCP's pivot breakout sometimes coincides with a new 52-week high, but they aren't the same setup. A stock can break to a new 52-week high without ever showing the staged contraction pattern the VCP specifically requires.
Key Takeaway: Treat the 52-week high breakout and the VCP as related but distinct setups that can, but don't have to, occur together.
Why does this setup fail on illiquid or thinly traded stocks?
The anchoring explanation depends on a meaningful number of market participants having actually observed and reacted to the prior high. A thinly traded name doesn't have the same breadth of investor attention behind its own 52-week high.
Key Takeaway: Reserve this setup for liquid, broadly followed stocks rather than thinly traded names with a limited trading history.
How does the broader market environment affect this setup?
The setup works best when the individual stock's strength is reinforced by, rather than fighting against, the broader market's direction. Ignoring broader context and trading every new-high breakout regardless of the overall market backdrop increases the odds of fighting a larger trend.
Key Takeaway: Check the broader market's direction before trading a 52-week high breakout, the same way broader context matters for any other breakout setup.
Is this the same as the CANSLIM or growth-investing philosophy of buying stocks making new highs?
Practitioner traditions like CANSLIM incorporate the "new highs" concept alongside fundamental screening criteria (earnings growth, institutional sponsorship, and others) that go beyond the pure price-and-volume approach covered in this guide.
Key Takeaway: This setup captures the technical core of the "new highs" concept; broader growth-investing methodologies layer additional fundamental criteria on top of it.
What volume level actually confirms a 52-week high breakout?
Since the anchoring explanation depends on a meaningful number of investors reacting to and eventually overcoming their reluctance around the old high, a breakout without real volume behind it is less consistent with that underlying mechanism, regardless of how clean the price action looks.
Key Takeaway: Require the same volume confirmation used for any other breakout — a 52-week high without volume support is a weaker signal than the research would suggest.
Disclaimer
Article Sources
- George, T. J., & Hwang, C. (2004). "The 52-Week High and Momentum Investing." Journal of Finance, 59(5), 2145–2176. — the foundational peer-reviewed study establishing the predictive power of nearness to the 52-week high and its anchoring-based explanation, referenced throughout this guide.
- Tversky, A., & Kahneman, D. (1974). "Judgment Under Uncertainty: Heuristics and Biases." Science, 185(4157), 1124–1131. — the foundational psychological research on anchoring bias that underpins the behavioral explanation for this pattern.