A stock goes quiet. Really quiet — the kind of quiet where the daily RangeA range (or trading range) is a price zone where a stock oscillates between a defined support floor and resistance ceiling without making meaningful new highs or lows — price is consolidating rather than trending, and the dominant trade is Read definition → shrinks to almost nothing and the chart looks like a flat line for a week straight. Most traders scroll past it looking for something more exciting. That quiet stretch is often the exact setup a SqueezeA squeeze (short squeeze) occurs when a stock that is heavily shorted rises sharply, forcing short sellers to buy back shares to cover their losing positions — the forced buying adds fuel to the upward move, creating a feedback loop that caRead definition → trader has been waiting for.
Volatility doesn't stay constant. It expands, contracts, and expands again in a recurring cycle, and the contraction phase — when a stock's range compresses to an unusually tight band — has a well-documented tendency to resolve into an expansion. The Bollinger Band Squeeze is built entirely around identifying that contraction before it resolves, rather than chasing the move after it's already underway.
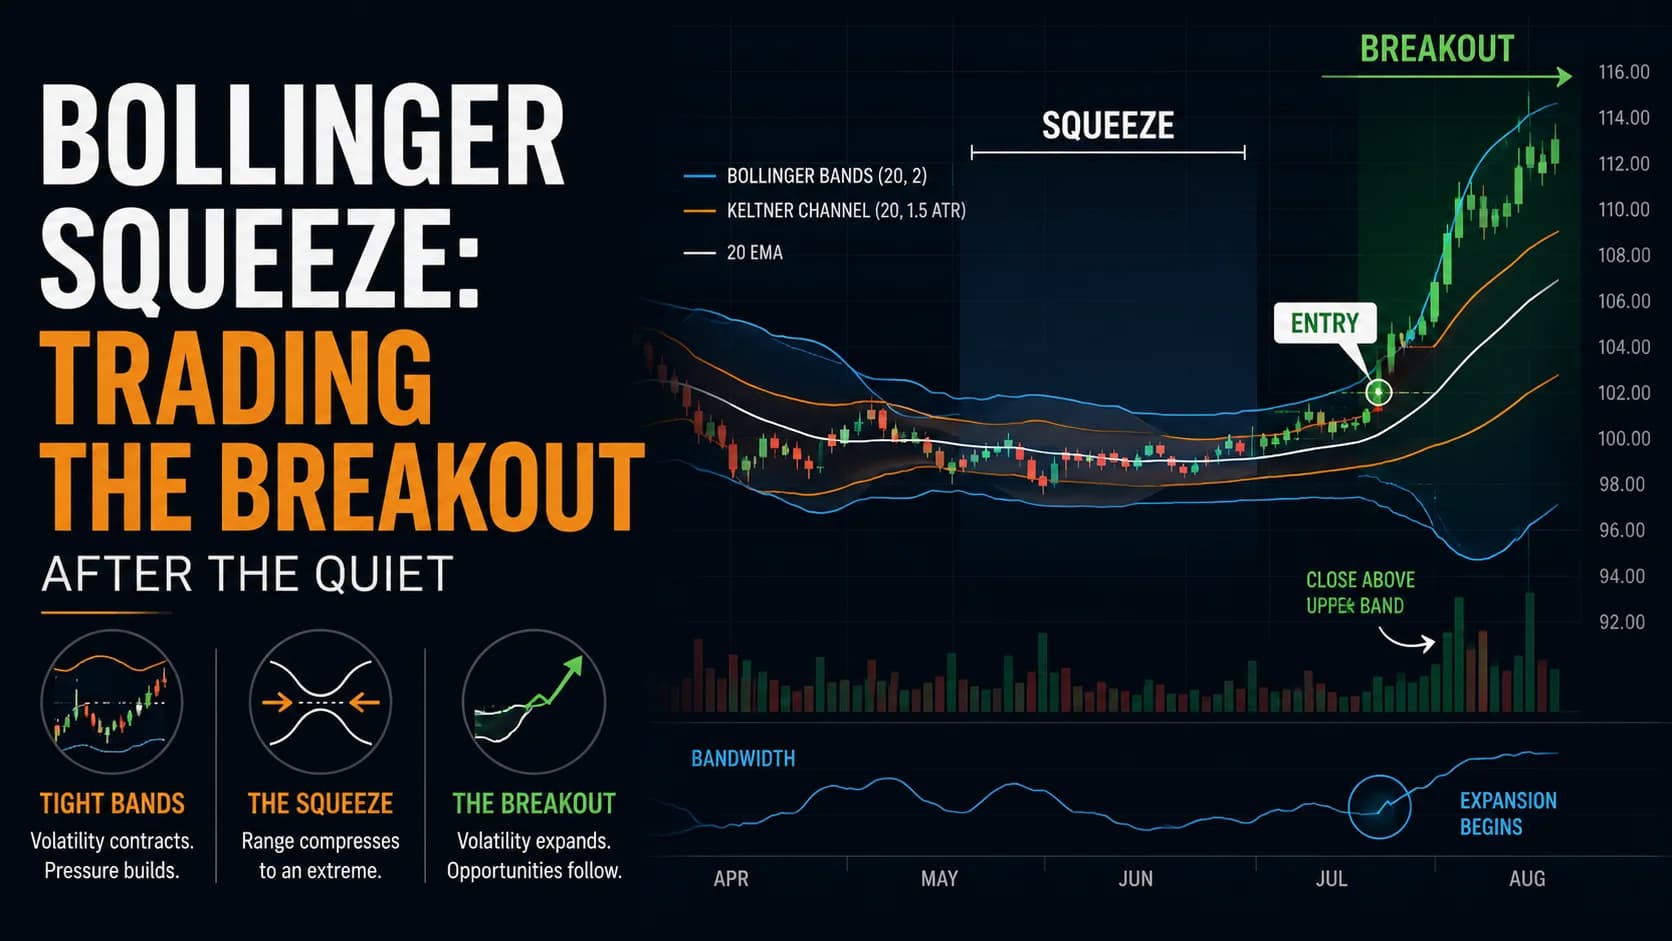
What is a Bollinger Band Squeeze? A Bollinger Band Squeeze occurs when a stock's Bollinger BandsBollinger Bands are three lines plotted around price: a middle moving average and two outer bands set at standard deviations above and below it — they show how stretched or compressed current price action is relative to recent history.Read definition → — the standard-deviation envelope plotted around a Moving AverageA moving average smooths out price data by calculating the average closing price over a set number of periods — it filters out noise and identifies the trend direction, with the stock above the MA interpreted as bullish and below as bearishRead definition → — narrow to an unusually tight width relative to their recent history, signaling a period of contracted volatility. According to John Bollinger's own research, periods of low volatility tend to be followed by periods of high volatility, which is why a squeeze is treated as a setup for an upcoming directional move rather than a signal to fade.
A Squeeze Is the Opposite Trade From a Mean-Reversion Fade
This is worth stating plainly, because both setups use the same indicator and it's easy to confuse them. Mean reversion fades a stock that has moved too far outside its bands, betting on a snap back toward the middle. A squeeze trade does the opposite: it waits for the bands to compress toward each other, then trades the BreakoutA breakout is when price moves decisively beyond a defined level — a resistance zone, a consolidation boundary, a chart pattern boundary, or a prior high — suggesting that the previous supply at that level has been overcome.Read definition → away from the middle once the bands start expanding again.
Confusing the two is a common, costly mistake. A trader who tries to fade a squeeze breakout — treating the initial expansion move as an overextension to sell into — is fighting the exact condition the setup is designed to catch. The squeeze isn't an extension to fade; it's the calm before the extension even starts.
Measuring a Genuine Squeeze: BandWidth, Not Just "The Bands Look Tight"
Eyeballing whether bands look narrow is unreliable, especially across stocks with different price levels and typical volatility. Bollinger BandWidth solves that by expressing the gap between the upper and lower band as a percentage of the middle band, making it comparable over time for the same instrument.
BandWidth should be read relative to its own recent history, not against some universal number — a BandWidth reading considered "narrow" for a historically volatile stock might be an ordinary reading for a quiet one. The practical approach: look at BandWidth over the past six to twelve months and treat readings in the bottom 10–20% of that range as a genuine squeeze, not an arbitrary absolute threshold.
A second useful confirmation is Keltner Channel overlap — plotting an ATR-based Keltner Channel over the Bollinger Bands and checking whether the Bollinger Bands have moved fully inside the Keltner Channel. When they have, volatility (as measured by standard deviation) has compressed below what would be typical (as measured by ATR), which is a stronger squeeze confirmation than BandWidth alone.
The reason this combination works better than either indicator alone comes down to what each one actually measures. Bollinger Bands respond to standard deviation, which reacts quickly to a handful of unusually quiet sessions. Keltner Channels respond to average true range, which tends to smooth out over a slightly longer window. When the faster-reacting Bollinger Bands compress inside the slower-reacting Keltner Channel, it suggests the quiet stretch is genuine and sustained rather than a brief lull inside an otherwise normal volatility regime.
The Squeeze Breakout: A Setup Specification
- Component
- Market Conditions Required
- Rule
- BandWidth in the bottom 10–20% of its trailing 6–12 month range for this specific instrument; ideally, Bollinger Bands sitting fully inside a Keltner Channel (20-period EMA, 1.5x ATR) as a second confirmation
- Component
- Time of Day
- Rule
- Any session is valid for identifying the squeeze itself, but the breakout entry should be taken between 9:45 AM and 3:30 PM ET, avoiding the first 15 minutes when opening volatility can produce a false expansion read
- Component
- Stock Selection Criteria
- Rule
- Liquid stocks or ETFs with average daily volume above 1 million shares; avoid names with a scheduled catalyst (earnings, FDA decision) inside the expected holding window, since those produce a volatility expansion for reasons unrelated to the technical squeeze
- Component
- Entry Trigger
- Rule
- The first closing price outside either Bollinger Band following a confirmed squeeze, in the direction of the break, with volume at least 1.5x the recent average
- Component
- Stop Loss
- Rule
- Placed at the opposite Bollinger Band's level at the time of entry, or at the low/high of the squeeze range — whichever is tighter
- Component
- Initial Profit Target
- Rule
- Measure the width of the squeeze range (high to low during the compression) and project that same distance from the breakout point as a first target; scale out the remainder using a trailing stop tied to the moving average
- Component
- Trade Management
- Rule
- If price breaks out, then closes back inside the bands within one to two sessions without reaching the projected target, treat the breakout as failed rather than waiting for a second attempt
- Component
- Invalidation Criteria
- Rule
- BandWidth expands sharply without a confirmed directional close outside either band — this typically means the squeeze resolved into a whipsaw rather than a clean breakout, and the setup should be abandoned for this instance
| Component | Rule |
|---|---|
| Market Conditions Required | BandWidth in the bottom 10–20% of its trailing 6–12 month range for this specific instrument; ideally, Bollinger Bands sitting fully inside a Keltner Channel (20-period EMA, 1.5x ATR) as a second confirmation |
| Time of Day | Any session is valid for identifying the squeeze itself, but the breakout entry should be taken between 9:45 AM and 3:30 PM ET, avoiding the first 15 minutes when opening volatility can produce a false expansion read |
| Stock Selection Criteria | Liquid stocks or ETFs with average daily volume above 1 million shares; avoid names with a scheduled catalyst (earnings, FDA decision) inside the expected holding window, since those produce a volatility expansion for reasons unrelated to the technical squeeze |
| Entry Trigger | The first closing price outside either Bollinger Band following a confirmed squeeze, in the direction of the break, with volume at least 1.5x the recent average |
| Stop Loss | Placed at the opposite Bollinger Band's level at the time of entry, or at the low/high of the squeeze range — whichever is tighter |
| Initial Profit Target | Measure the width of the squeeze range (high to low during the compression) and project that same distance from the breakout point as a first target; scale out the remainder using a trailing stop tied to the moving average |
| Trade Management | If price breaks out, then closes back inside the bands within one to two sessions without reaching the projected target, treat the breakout as failed rather than waiting for a second attempt |
| Invalidation Criteria | BandWidth expands sharply without a confirmed directional close outside either band — this typically means the squeeze resolved into a whipsaw rather than a clean breakout, and the setup should be abandoned for this instance |
The volume confirmation on the entry trigger matters more here than in most setups. A squeeze that resolves on light volume is a common source of false breakouts — the bands widen because price drifted slightly outside them, not because real participation returned to the stock. Requiring at least 1.5x average volume at the breakout close filters out a meaningful share of these.
A Walk-Through: Trading a Squeeze Resolution
Picture a mid-cap consumer stock — call it XYZ, trading around $58 — that's spent the last eight sessions grinding between $57.20 and $58.80, a range that's unusually tight relative to its normal daily movement. BandWidth has fallen to its lowest level in the past nine months, and the Bollinger Bands have moved fully inside a 20-period Keltner Channel — both confirmations are in place.
On the ninth session, the stock closes at $59.35 — outside the upper Bollinger Band for the first time in over a week — on volume running about 1.8x the 20-day average. That's the entry trigger: a confirmed close outside the band, in the direction of the eventual break, with volume confirming real participation.
The squeeze range was $1.60 wide ($57.20 to $58.80). Projected from the $59.35 breakout point, the first target sits near $60.95. The stop goes at the opposite band's level at entry, roughly $58.20 — just below the recent range. Over the next three sessions, the stock grinds up to $61.10, the first scale-out triggers near the projected target, and the remainder trails up on a moving-average stop before being closed around $61.80 as momentum fades.
Now picture the same setup with one difference: the stock closes at $59.10 on the breakout day — technically outside the band, but on volume only slightly above average. Two sessions later, it drifts back to $58.60, closing back inside the bands without ever reaching the projected target. That's the Trade Management rule firing: the breakout failed, and the position should already be closed rather than held on the hope that a second attempt develops.
Managing the Trade After the Breakout Confirms
The projected target — the squeeze range's width added to the breakout point — is a reasonable first scale-out level, but it's a starting estimate, not a guarantee of where the move will end. Markets that break out of a genuine multi-month compression sometimes travel considerably further than the squeeze range would suggest, which is why holding a partial position with a trailing stop after the first target often outperforms taking the entire position off at once.
The more important discipline is the failed-breakout rule. A close back inside the bands within a session or two of the breakout is a clear, mechanical signal that the expected expansion didn't materialize — not a reason to add to the position hoping for a delayed follow-through.
Where the Squeeze Breakout Fails
The most common failure is the false breakout on light volume described above — price closes narrowly outside a band, momentum-chasers pile in, and the move reverses within a day or two once the initial buyers are exhausted. The 1.5x volume confirmation requirement exists specifically to reduce (not eliminate) this risk.
This failure mode tends to cluster around squeezes that have been visible and widely discussed for a long time. A compression pattern that's been flagged by scanners and chart services for a week or more attracts anticipatory positioning — traders buying ahead of the actual breakout in hopes of catching it early. That anticipatory buying can itself produce a false breakout on unremarkable volume, since it isn't driven by the same fresh participation a genuine resolution requires. Waiting for the volume confirmation, rather than acting on the first tick outside the band, is the specific discipline that filters out this pattern.
It also fails around scheduled catalysts. A stock that's been quiet purely because it's waiting for an earnings report isn't showing a genuine volatility-cycle squeeze — it's showing pre-event calm, and the eventual "breakout" on the earnings date reflects the news, not the technical setup. The stock-selection criteria above exist to screen these out in advance.
And it fails in choppy, low-ADX conditions more broadly, where a squeeze can resolve into another leg of directionless drift rather than a clean trend. A squeeze is a volatility-compression signal, not a trend-strength signal — confirming that the eventual breakout also comes with a rising ADX adds a layer of confidence that the move has real directional conviction behind it, not just a temporary widening of the bands.
Trading Both Directions: Why the Squeeze Doesn't Predict Direction
One of the more important things to internalize about this setup is that BandWidth compression says nothing about which way the eventual breakout will go — only that a move is more likely than usual to be coming. Traders who develop a directional bias before the breakout confirms are effectively guessing, then looking for reasons to justify the guess once price starts moving.
The discipline here is waiting for the actual directional close before committing to a side, even when the broader trend or a personal opinion about the stock suggests one direction is more likely. Some traders manage this by placing both a buy-stop above and a sell-stop below the squeeze range simultaneously, letting whichever one triggers define the trade and canceling the other — a mechanical way of removing the temptation to pre-guess the direction.
Tools for Scanning Squeeze Conditions Across a Watchlist
Manually checking BandWidth percentile rank and Keltner Channel overlap across a full watchlist isn't realistic during a normal session — this is exactly the kind of repetitive, quantitative filtering a scanner handles well.
A platform like Trade Ideas can screen in real time for stocks with BandWidth near multi-month lows, narrowing a broad universe down to the handful of names actually compressed enough to qualify, rather than requiring a manual review of BandWidth on each chart individually.
Where the Squeeze Fits a Complete Trading Plan
The Bollinger Band Squeeze works best as a patience-driven complement to more reactive setups — it requires identifying a condition well before the actual trade trigger, then waiting, sometimes for days, for the resolution to confirm. That waiting period is often where traders abandon the setup prematurely, entering early on a partial band touch rather than a confirmed close with volume.
Reviewing RSI, MACD, and Bollinger Bands is worth doing first for anyone who needs the underlying mechanics refreshed before applying the tighter volume and BandWidth-percentile rules in this guide. For the broader mean-reversion and range-condition setups this squeeze strategy complements — mean reversion, range trading, and low-volume conditions — the Strategies Hub organizes the full library by market regime.
Frequently Asked Questions About the Bollinger Band Squeeze
How is a Bollinger Band Squeeze different from a mean-reversion fade using the same bands?
The two setups use the identical indicator for opposite purposes. A squeeze is waiting for the bands to narrow and then break outward; mean reversion is waiting for the bands to already be wide, with price outside them, before fading back toward the middle. Applying one setup's logic to the other's setup is a common source of confusion.
Key Takeaway: Check whether the bands are currently narrowing (squeeze) or already extended (mean reversion) before assuming which setup applies.
What BandWidth reading actually counts as a genuine squeeze?
BandWidth needs to be judged relative to the instrument's own history, not against a fixed number that applies to every stock. A historically volatile stock's "quiet" reading can still be numerically higher than a typically calm stock's normal reading, so comparing across different names using an absolute threshold produces misleading results.
Key Takeaway: Rank BandWidth against the specific stock's own recent history rather than comparing it to an absolute number.
Why does the squeeze breakout require volume confirmation when the price signal alone seems clear?
Volume is the piece that separates a real resolution of the volatility cycle from a minor, low-conviction move that happens to close outside the band. Requiring at least 1.5x average volume filters out a meaningful share of the breakouts that reverse within a day or two.
Key Takeaway: Treat a band breakout on below-average volume as unconfirmed, regardless of how clean the price close looks.
Does a squeeze predict which direction the eventual breakout will go?
Developing a directional bias before the breakout confirms turns a rules-based setup into a guess, since the compression itself carries no directional information. The setup's value is in identifying that volatility is likely to expand, not in forecasting which way price will move when it does.
Key Takeaway: Wait for the confirmed directional close before taking a side, even if a personal opinion suggests one direction is more likely.
Why does a scheduled earnings date invalidate a squeeze setup?
The setup's logic depends on the compression being a natural part of the volatility cycle rather than pre-event calm ahead of a known information release. Trading the "breakout" around an earnings date is really trading the earnings reaction, which carries different risk and timing considerations than a technical squeeze resolution.
Key Takeaway: Screen out any instrument with a known catalyst inside the expected holding window before treating a tight range as a tradeable squeeze.
How does the Keltner Channel overlap check improve on BandWidth alone?
BandWidth alone measures compression relative to the stock's own recent history, which can occasionally flag a squeeze during a period that's merely quiet-for-this-stock rather than quiet in an absolute sense. Confirming that the Bollinger Bands have moved fully inside a Keltner Channel adds an independently calculated volatility measure that has to agree before the setup qualifies.
Key Takeaway: Use Keltner Channel overlap as a second, independently calculated squeeze confirmation rather than relying on BandWidth in isolation.
How long can a genuine squeeze last before it resolves?
Traders sometimes assume a squeeze that's lasted a long time is "due" to resolve, but volatility compression doesn't operate on a schedule. The correct approach is monitoring BandWidth and Keltner overlap continuously and waiting for the actual directional, volume-confirmed close rather than timing an entry based on how many days the squeeze has persisted.
Key Takeaway: Trade the confirmed breakout signal, not an assumption about how long a squeeze "should" last before resolving.
What should happen if price breaks out, reaches the projected target, but the trend clearly continues further?
The squeeze-range projection is a reasonable estimate, not a hard ceiling — genuine multi-month compressions sometimes resolve into moves considerably larger than the projection would suggest. Holding a partial position past the first target with a mechanical trailing stop avoids exiting a strong move entirely at an arbitrary distance-based number.
Key Takeaway: Treat the projected target as a partial exit level, not a signal to close the entire position regardless of continued strength.
Why does a failed breakout matter more in this setup than in an ordinary breakout trade?
Since qualifying squeeze setups are inherently less frequent than ordinary chart patterns, there's a natural pull toward giving a failed breakout extra room "since it took so long to set up." That reasoning ignores that the failed-breakout signal — a close back inside the bands without reaching the target — is just as mechanical and reliable as the entry trigger itself.
Key Takeaway: Treat the failed-breakout exit with the same discipline as the entry trigger, regardless of how long the squeeze took to develop.
How many genuine squeeze setups should be expected across a typical watchlist in a given week?
Because true multi-month-low BandWidth readings are inherently uncommon for any single stock, qualifying setups across even a broad watchlist tend to be limited. Scanning across a wider universe, rather than watching a handful of familiar names, is the more reliable way to find enough qualifying setups without loosening the compression threshold.
Key Takeaway: Widen the scanning universe rather than lowering the BandWidth threshold if qualifying setups feel too infrequent.
Disclaimer
Article Sources
- Bollinger Band Squeeze — StockCharts ChartSchool - explains the squeeze concept and John Bollinger's guidance that low-volatility periods tend to precede high-volatility periods.chartschool.stockcharts.com
- Bollinger BandWidth — StockCharts ChartSchool - documents how BandWidth is calculated and why it should be judged relative to an instrument's own recent history.chartschool.stockcharts.com
- Bollinger Bands — StockCharts ChartSchool - covers the underlying construction of the bands referenced throughout this guide.chartschool.stockcharts.com
- What Are Bollinger Bands? — Fidelity - a practical overview of Bollinger Band construction and standard parameter settings.fidelity.com