A stock drops five percent in twenty minutes on no real news, and the instinct kicks in immediately: it's overdone, it has to bounce. Sometimes that instinct is right. Sometimes the stock keeps falling for three more hours while everyone who bought the "overdone" dip watches their account bleed out.
The difference between those two outcomes isn't luck. It's whether the extension away from the mean was actually statistical noise or the start of something real — and Mean ReversionMean reversion is the trading concept that after an extreme price move away from an average (VWAP, a moving average, a prior range), price has a statistical tendency to return toward that average — allowing traders to fade overextended moveRead definition → trading lives or dies on being able to tell the two apart before risking capital on the assumption.
What is mean reversion trading? Mean reversion is the idea that price, after moving an unusually large distance away from its average — a Moving AverageA moving average smooths out price data by calculating the average closing price over a set number of periods — it filters out noise and identifies the trend direction, with the stock above the MA interpreted as bullish and below as bearishRead definition →, a VWAPVWAP (Volume Weighted Average Price) is the average price a security has traded at throughout the session, weighted by volume — it's the most important intraday indicator for day traders, serving as a real-time measure of fair value and theRead definition →, a recent RangeA range (or trading range) is a price zone where a stock oscillates between a defined support floor and resistance ceiling without making meaningful new highs or lows — price is consolidating rather than trending, and the dominant trade is Read definition → — has a statistical tendency to drift back toward that average over time. Traders build setups around fading these extensions, entering against the recent move and targeting a return to the mean rather than a continuation of the TrendA trend is a sustained directional movement in price over time — an uptrend is characterized by a sequence of higher highs and higher lows, a downtrend by lower highs and lower lows — and correctly identifying the current trend direction isRead definition →.
Mean Reversion Is a Statistical Tendency, Not a Guarantee
The academic case for mean reversion is real, but it's narrower than most retail explanations suggest. Jegadeesh (1990), published in the Journal of Finance, documented that a portfolio strategy buying prior-month losers and selling prior-month winners earned roughly 2% per month over the 1934–1987 period — evidence of a genuine short-term reversal effect in individual stock returns.
That finding matters, but it needs an honest caveat: it's a monthly-horizon, portfolio-level academic result, not a documented intraday win rate. It supports the idea that extreme short-term moves tend to partially reverse — it does not promise that any specific 2-standard-deviation intraday extension will do the same on any specific day. Treat the academic literature as evidence the underlying tendency is real, not as a source for a specific edge percentage to expect on an individual trade.
The honest summary: mean reversion is a genuine, researched statistical property of prices — not a mechanical law, and not something that applies equally to every extension regardless of its cause.
How Mean Reversion Differs From Fading a Range
It's easy to lump this in with range trading, but the two rest on different logic.
Range trading fades a horizontal boundary — a support or resistance level that's been tested and held. It requires a sideways, non-trending stock, and it stops making sense the moment a real trend develops.
Mean reversion fades distance from a moving average or VWAP, and that mean can be sloped. A stock in a clean uptrend can pull back three standard deviations below its rising 20-period average and still be in an intact trend — the reversion trade there is a snap back toward the still-rising mean, not a bet that the uptrend is over. That's a meaningfully different trade than fading a flat horizontal ceiling, and it's why mean reversion setups can appear in trending markets, not just choppy or range-bound ones.
Measuring the Extension: Standard Deviation, RSI, and the Anchor
Three components define a measurable, tradeable extension.
The anchor. This is the "mean" being reverted to — most commonly a 20-period simple moving average, though VWAP or an anchored VWAP from a specific catalyst works as well. The anchor should be something with an actual statistical basis, not an arbitrary line drawn on a chart.
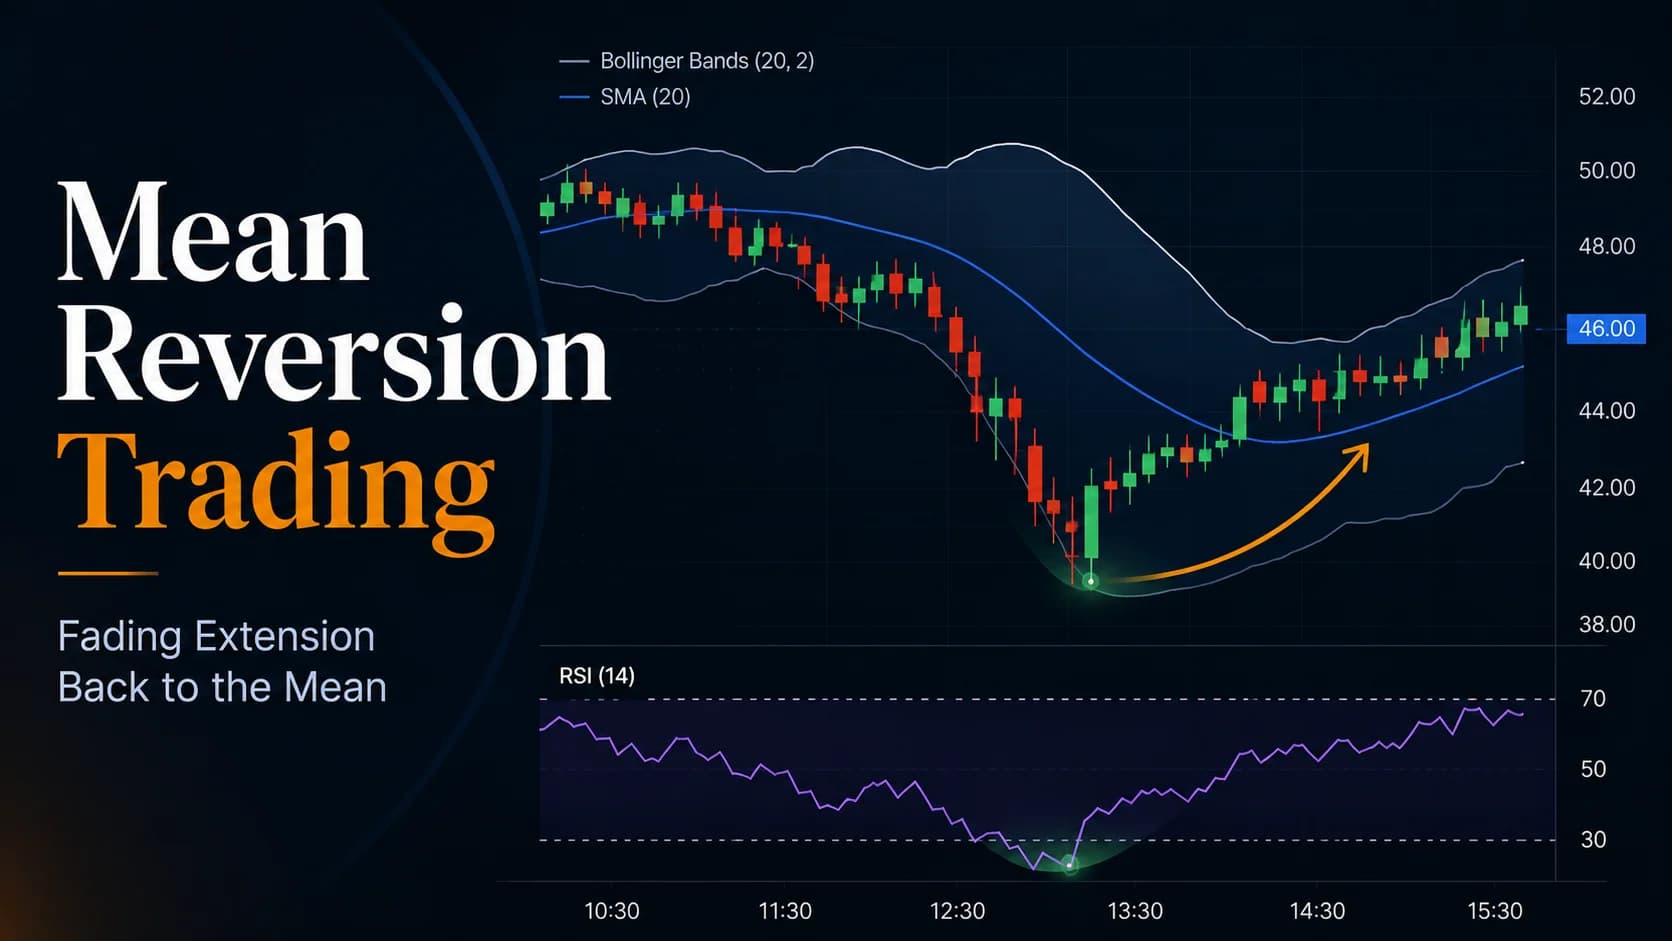
The extension measurement. Bollinger Bands, built by plotting lines two standard deviations above and below a 20-period simple moving average, are the standard tool here. By construction, roughly 95% of price action under a normal distribution should fall inside two standard deviations — so a close outside the bands is, statistically, an unusual event worth paying attention to, not proof of anything on its own.
A confirming oscillator. RSI(14) above 70 or below 30 alongside the band extension adds a second, independent measure of the same overextension, reducing the odds of fading a move that the bands alone would flag but that isn't actually statistically unusual once momentum is considered.
None of these three, alone, is a signal to trade. Together, they define an extension precise enough to build a setup around.
A practical wrinkle worth knowing: Bollinger himself has noted that the standard deviation multiplier can be adjusted slightly for different moving-average lengths — closer to 2.1 for a 50-period average, closer to 1.9 for a 10-period one — since a longer lookback changes how the standard deviation itself is calculated. The adjustment is small, and the default 20-period, 2-standard-deviation setup remains the right starting point for anyone building this setup for the first time. Chasing a custom multiplier before understanding how the default behaves is a common way to end up curve-fitting a setting to a handful of past trades rather than trading a genuine statistical tendency.
The Standard-Deviation Extension Fade: A Setup Specification
- Component
- Market Conditions Required
- Rule
- Price closes outside the 20-period, 2-standard-deviation Bollinger Band; no scheduled catalyst (earnings, FOMC, CPI, a company-specific news event) explains the move for this instrument today
- Component
- Time of Day
- Rule
- 10:00 AM–3:30 PM ET only — the opening 30 minutes are excluded, since an opening extension is often a legitimate repricing on overnight news rather than an overreaction
- Component
- Stock Selection Criteria
- Rule
- Liquid large-cap stocks or major ETFs; average daily volume above 1 million shares; avoid low-float and single-catalyst biotech names, where an "extension" is frequently a justified repricing rather than an overreaction
- Component
- Entry Trigger
- Rule
- Price closes back inside the band after having closed outside it, with RSI(14) confirming (above 70 for a short fade, below 30 for a long fade) at the time of the extension
- Component
- Stop Loss
- Rule
- Placed beyond the high or low of the most extended candle, or at a fixed 1x ATR(14) buffer beyond it — whichever is wider
- Component
- Initial Profit Target
- Rule
- Scale out roughly half the position at the moving average (the band's basis line); hold the remainder for the opposite band only if the broader tape is genuinely range-bound rather than trending
- Component
- Trade Management
- Rule
- If price closes outside the band a second time without returning to the mean, and ADX(14) is rising, treat the extension as a trend continuation, not an overreaction — exit rather than average in
- Component
- Invalidation Criteria
- Rule
- A confirmed scheduled catalyst (earnings reaction, guidance change, regulatory news) explains the extension — the statistical overreaction assumption behind the setup no longer applies
| Component | Rule |
|---|---|
| Market Conditions Required | Price closes outside the 20-period, 2-standard-deviation Bollinger Band; no scheduled catalyst (earnings, FOMC, CPI, a company-specific news event) explains the move for this instrument today |
| Time of Day | 10:00 AM–3:30 PM ET only — the opening 30 minutes are excluded, since an opening extension is often a legitimate repricing on overnight news rather than an overreaction |
| Stock Selection Criteria | Liquid large-cap stocks or major ETFs; average daily volume above 1 million shares; avoid low-float and single-catalyst biotech names, where an "extension" is frequently a justified repricing rather than an overreaction |
| Entry Trigger | Price closes back inside the band after having closed outside it, with RSI(14) confirming (above 70 for a short fade, below 30 for a long fade) at the time of the extension |
| Stop Loss | Placed beyond the high or low of the most extended candle, or at a fixed 1x ATR(14) buffer beyond it — whichever is wider |
| Initial Profit Target | Scale out roughly half the position at the moving average (the band's basis line); hold the remainder for the opposite band only if the broader tape is genuinely range-bound rather than trending |
| Trade Management | If price closes outside the band a second time without returning to the mean, and ADX(14) is rising, treat the extension as a trend continuation, not an overreaction — exit rather than average in |
| Invalidation Criteria | A confirmed scheduled catalyst (earnings reaction, guidance change, regulatory news) explains the extension — the statistical overreaction assumption behind the setup no longer applies |
The invalidation rule tied to ADX deserves emphasis: a stock "walking the band" — repeatedly touching or closing beyond one band in a strong trend without reverting — is one of the most common ways this setup produces a string of losses. The Bollinger Bands' own documentation describes this exact behavior as a normal feature of strong trends, not a flaw in the indicator. Confirming that ADX isn't rising alongside the extension is what separates a genuine overreaction from the early stage of a real move.
A Walk-Through: Fading a 2-Standard-Deviation Extension
Picture a large-cap industrial name — call it ABC, trading around $86 — with no scheduled catalyst today. Through the first two hours, it tracks its rising 20-period moving average closely, currently sitting near $85.60.
Around 11:15 AM ET, a large sell program hits the stock over about four minutes, dropping it to $83.40 — a close outside the lower Bollinger Band, with RSI(14) falling to 24. There's no news attached to the move; it looks like order-flow pressure rather than a repricing.
The next 5-minute candle closes back at $84.10, moving back inside the band. That's the entry trigger: a close back inside the band following an extension, with RSI confirming oversold conditions at the extreme. The stop goes at $83.15 — below the extension candle's low, with a small ATR buffer. The first target is the moving average, now near $85.70, roughly $1.60 away against a risk of about $0.95.
Over the next 40 minutes, the stock grinds back up to $85.75 and the first half of the position comes off. ADX has stayed flat through the move, consistent with an overreaction rather than a new downtrend, so the remaining half trails toward the upper band before being closed as momentum fades near $86.40.
Now picture the same setup with one difference: instead of closing back inside the band, the stock closes below the lower band a second time, and ADX has been climbing steadily since the first extension. That's the Trade Management override firing — the position should already be closed at that point, not held on the assumption that the mean is still coming.
Managing the Trade Between the Extension and the Mean
Scaling out at the mean rather than holding for the full distance to the opposite band reflects a simple reality: reversion to the mean is the higher-probability part of the move. A continuation all the way to the opposite band requires the broader tape to actually be range-bound, which the setup doesn't assume by default.
The more important discipline is treating "the mean hasn't been reached yet" and "this is now a trend, not an overreaction" as two different situations requiring two different responses. Only the first calls for patience. The second calls for an exit, regardless of how far price has already moved in the trade's favor.
Where Mean Reversion Fails: Walking the Bands
This setup's single most common failure mode is exactly the one Bollinger's own documentation describes: in a strong trend, price can walk along one band for an extended stretch, closing beyond it repeatedly without ever meaningfully reverting. A trader fading the first touch, then the second, then the third, isn't trading mean reversion at that point — they're fighting a trend with a tool built for the opposite condition.
It also fails around confirmed catalysts. A stock that gaps or extends sharply on genuine earnings news, a guidance cut, or a regulatory ruling isn't statistically overextended — it's been correctly repriced to new information, and there's no "mean" to revert to until the market forms a new one. The Market Conditions Required row above exists specifically to screen these out before the trade is even considered.
And it fails in the same way most fade strategies fail when overused: taking every band touch as a signal, rather than reserving the setup for extensions that also clear the RSI confirmation and the no-catalyst check. Three genuine setups a week beat ten marginal ones that ignore half the checklist.
Adapting Mean Reversion to Different Anchors: SMA, VWAP, and Bollinger Basis
The 20-period SMA and its Bollinger Bands are the most standard anchor, but they're not the only one worth knowing.
VWAP works as an anchor for intraday mean reversion specifically, since it reflects the volume-weighted average price actually paid so far in the session — a stock trading three or four times its average true range away from VWAP with no catalyst is behaving similarly to a Bollinger Band extension, just measured against a different reference line.
Anchored VWAP from a specific event — an earnings gap, a guidance change, a major catalyst — creates a mean specific to that new information, useful when the standard 20-period SMA hasn't caught up to a recent regime shift yet.
Each anchor answers a slightly different question: the 20-period SMA asks "how far is this from its recent average price," VWAP asks "how far is this from today's actual volume-weighted price," and anchored VWAP asks "how far is this from the average price since the thing that changed the story." Matching the anchor to the actual question being asked matters more than defaulting to whichever one is easiest to plot.
The same logic extends beyond individual stocks. Index futures and heavily traded currency pairs exhibit the same statistical extension-and-reversion behavior around their own moving averages, though the "no catalyst" check becomes a "no scheduled economic release" check instead — a currency pair extending sharply ahead of a central bank announcement isn't behaving the same way as one extending on pure order-flow pressure during a quiet session, for exactly the same reason an earnings-driven stock extension isn't a genuine mean-reversion candidate.
Tools for Measuring Extension in Real Time
Spotting a 2-standard-deviation Bollinger Band close, confirming RSI, and checking ADX simultaneously across a watchlist isn't something to do by scrolling through charts one at a time — it's a filtering job.
A platform like Trade Ideas can scan in real time for stocks closing outside their bands with RSI confirmation, narrowing a broad watchlist down to the handful of names actually showing a measurable extension at any given moment, rather than requiring a manual chart-by-chart review during a fast-moving session.
Where Mean Reversion Fits a Complete Trading Plan
Mean reversion works best as one tool in a broader plan that also accounts for genuine trend days, low-volume conditions, and the discipline of recognizing which regime is actually in play before applying any single setup. A trader who only knows how to fade extensions will eventually apply that instinct to a real trend and get walked along the band the hard way.
The Bollinger Basis, VWAP, and anchored VWAP anchors covered above each require a working knowledge of moving averages and the underlying oscillators — RSI, MACD, and Bollinger Bands covers those fundamentals for anyone who needs a refresher before applying the tighter rules in this guide. For the related market-condition playbooks this setup complements — range trading, chop, and low-volume conditions — the Strategies Hub organizes the full library by market regime.
Frequently Asked Questions About Mean Reversion Trading
How is mean reversion different from fading a horizontal support or resistance level?
A stock pulling back sharply below a rising moving average during an uptrend is a mean-reversion setup, not a range trade — there's no horizontal boundary involved, just distance from a sloped average. Range trading, by contrast, requires the stock to actually be moving sideways between two fixed levels.
Key Takeaway: Mean reversion can appear inside a trend; range trading specifically requires the trend's absence.
Does academic research on mean reversion actually apply to intraday trading?
Treating a monthly academic finding as if it guarantees a specific outcome on an individual intraday trade overstates what the research actually shows. The honest takeaway is that short-term overreaction is a real, documented phenomenon in markets generally, not that any single 2-standard-deviation intraday extension carries a known statistical edge.
Key Takeaway: Use the academic literature to justify the concept, not to promise a specific win rate on any individual trade.
Why does a confirmed earnings catalyst invalidate a mean reversion setup?
Fading a catalyst-driven move on the assumption that it's an overreaction is a fundamentally different (and much riskier) bet than fading a move with no identifiable cause. The setup's Market Conditions Required row exists specifically to screen out catalyst-driven extensions before they're mistaken for statistical noise.
Key Takeaway: Confirm the absence of a scheduled catalyst before treating any extension as a reversion candidate.
What does "walking the band" mean, and why is it the biggest risk to this setup?
Fading the first touch of a band in this condition often works, but fading the second or third touch during a genuine trend is fighting the market's actual direction. Rising ADX alongside repeated band touches is the clearest sign that a stock is walking the band rather than overextending.
Key Takeaway: Rising ADX alongside a band touch signals a trend, not an overreaction — stop fading and reassess.
Why use RSI alongside Bollinger Bands instead of the bands alone?
A band touch alone can occur during normal volatility expansion without representing a genuine statistical outlier in momentum terms. Requiring RSI above 70 or below 30 at the same time adds a second, differently-calculated signal that has to agree before the setup qualifies.
Key Takeaway: Two independent measures agreeing on overextension is more reliable than one measure alone.
How should the profit target change between a genuinely range-bound tape and a trending one?
Extending the target to the opposite band assumes the stock will oscillate rather than continue trending, which is a reasonable assumption only when the broader market context supports it. Applying that same assumption during a trend risks giving back the gain already captured at the mean.
Key Takeaway: Confirm the broader regime before deciding whether to hold past the mean for a bigger target.
Which anchor — the 20-period SMA, VWAP, or anchored VWAP — should be used for a given trade?
Each anchor answers a related but distinct question, and using the wrong one can produce a misleading read. A stock that looks extended relative to VWAP might not be extended relative to its 20-period SMA if the two have diverged for a structural reason, such as a recent gap.
Key Takeaway: Match the anchor to the specific question being asked about the stock's current price relative to its history.
Why are low-float and single-catalyst biotech stocks excluded from this setup?
The setup's statistical logic depends on the extension lacking a clear informational cause. Low-float and event-driven biotech names extend sharply on news far more often than on pure order-flow pressure, which undermines the core assumption the setup is built on.
Key Takeaway: Reserve this setup for liquid names where an extension without news is genuinely unusual, not routine.
What ADX reading actually distinguishes a genuine overreaction from the start of a trend?
ADX measures trend strength independent of direction, and checking it at the moment of the extension — not just before it — catches situations where the extension itself is the start of a strengthening trend rather than an isolated event.
Key Takeaway: Check ADX at the extension itself, not just on the days leading up to it, to catch a trend forming in real time.
How many mean-reversion trades is it realistic to find in a single session?
Because the setup requires several conditions to align at once, qualifying extensions are inherently less frequent than simple band touches. Treating every band touch as tradeable inflates the number of "setups" while diluting their actual quality.
Key Takeaway: A short list of genuinely qualifying setups is the expected, healthy outcome — not a sign the strategy isn't working.
What win rate should realistically be expected from a setup like this?
Mean-reversion setups in general tend to win more often than they lose, precisely because the target (the mean) is typically closer than the stop (beyond the extension), but a higher win rate on smaller average wins isn't automatically better than a lower win rate on larger ones. What matters is the combination of win rate and the size of wins versus losses, not either number in isolation.
Key Takeaway: Judge the setup by its expectancy — win rate combined with average win and loss size — rather than chasing a single headline win-rate figure.
Disclaimer
Article Sources
- Bollinger Bands — StockCharts ChartSchool - explains the construction of Bollinger Bands and John Bollinger's own guidance on standard deviation settings.chartschool.stockcharts.com
- %B Indicator — StockCharts ChartSchool - documents the "walking the band" behavior seen in strong trends, referenced in the failure-mode section above.chartschool.stockcharts.com
- Jegadeesh, N. (1990). "Evidence of Predictable Behavior of Security Returns." Journal of Finance, 45(3), 881–898. — the foundational academic study documenting short-term reversal in individual stock returns.
- What Are Bollinger Bands? — Fidelity - a practical overview of Bollinger Band construction and standard parameter settings.fidelity.com