
How to Make Money When the Market is Choppy: A Range Trading Playbook

In this article10 sections
A stock chops sideways for an hour. A trader watches it, gets bored, and buys somewhere in the middle just to be doing something. Ten minutes later it's still going nowhere and the position is underwater for no good reason. That single habit — entering in the middle of a box instead of at its edges — is responsible for more wasted trades in choppy conditions than any bad indicator or bad setup ever could be.
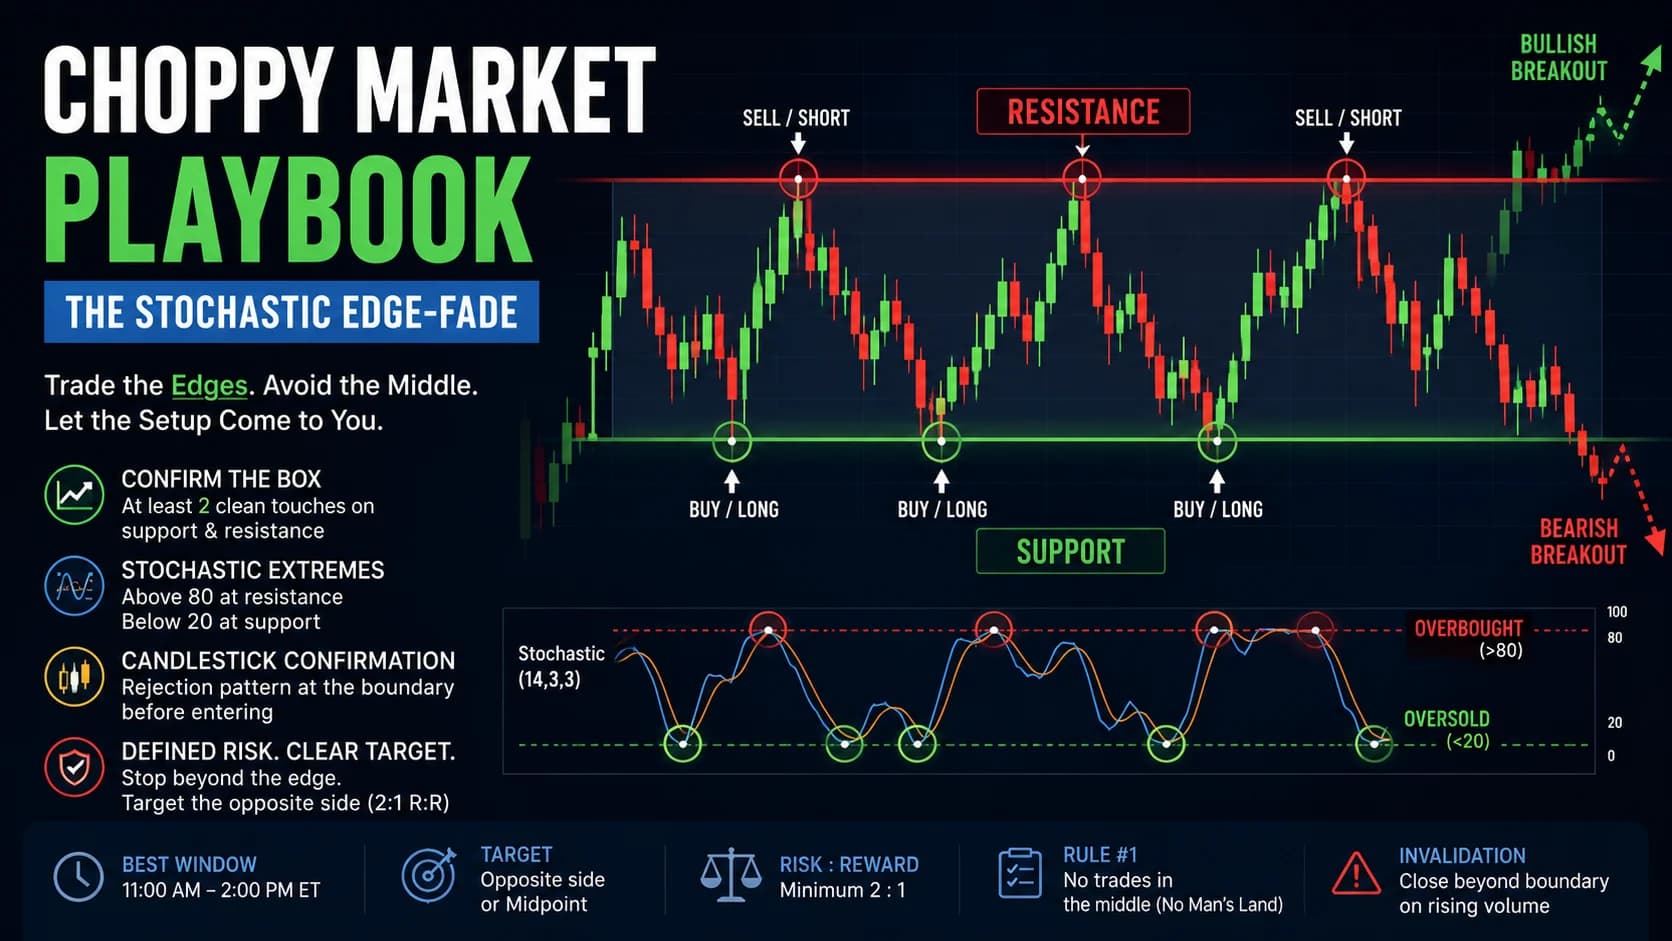
What is this range trading playbook? This playbook is a tactical, execution-focused system for trading choppy, sideways markets: confirm a clean price box, use the Stochastic Oscillator to time entries at the extremes rather than the middle, wait for candlestick confirmation before acting, and define risk and reward before the trade goes on. It's built specifically for the discipline problem that wrecks most chop trades — acting too early, in the wrong place, out of impatience.
Why "No Man's Land" Is Where Most Chop Trades Go Wrong
Every choppy market has a middle zone and two edges. The middle is where price spends most of its time, and it's also where trades have the worst possible risk profile — a stop and a target that are roughly the same distance away, with no statistical edge favoring either direction. Traders end up here constantly anyway, because waiting for price to reach an actual edge requires sitting on hands through stretches of nothing happening, which is a genuinely uncomfortable way to spend screen time.
The fix isn't a better indicator. It's a rule: no trade gets considered unless price is at or very near one of the box's two boundaries. That single constraint eliminates the majority of low-quality chop trades before any indicator or candlestick pattern even enters the picture.
This guide's broader breakdown of range-bound conditions covers the full identification toolkit — ADX, Bollinger Bands, the academic case for mean reversion. This playbook assumes that foundation and focuses specifically on the tactical execution problem: given a confirmed box, how do you actually time an entry at the edge without either jumping the gun or missing it.
Building the Box: What Counts as a Tradeable Range
The box needs at least two clean touches on both the support side and the resistance side before it's worth trading — a single touch on either side is a guess, not a confirmed level. Draw the two horizontal lines once the box is confirmed, and treat everything between them as territory to avoid, not to trade.
If the boundaries require squinting or forcing the lines to fit, the box isn't clean enough yet. Move on and check back later, or find a different candidate. A box that's obvious within a few seconds of looking at the chart is the only kind worth building a trade around.
A box doesn't need to be perfectly rectangular to qualify — minor overshoots on either side, especially brief wicks that immediately reverse, don't invalidate an otherwise clean range. What matters more than geometric precision is whether the same two general price zones keep attracting reversals over multiple attempts. A box that's slowly drifting — where each new touch of support sits a bit higher than the last — is worth watching closely, since that kind of gentle upward or downward drift inside an otherwise bounded range can be an early tell that the box is quietly turning into a trend before the boundaries actually break.
The Stochastic Edge-Fade Playbook (Setup Specification)
Every component below is a hard rule. The entry never fires on proximity to a boundary alone — it requires both an oscillator extreme and a candlestick rejection at that boundary.
- Component
- Market Conditions Required
- Rule
- A confirmed box with at least 2 clean touches on both support and resistance; no major catalyst scheduled that could shatter the range without warning
- Component
- Time of Day
- Rule
- Workable throughout the session; the 11:00 AM–2:00 PM ET midday lull is the single most reliable daily window for this specific setup
- Component
- Stock Selection Criteria
- Rule
- Liquid stock or ETF with a clearly bounded price channel and no recent history of violent, catalyst-driven moves
- Component
- Entry Trigger
- Rule
- Stochastic Oscillator above 80 (at resistance) or below 20 (at support), combined with a candlestick rejection pattern at that boundary; entry beyond the rejection candle's high (short) or low (long)
- Component
- Stop Loss
- Rule
- Just beyond the boundary's most recent extreme — below the lowest low at support, above the highest high at resistance
- Component
- Initial Profit Target
- Rule
- The opposite side of the box for a minimum 2:1 reward-to-risk; the box's midpoint for a more conservative, higher-probability exit
- Component
- Trade Management
- Rule
- No trade taken in the middle of the box under any circumstance; scale a portion at the midpoint if targeting the full width
- Component
- Invalidation Criteria
- Rule
- A full candle body closes decisively beyond either boundary on rising volume; the trade is over regardless of how the position is currently performing
| Component | Rule |
|---|---|
| Market Conditions Required | A confirmed box with at least 2 clean touches on both support and resistance; no major catalyst scheduled that could shatter the range without warning |
| Time of Day | Workable throughout the session; the 11:00 AM–2:00 PM ET midday lull is the single most reliable daily window for this specific setup |
| Stock Selection Criteria | Liquid stock or ETF with a clearly bounded price channel and no recent history of violent, catalyst-driven moves |
| Entry Trigger | Stochastic Oscillator above 80 (at resistance) or below 20 (at support), combined with a candlestick rejection pattern at that boundary; entry beyond the rejection candle's high (short) or low (long) |
| Stop Loss | Just beyond the boundary's most recent extreme — below the lowest low at support, above the highest high at resistance |
| Initial Profit Target | The opposite side of the box for a minimum 2:1 reward-to-risk; the box's midpoint for a more conservative, higher-probability exit |
| Trade Management | No trade taken in the middle of the box under any circumstance; scale a portion at the midpoint if targeting the full width |
| Invalidation Criteria | A full candle body closes decisively beyond either boundary on rising volume; the trade is over regardless of how the position is currently performing |
The Stochastic Oscillator was built for exactly this job. Developed by George Lane in the late 1950s, it measures where a security's most recent close sits relative to its own high-low range over a set lookback — readings above 80 mean price is closing near the top of that range, readings below 20 mean it's closing near the bottom. Lane's own description of the tool was that momentum changes direction before price does, which is precisely the early-warning behavior this playbook is trying to catch at each boundary.
Candlestick confirmation exists for the same reason it does in every other setup in this guide: touching a level proves nothing on its own. At resistance, a shooting star or bearish engulfing candle is the signal sellers are actually stepping in. At support, a hammer or bullish engulfing candle is the mirror signal for buyers. This guide's introduction to candlestick charts covers the mechanics of reading these patterns in more depth.
Walk-Through Example: Fading the Box in a Consolidating Retailer
Consider a hypothetical mid-cap retail stock — call it VWX, which has spent the past three weeks contained between $62 and $68 with no clear directional bias.
Confirming the box: VWX has touched $68 three times without closing above it, and touched $62 twice without closing below it. The box qualifies.
The setup at resistance: VWX rallies back to $67.80. The Stochastic Oscillator reads 86 — solidly overbought. A shooting star candle forms, closing at $66.90 with a low of $66.50.
Execution: The entry is a sell-stop at $66.40, ten cents below the shooting star's low. The stop-loss goes at $68.20, just above the recent $68 high — a risk of $1.80 per share. The midpoint target near $65 offers a conservative exit; the full-width target at $62 offers roughly $4.40 of reward against $1.80 of risk, comfortably above this guide's 2:1 minimum.
What happens next: VWX triggers the entry, works down through $65, and continues to $62.30 before stabilizing. A trader following the plan would have scaled a portion near $65 and trailed the rest toward $62, watching for the mirror setup — an oversold Stochastic reading plus a bullish rejection candle — before considering the long side of the same box.
A contrasting example worth keeping in mind: if VWX had instead tagged $67.80 with the Stochastic reading only 58 — nowhere near overbought — and no real rejection candle formed, this playbook has no trade to offer there, even if the price is sitting right at the boundary. Proximity to the edge is necessary but not sufficient; both the oscillator extreme and the candlestick confirmation have to show up together before an entry is justified. This guide's risk/reward ratio guide covers the underlying math behind why a 2:1 minimum matters even on setups that look tempting without it — a strategy that only wins half the time still needs a real edge in its average win size to be worth trading at all.
When the Stochastic Lies: Trending Markets and the Stochastic Pop
The single biggest honest limitation of this playbook is what happens when the "range" quietly stops being a range. In a genuine trend, the Stochastic Oscillator can stay pinned above 80 or below 20 for an extended stretch — a phenomenon Lane himself referred to informally as a "stochastic pop." A trader fading every overbought reading during a real uptrend gets run over repeatedly, since the oscillator is doing exactly what it's supposed to do (reflecting strong, one-directional momentum) rather than signaling an actual reversal.
The defense against this is checking the broader condition of the box before trusting any single Stochastic reading — if price is making new highs beyond the established boundary rather than rejecting at it, the box itself may already be over, and the oscillator's extreme reading is confirming a trend, not warning of a reversal.
This playbook also assumes a genuinely liquid, clean box. Thin, illiquid names can produce Stochastic extremes on almost no real volume, which carries none of the informational value a reading on a properly traded stock does.

Trading the Box During the Midday Lull
The single best recurring window for this setup is the stretch between roughly 11:00 AM and 2:00 PM ET, when overall market participation drops and many stocks settle into exactly the kind of contained, two-sided action this playbook is built for. This guide's dedicated playbook for the midday chop covers that specific window in more depth, including how it fits alongside the more volatile morning and closing sessions.
Outside that window, the same rules still apply — a clean box can form and hold at any hour — but the midday stretch is where a trader is statistically most likely to find one without having to search extensively.
Recognizing When the Box Has Actually Broken
No range lasts indefinitely. When price closes decisively beyond a boundary — a full candle body outside the box, ideally with a real increase in volume — the box is over, and the correct response is immediate: honor the stop without negotiation, and do not initiate a fresh fade against the direction of the break.
False breaks are common enough to be worth naming: price occasionally pokes beyond a boundary, triggers stops, and snaps right back inside. The distinction between a false break and a genuine one comes down largely to volume and whether the candle actually closes outside the box rather than merely wicking through it. When in doubt, the safer assumption is that a decisive close means the range is done, not that it's a temporary poke to be faded.
Scanning for Tight, Tradeable Boxes
Finding clean, well-bounded stocks manually across a full watchlist is slow. Trade Ideas can build custom scans for stocks trading within a tight percentage range over a chosen lookback — 10, 20, or 50 days — which surfaces candidates automatically rather than requiring a manual scroll through charts. TradingView and Finviz both work well for visually confirming a scanned candidate's box and plotting the Stochastic Oscillator alongside price before committing to a trade.
Turning Frustration Into a Repeatable Routine
The traders who do well with this playbook treat choppy conditions as a specific, tradeable regime with its own rules rather than as a frustrating absence of opportunity. That reframing only works if the discipline actually holds — waiting for the edge, requiring both an oscillator extreme and a candlestick confirmation, and refusing to enter in the middle out of boredom. This guide's breakdown of developing patience and objectivity covers why that kind of waiting is a trainable skill rather than a fixed trait, which matters here more than almost anywhere else in this guide's library. For the complete set of range and mean-reversion frameworks this playbook builds on, the Strategies hub breaks down the full library by market regime.
Frequently Asked Questions
Why is entering in the middle of a range considered the biggest mistake?
At the edges of a confirmed range, the trade has a defined reason to expect a reversal — an oscillator extreme plus a rejection candle. In the middle, none of that evidence exists, and the trade is essentially a coin flip with transaction costs attached. This is why the single hardest-working rule in this playbook is simply refusing to act until price reaches an actual boundary.
Key Takeaway: No edge exists in the middle of a box — the entire trade thesis depends on being at the extremes.
Why use the Stochastic Oscillator instead of RSI for this playbook?
RSI and Stochastic are both legitimate choices, and neither is objectively superior across all conditions. This guide's broader range-trading framework covers RSI in more depth; this playbook standardizes on Stochastic specifically to keep the entry rule consistent and mechanical.
Key Takeaway: Either oscillator can work — what matters is picking one and applying its thresholds consistently.
What is a "Stochastic Pop" and why does it matter?
This is the playbook's single biggest failure mode: fading every overbought or oversold reading without checking whether the broader box is actually still intact. If price is closing beyond the established boundary rather than rejecting at it, the pinned oscillator reading is confirming a trend, not warning of a reversal.
Key Takeaway: A Stochastic extreme means something different in a real range than it does in a real trend — check which one you're actually in.
How is this playbook different from a general range-trading strategy?
Think of the broader article as answering "is this a genuine range worth trading," and this playbook as answering "given a confirmed range, exactly when and how do I pull the trigger." Both are meant to be used together rather than as competing systems.
Key Takeaway: The broader guide identifies the range; this playbook times the entry inside it.
Why does the midday lull work so well for this setup?
This isn't the only window where a clean box can form, but it's the most statistically reliable recurring stretch of the day to find one without extensive searching, since lower participation broadly favors consolidation over sustained directional moves.
Key Takeaway: The midday lull doesn't create this setup, but it makes finding a qualifying one considerably easier.
What separates a false breakout from a real one?
Waiting for the candle to actually close outside the range, rather than reacting to an intraday poke through the level, filters out a meaningful share of false signals. When volume doesn't confirm the move, extra skepticism is warranted regardless of how convincing the price action looks in the moment.
Key Takeaway: A close outside the box with real volume behind it is a break; a wick through it on weak volume usually isn't.
Can this playbook be applied on any timeframe?
What changes across timeframes is simply the patience required to see a full box develop and the position-holding period that follows. The entry and risk-management mechanics stay identical regardless of which chart the box appears on.
Key Takeaway: The playbook's rules are timeframe-agnostic; only the holding period changes.
Is a 2:1 reward-to-risk always achievable in this playbook?
Because the box's own width caps how far a trade can realistically run, forcing a 2:1 target that the range's actual dimensions don't support usually just means placing an unrealistic stop instead. It's better to pass on a marginal setup than to distort the risk parameters to make the math work on paper.
Key Takeaway: Let the box's real width determine the target — don't force a ratio the range can't actually support.
What if a stock is drifting slightly rather than holding a flat box?
A perfectly flat, rectangular box is the cleanest version of this setup, but minor drift doesn't automatically disqualify a range. The distinction worth watching for is whether the drift is gradual and still respecting both general zones, versus a genuine break where price stops reversing at either boundary altogether.
Key Takeaway: Minor drift inside a box is normal; a consistent directional creep across multiple cycles is an early warning sign, not noise to ignore.
Disclaimer
Article Sources
- StockCharts ChartSchool: Stochastic Oscillator - reference for the standard Stochastic Oscillator calculation and George Lane's original methodology.
- Investopedia: Range-Bound Trading - reference for the standard definition of range-bound trading and confirmation methods.
- Fidelity: What Is Range Trading? - reference for risk considerations and volume-based breakout validation.
- Investopedia: Breakout - reference for standard technical-analysis conventions distinguishing genuine breakouts from false ones.
Was this helpful?
Be the first to weigh in

Written by
Kazi Mezanur RahmanFounder, independent researcher, and editor of DayTradingToolkit. A one-person publication focused on risk-first trading education and documented tool research. He trades his own capital as a retail trader and combines personal market experience with systematic primary-source research.
Keep Reading
Strategies
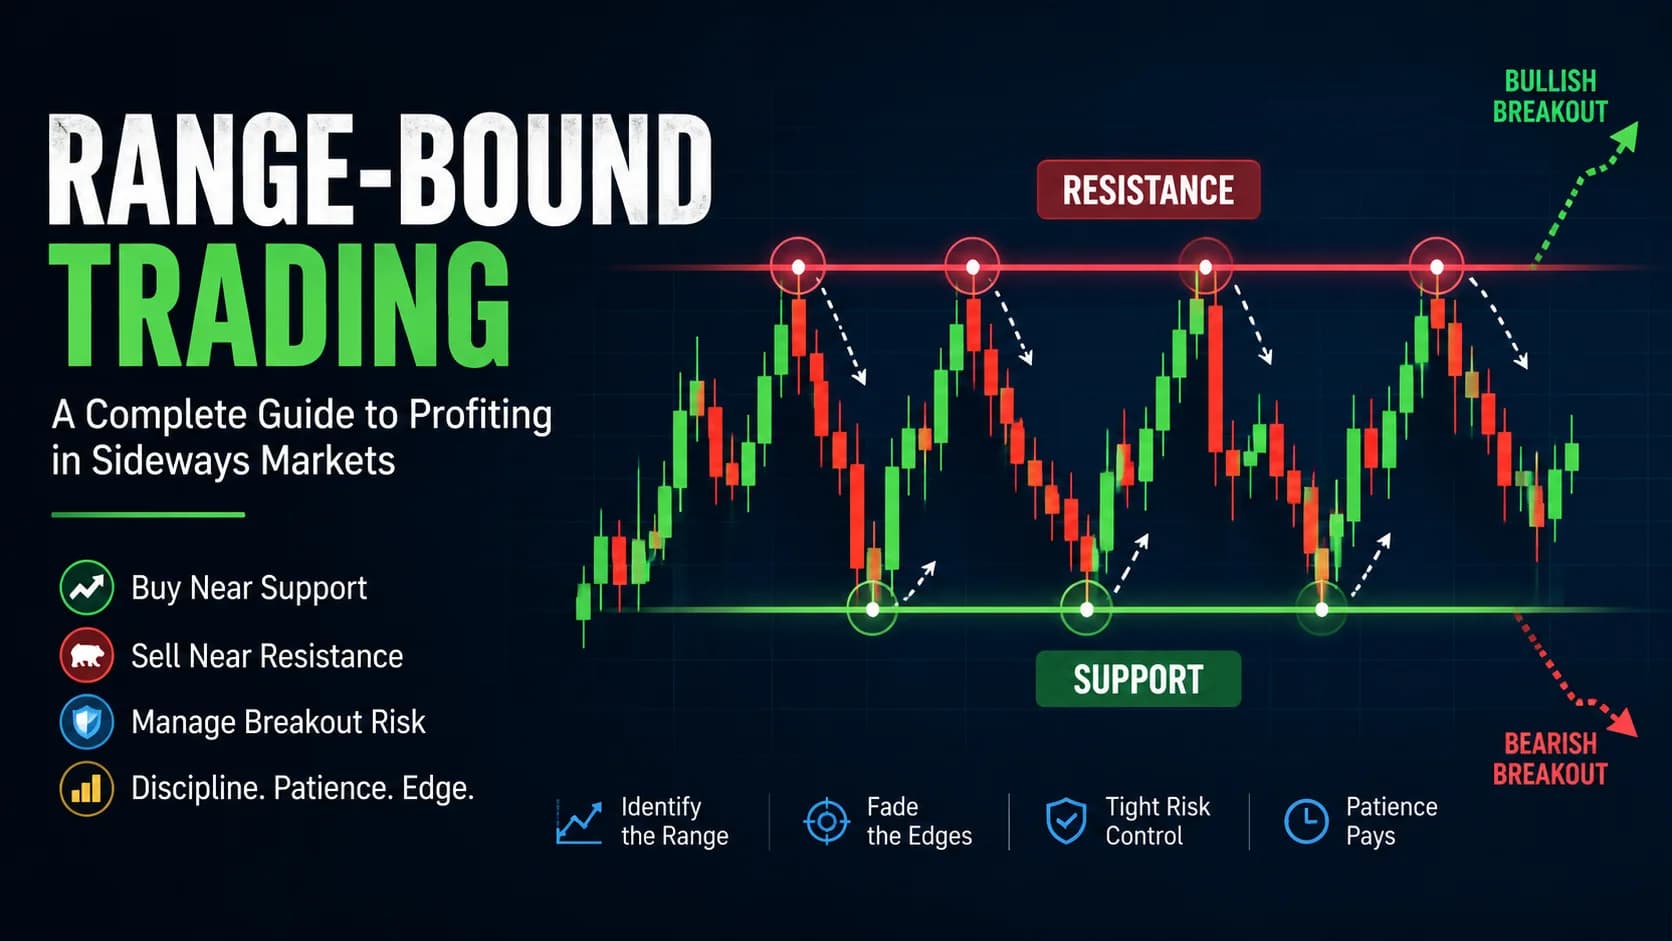
Range-Bound Trading: A Complete Sideways Market Guide
Learn range-bound trading strategies for sideways markets — how to identify a genuine range, fade the edges with confirmation, and manage the breakout risk.
Strategies
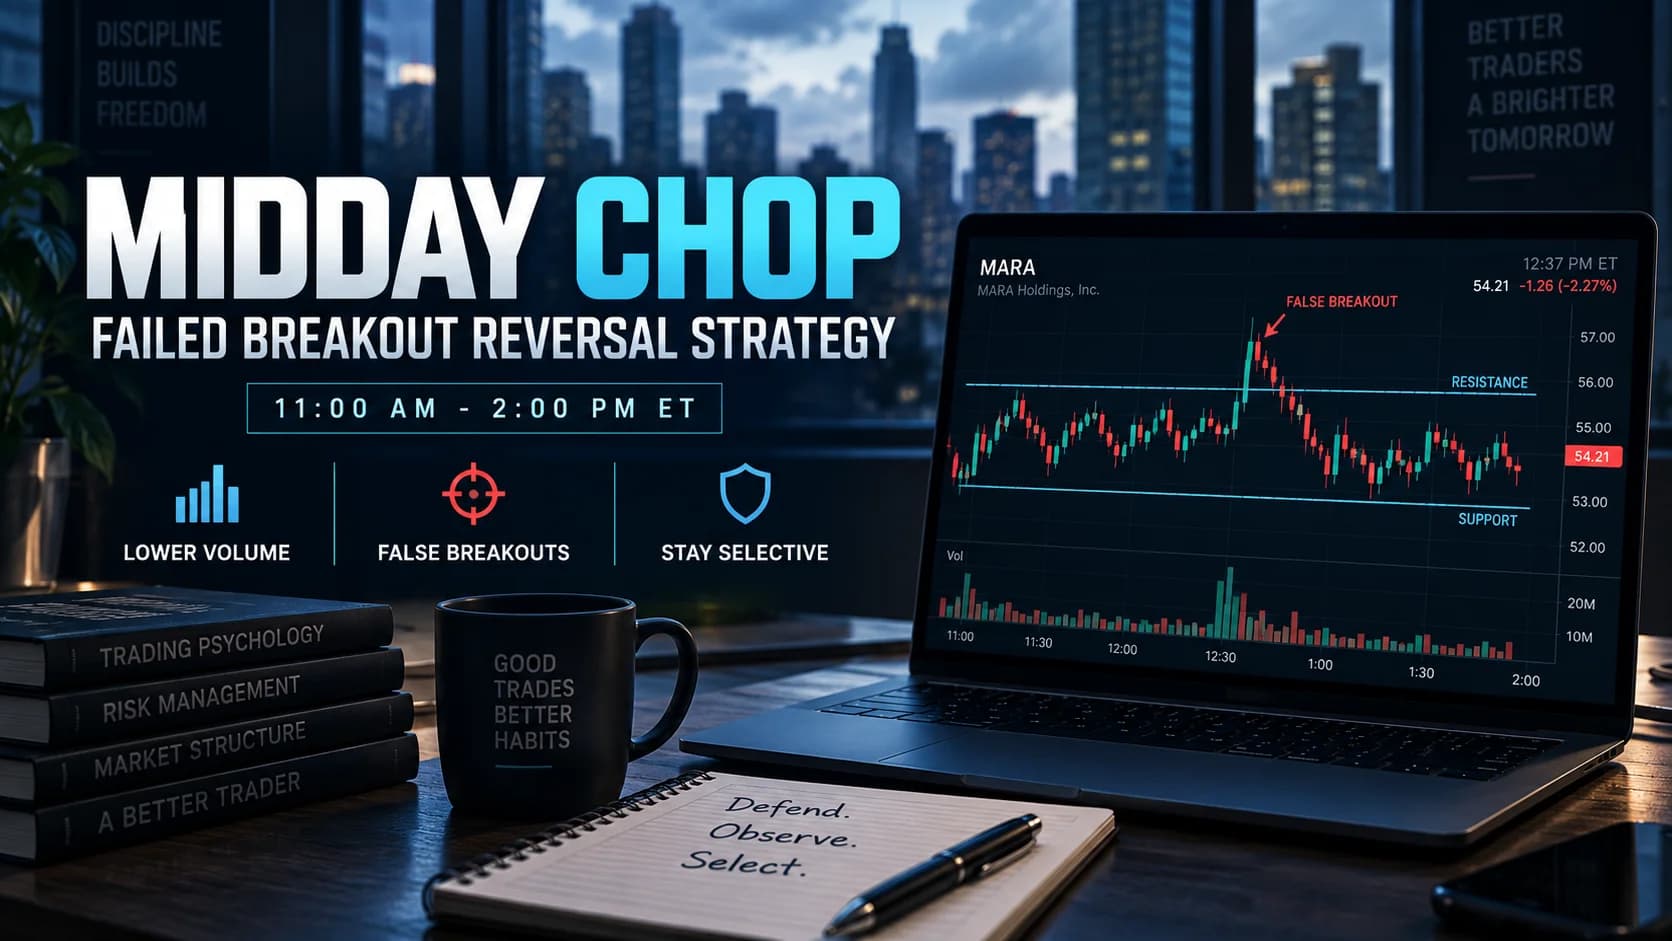
The Trader's Playbook: How to Day Trade the Midday Chop (11 AM - 2 PM)
Stop giving back morning profits. This playbook covers why volume disappears from 11 AM to 2 PM, the failed-breakout fade setup built for it, and how to use the lull to prepare for the close.

Strategies
Trading the Breakout of Prior-Day High/Low Levels
PDH and PDL need no formula, just yesterday's range. This guide covers the breakout, the liquidity-sweep fade, and why stops cluster right at these levels.
Strategies
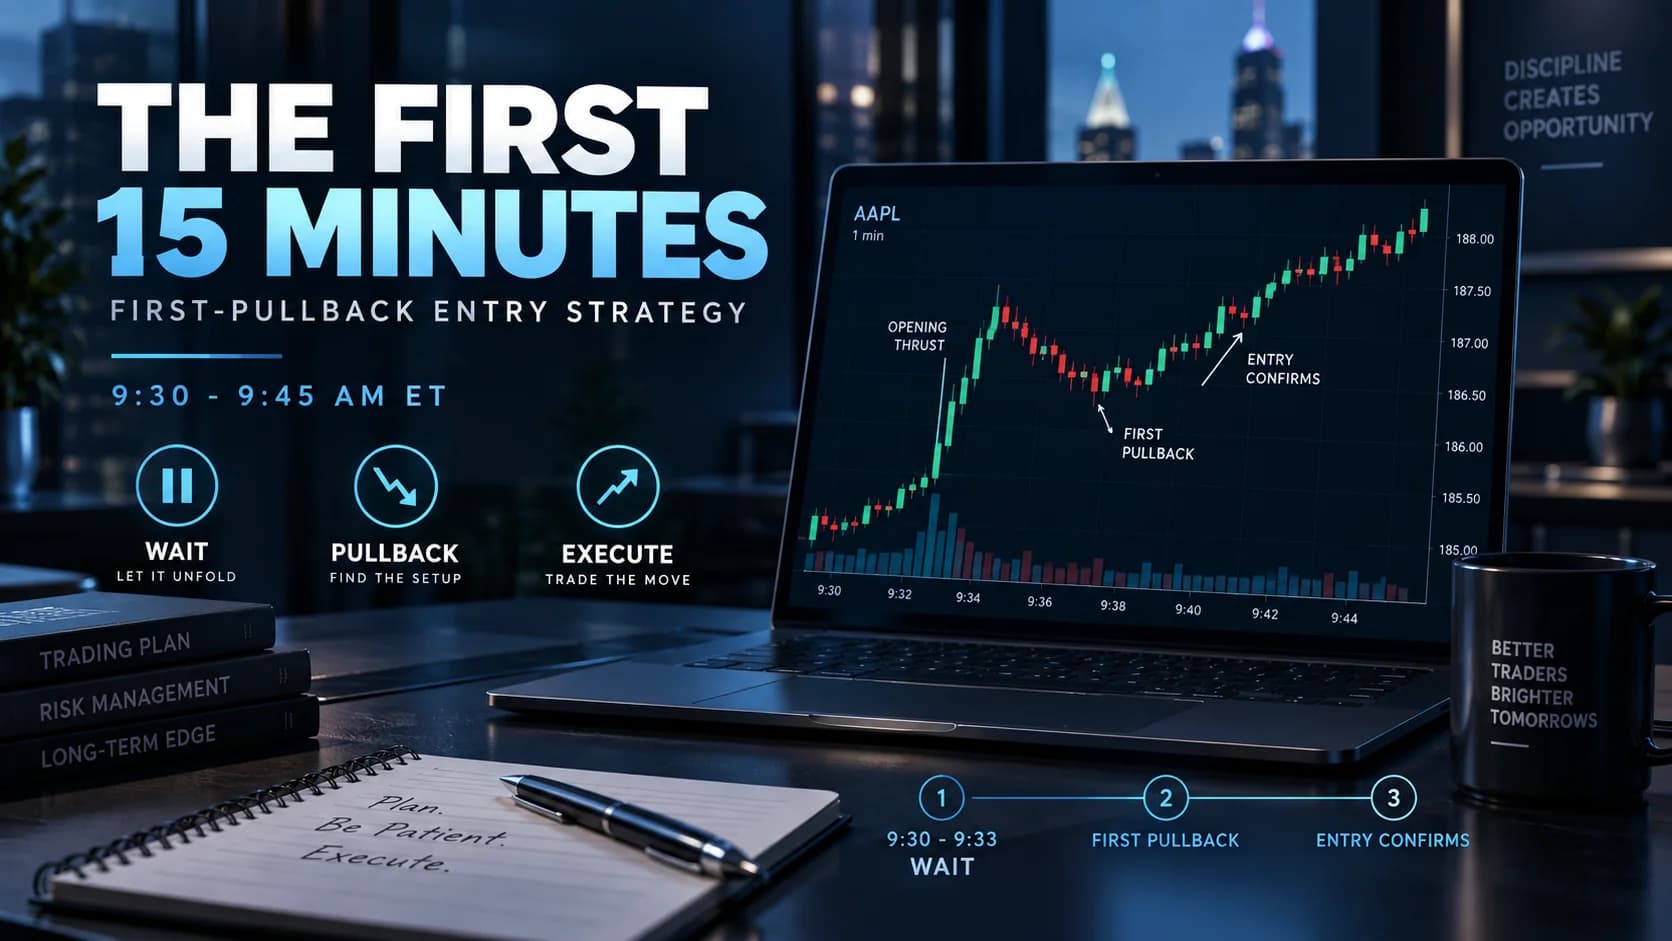
The Trader's Playbook: How to Day Trade the First 15 Minutes
The opening auction leaves an imbalance that takes a few minutes to resolve. This playbook covers what's structurally different about the first 15 minutes and the one pullback setup built around it.
Comments
No comments yet. Be the first to share your thoughts.