
The Trader's Playbook: How to Day Trade the Midday Chop (11 AM - 2 PM)

In this article10 sections
The opening bell was clean. Two solid trades landed, the account is up a few hundred dollars, and everything feels like it's working. Then 11:00 AM ET arrives, the trends flatten into a directionless grind, and a setup that looked perfect a minute ago reverses the instant it triggers. A small loss becomes two. By 2:00 PM, the morning's gain is gone, and the account is red.
That's the midday chop, and it isn't a personal failure of skill. It's a predictable, recurring feature of how liquidity moves through the trading day, and the traders who handle it well aren't finding secret setups that work in the chop. They're mostly doing less, on purpose, and doing it with a plan built before 11:00 AM rather than improvised in the middle of it.
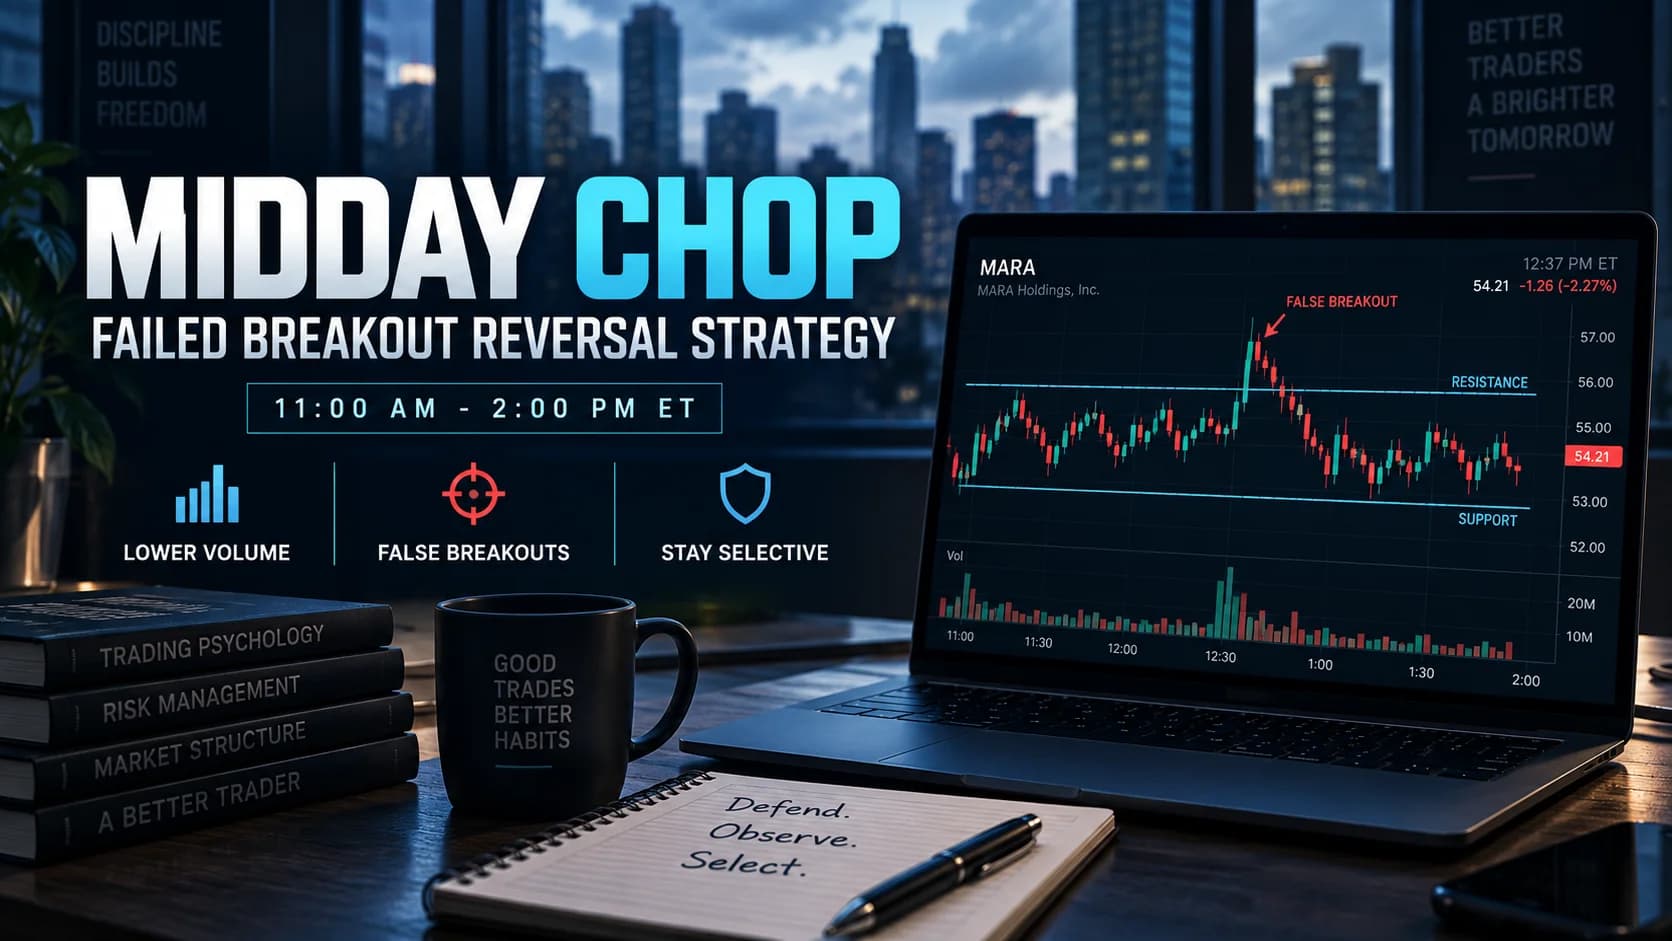
What is the midday chop? The midday chop refers to the period, roughly 11:00 AM to 2:00 PM ET, when trading volume drops sharply from its morning highs, producing sideways, directionless price action, more false breakouts, and less reliable trend continuation than either the opening hour or the final hour of the session.
Why Institutional Volume Disappears Between 11 AM and 2 PM
The market's personality genuinely changes at midday, and the reason is structural, not psychological. The large institutional orders that drive clean, sustained trends in the morning are mostly done executing by late morning, and the desks that placed them slow down until the afternoon's rebalancing and close-of-day flows pick back up.
With less real, size-backed order flow in the market, the balance of who's trading shifts toward shorter-horizon and algorithmic participants. That mix produces a specific texture: sharp little pokes above resistance or below support that reject almost immediately, rather than the sustained follow-through a morning breakout tends to show. It isn't that midday moves are smaller everywhere; it's that the participants driving them have different, often shorter-term motives than the size-driven flow of the first hour.
This pattern shows up reliably enough in market data that it has a name in the academic literature: intraday volume and volatility trace a U-shape across the session, elevated at the open, at their lowest in the late morning and early afternoon, elevated again into the close. That's the mechanical explanation behind a feeling every active trader eventually notices on their own.
The Capital-Preservation Mindset: Defend, Observe, Select
The single biggest adjustment for the midday session isn't a new setup. It's treating the period as a time to not lose money rather than a time to make it, and building that decision into a plan before the grind actually starts.
Defend the morning's gains. A simple rule works better than a vague intention: decide, before the session even opens, on a give-back limit tied to any profit already banked. Up $500 by 11:00 AM might mean not letting the day's total drop below $250. Position size should shrink too, a fraction of the morning's size is usually appropriate if any trading happens at all during this window, since the same-sized loss lands harder against thinner, choppier follow-through.
Observe more than participate. The midday lull is a legitimately useful stretch of dead time, not wasted time. It's the natural window to review the morning's trades while the reasoning behind each one is still fresh, and to build the watchlist for the session's next high-volume stretch rather than staring at a directionless chart hoping something develops. Forcing a trade in a low-probability window is one of the more consistently costly habits a developing trader can fall into.
Get selective, not idle. Trading the chop entirely is a reasonable choice for a lot of traders, and often the right one. For those who want to stay engaged, the setups worth taking in this window are narrower and more specific than the ones that work during the trending hours, which is what the rest of this playbook covers.

The Failed Breakout Reversal Setup Specification
The core midday setup fades exactly the kind of move the low-volume environment tends to produce: a break of a level that looks clean on the surface but isn't backed by real participation.
- Component
- Market Conditions Required
- Rule
- Broad market itself in a low-volatility, range-bound stretch (VIX not spiking, SPY/QQQ not trending hard); time window 11:00 AM to 2:00 PM ET
- Component
- Time of Day
- Rule
- No entries before 11:00 AM ET or after 2:00 PM ET under this specific setup
- Component
- Stock Selection Criteria
- Rule
- Stock that had a real morning trend and established range, now consolidating on visibly reduced volume relative to its own opening-hour pace
- Component
- Entry Trigger
- Rule
- Price breaks a well-defined midday range boundary on volume clearly lighter than the morning average, then closes back inside the range within one to three candles
- Component
- Stop Loss
- Rule
- Just beyond the high (for a short) or low (for a long) of the failed breakout attempt itself
- Component
- Initial Profit Target
- Rule
- The opposite boundary of the established midday range, sized for a minimum 2:1 reward-to-risk
- Component
- Trade Management
- Rule
- Reduced size versus morning trades; no adding to the position if the first target isn't hit within roughly 45 minutes
- Component
- Invalidation Criteria
- Rule
- The "failed" breakout holds and price continues beyond it on rising volume, meaning it wasn't actually a failure
| Component | Rule |
|---|---|
| Market Conditions Required | Broad market itself in a low-volatility, range-bound stretch (VIX not spiking, SPY/QQQ not trending hard); time window 11:00 AM to 2:00 PM ET |
| Time of Day | No entries before 11:00 AM ET or after 2:00 PM ET under this specific setup |
| Stock Selection Criteria | Stock that had a real morning trend and established range, now consolidating on visibly reduced volume relative to its own opening-hour pace |
| Entry Trigger | Price breaks a well-defined midday range boundary on volume clearly lighter than the morning average, then closes back inside the range within one to three candles |
| Stop Loss | Just beyond the high (for a short) or low (for a long) of the failed breakout attempt itself |
| Initial Profit Target | The opposite boundary of the established midday range, sized for a minimum 2:1 reward-to-risk |
| Trade Management | Reduced size versus morning trades; no adding to the position if the first target isn't hit within roughly 45 minutes |
| Invalidation Criteria | The "failed" breakout holds and price continues beyond it on rising volume, meaning it wasn't actually a failure |
The volume comparison in the Entry Trigger is doing the real work in this setup. A break of a level is only meaningfully "failed" if it happened without the participation to sustain it in the first place; a break on volume that matches or exceeds the morning's pace is a real move that happens to be occurring at an unusual time, not a trap.
Case Study: Fading a Failed Midday Breakout in a Crypto Miner
Here's how this setup played out in a real, dated example: Marathon Digital Holdings (MARA) on September 5, 2025.
MARA had a strong morning on crypto-sector strength, running from $20.50 to a high of $22.50 between 9:30 and 10:45 AM on heavy volume. By 11:00 AM, volume dropped off sharply and the stock settled into a range between $21.80 support and the $22.50 morning high as resistance.
At 12:45 PM, a burst of activity pushed MARA to $22.65, just above the morning high, in what looked like a breakout continuation. Three details argued against it: the volume behind the push was a fraction of the morning's pace, the move happened squarely inside the typical low-liquidity window, and the candle printed a long upper wick showing sellers stepping in and rejecting the higher price almost immediately.
That combination is the setup's entry trigger. As MARA dropped back below $22.50, the short entry triggers at $22.45, with a stop at $22.75 (above the rejection wick), for $0.30 of risk per share. The target, the bottom of the midday range at $21.85, sits $0.60 away, a 2:1 reward-to-risk. Over the following 45 minutes, price drifted back down through the range and reached the target, a clean resolution of the exact pattern the setup screens for: a breakout with the volume signature of a trap rather than a genuine move.
The Tight Consolidation Coil: Trading the Pause Instead of the Chop
Not every midday session produces choppy, directionless noise. Occasionally a stock builds a genuinely tight, low-volume sideways range, more of a coil than a chop, that reads as the market pausing to build energy rather than drifting aimlessly.
The distinguishing feature is how orderly the range is: overlapping candles with progressively smaller ranges, volume declining in an orderly way rather than spiking erratically, and price respecting the same boundaries repeatedly rather than probing and failing at random levels. That's a different animal from the failed-breakout setup above, and it calls for a different response: not trading inside the range at all, but marking the boundaries, setting alerts, and waiting for a genuine, volume-confirmed break, typically after 1:30 or 2:00 PM as afternoon participation starts returning. The trade is in the breakout of the coil, not in guessing which direction it resolves ahead of time.
Where Midday Fading Setups Break Down
The failed-breakout setup has a specific, identifiable failure mode: mistaking a real, volume-backed move for a trap simply because of what time it happened to occur. Not every midday breakout is fake, and the volume comparison in the setup spec exists precisely to separate a genuine move from a low-participation head-fake. Fading a breakout that's actually backed by real size is how this setup loses money.
A second failure shows up on days where the broader market itself is trending hard through midday, a strong macro catalyst or a major news event that keeps institutional participation elevated straight through the usual lull. On those days, the U-shaped volume pattern this playbook depends on doesn't show up, and treating an actual trending midday session like a chop session produces exactly backward trades.
A third, quieter failure is oversizing. Because the failed-breakout setup can look clean and confident in hindsight, it's tempting to trade it at full morning size. The lower overall liquidity of this window means the same position size carries more slippage risk on both entry and exit than it would during the higher-volume hours.
Preparing the Afternoon Watchlist While You Wait
The hours spent not forcing trades are genuinely productive when used to prepare for the session's next active stretch. Reviewing the morning's trades while the reasoning is still fresh, checking what actually went right or wrong in the execution, and scanning for stocks building clean patterns for a potential afternoon move all convert dead screen time into real preparation.
Setting price alerts at the boundaries identified during the midday session, rather than watching the chart continuously, also protects the discipline this playbook depends on. It's a concrete, practical way to build the patience a trader needs rather than just being told to have more of it.
Tools for Monitoring Midday Without Staring at the Screen
A scanner or alert system that flags a genuine volume spike against a stock's own recent baseline is more useful during this window than a general gap scanner, since the entire premise of the failed-breakout setup depends on comparing current volume against the morning's pace in real time. Trade Ideas supports building and saving this kind of relative-volume alert, which turns "watching for a fade" into a notification rather than a screen-staring exercise.
How the Midday Chop Fits a Full Trading Day
The midday chop sits between two much higher-opportunity windows: the Golden Hour at the open and the session's final stretch, covered in the market close playbook. Treating the midday hours as preparation time for that closing stretch, rather than a period that has to produce its own profits, changes the entire emotional framing of the session's slowest hours.
The narrowest slice of this window, the hour immediately around lunch in New York, has its own even more specific liquidity dynamics and its own tactical rules, covered separately in this hub's lunch hour playbook.
Midday Trading FAQs
Why does a failed breakout need a volume comparison to the morning average, rather than just a volume drop-off?
A breakout on 40% of the morning's average volume is meaningfully different from one on 90% of it, even though both occur during the "low volume" window. The relative comparison is what actually separates a genuine, if smaller, continuation from a low-participation fake.
Key Takeaway: Always measure midday volume against that stock's own recent pace, never against a flat threshold.
How does the Tight Consolidation Coil differ from ordinary midday chop on the same chart?
The coil is a pause with structure, price respecting the same boundaries repeatedly. Ordinary chop lacks that structure and is better handled by staying out entirely rather than by marking levels and waiting for a breakout.
Key Takeaway: A coil is worth marking and waiting on; unstructured chop usually isn't worth engaging with at all.
What market condition makes the failed-breakout fade setup fail most often?
On those days, the U-shaped volume pattern the setup depends on doesn't materialize, and a breakout that looks midday-typical is actually backed by real participation. Checking the broader market's own volume and trend before fading an individual stock's break is a required step, not optional.
Key Takeaway: Confirm the broader market is actually in a low-volume lull before assuming any single stock's breakout is fake.
Why does this playbook recommend cutting position size specifically during midday, beyond general risk management?
A fill that would be clean at 9:45 AM can slip meaningfully at 12:30 PM on the same stock, simply because there's less resting size on both sides of the book. Reducing size during this window is a liquidity-driven adjustment, not just a general caution.
Key Takeaway: Midday position sizing should account for thinner liquidity, not just lower conviction.
Is there research confirming that trading volume actually drops at midday, or is this just trader folklore?
That research doesn't isolate any specific retail setup's win rate, but it does confirm the structural premise this entire playbook is built on: midday genuinely carries less real order flow than the hours around it, not just less exciting price action.
Key Takeaway: The midday volume dip is a documented market structure feature, not a trading myth.
Should a trader with a losing morning still follow the same capital-preservation rules at midday?
The give-back-limit framing works in reverse too: a stop-loss for the day overall, not just for individual trades, protects against exactly this pattern. Sitting out the chop after a rough morning is not giving up; it's the same discipline this playbook asks for after a good morning.
Key Takeaway: A daily loss limit matters as much during a losing morning as a profit-protection rule does during a winning one.
How many trades should realistically get taken during a typical midday session?
A trader taking five or six midday trades most days is very likely forcing setups that don't actually meet the Setup Specification above. The scarcity of qualifying setups is the point, not a limitation to work around.
Key Takeaway: A quiet midday screen is usually a sign the playbook is being followed correctly, not a sign of missed opportunity.
Does this setup work the same way on index ETFs like SPY or QQQ as it does on individual stocks?
An individual stock can break its usual midday pattern entirely on unexpected news, while a broad index ETF's volume curve is more consistently shaped by the same institutional flow patterns day after day. That makes the failed-breakout setup somewhat more reliable, on average, on index products than on single names.
Key Takeaway: Index ETFs tend to follow the midday volume pattern more consistently than individual stocks do.
Disclaimer
Article Sources
- Chapman University: Revisiting the U-shaped Patterns in Volatility and Price Impacts - research documenting the U-shaped volume and volatility curve that produces the midday liquidity dip this playbook is built around.
- Heston, Korajczyk, Sadka: Intraday Patterns in the Cross-section of Stock Returns - academic research on systematic intraday return patterns across the trading session.
- BIS Working Papers: Through Stormy Seas, How Fragile Is Liquidity - central bank research on how market liquidity can thin out and become fragile under changing participation, relevant background for why lower-volume windows behave differently.
Was this helpful?
Be the first to weigh in

Written by
Kazi Mezanur RahmanFounder, independent researcher, and editor of DayTradingToolkit. A one-person publication focused on risk-first trading education and documented tool research. He trades his own capital as a retail trader and combines personal market experience with systematic primary-source research.
Keep Reading
Strategies
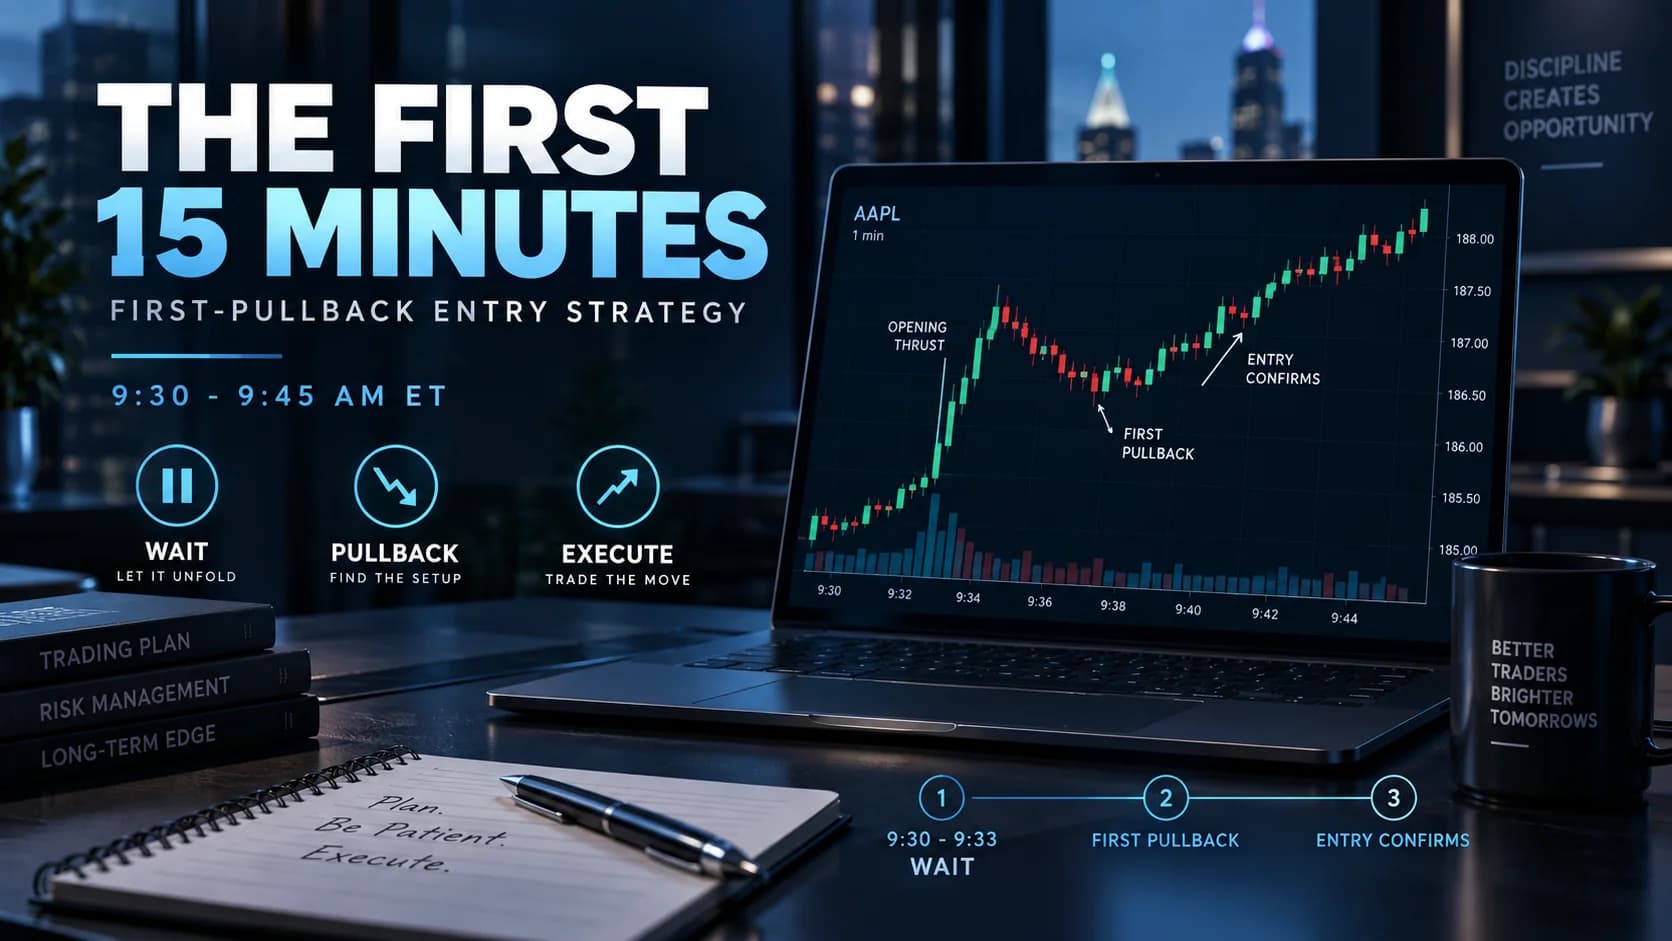
The Trader's Playbook: How to Day Trade the First 15 Minutes
The opening auction leaves an imbalance that takes a few minutes to resolve. This playbook covers what's structurally different about the first 15 minutes and the one pullback setup built around it.

Strategies
The Trader's Playbook: How to Day Trade the Market Open
Master DayTradingToolkit's "Golden Hour" framework for the first 60 minutes of trading, including the Opening Range Breakout setup, its failed-breakout mirror trade, and how to build a pre-market watchlist.

Strategies
The Trader's Playbook: How to Day Trade the Market Close (The Final Hour)
Learn DayTradingToolkit's Power Hour playbook: how to read the day's character, trade the Range Day breakout setup, and why this playbook steps aside before the closing cross.

Strategies
Trading the Breakout of Prior-Day High/Low Levels
PDH and PDL need no formula, just yesterday's range. This guide covers the breakout, the liquidity-sweep fade, and why stops cluster right at these levels.
Comments
No comments yet. Be the first to share your thoughts.