
The Trader's Playbook: How to Day Trade the First 15 Minutes

In this article10 sections
At 9:30:00 AM ET, the first print of the day isn't really a trade in the normal sense. It's the output of an auction, hundreds of buy and sell orders matched against each other in a single instant, and the price that pops onto the screen can be genuinely different from where the stock settles once continuous, two-sided trading actually gets going. Traders who treat that first print like any other candle are reading a signal that isn't fully formed yet.
This is a narrower, more mechanical topic than the broader Golden Hour framework. It's specifically about the first 15 minutes, what's structurally different about them, why the very first one to three minutes are often the worst possible entry window of the entire day, and the one setup this playbook considers genuinely tradable inside that narrow stretch.
What happens in the first 15 minutes of the stock market? The first 15 minutes after 9:30 AM ET open with an auction-driven print that absorbs overnight order imbalance, followed by a short, often volatile stretch where market makers work through that imbalance before two-sided, continuous trading fully takes over. Spreads are typically widest and price the least reliable in the first one to three minutes of this window.
The Opening Print Isn't a Normal Trade
Every regular session begins with an auction, not with the kind of continuous, order-by-order trading that defines the rest of the day. Exchanges collect buy and sell orders through the pre-market session and match them at a single price designed to clear the maximum volume at 9:30:00 AM. That single print, the official open, is what most charting platforms show as the first candle of the day.
The mechanical detail worth understanding is what happens when that auction can't fully balance buyers and sellers, which is common on any stock with real news behind it. An imbalance gets carried into the first seconds of continuous trading, and market makers and other liquidity providers absorb the other side of it. Working through that imbalance is what produces the sharp, sometimes erratic price action in the opening seconds, price action that has more to do with clearing a mechanical backlog than with any actual shift in a stock's value.
Why the First One to Three Minutes Are the Least Tradable Part of the Day
Three structural conditions make the very first minutes different from everything that follows, including the rest of the Golden Hour covered in the market open playbook.
Spreads are at their widest. The same liquidity dynamics that make pre-market spreads wide haven't fully resolved the instant the bell rings; market makers are still working out their post-auction inventory, and that shows up as a wider gap between bid and ask than the same stock will show ten minutes later.
Price can air-pocket. When the auction leaves a real imbalance, the first few prints can move fast in one direction as market makers adjust, then snap back sharply once genuine two-sided liquidity actually shows up. Research on order imbalance and price behavior has found that sharp, imbalance-driven price moves tend to see meaningful reversal once trading normalizes, which is the academic version of a pattern any experienced trader has watched happen at 9:31 AM more mornings than they can count.
Algorithmic execution dominates the tape. A large share of the earliest volume comes from institutional execution algorithms working large orders against the day's volume curve, not from discretionary traders reacting to news in real time. Reading that flow as retail sentiment or a clean directional signal is a common, costly misread.
None of this means the first 15 minutes are unwatchable. It means the earliest seconds of it are a different animal from what follows, and the setup below is built around waiting out exactly that stretch.
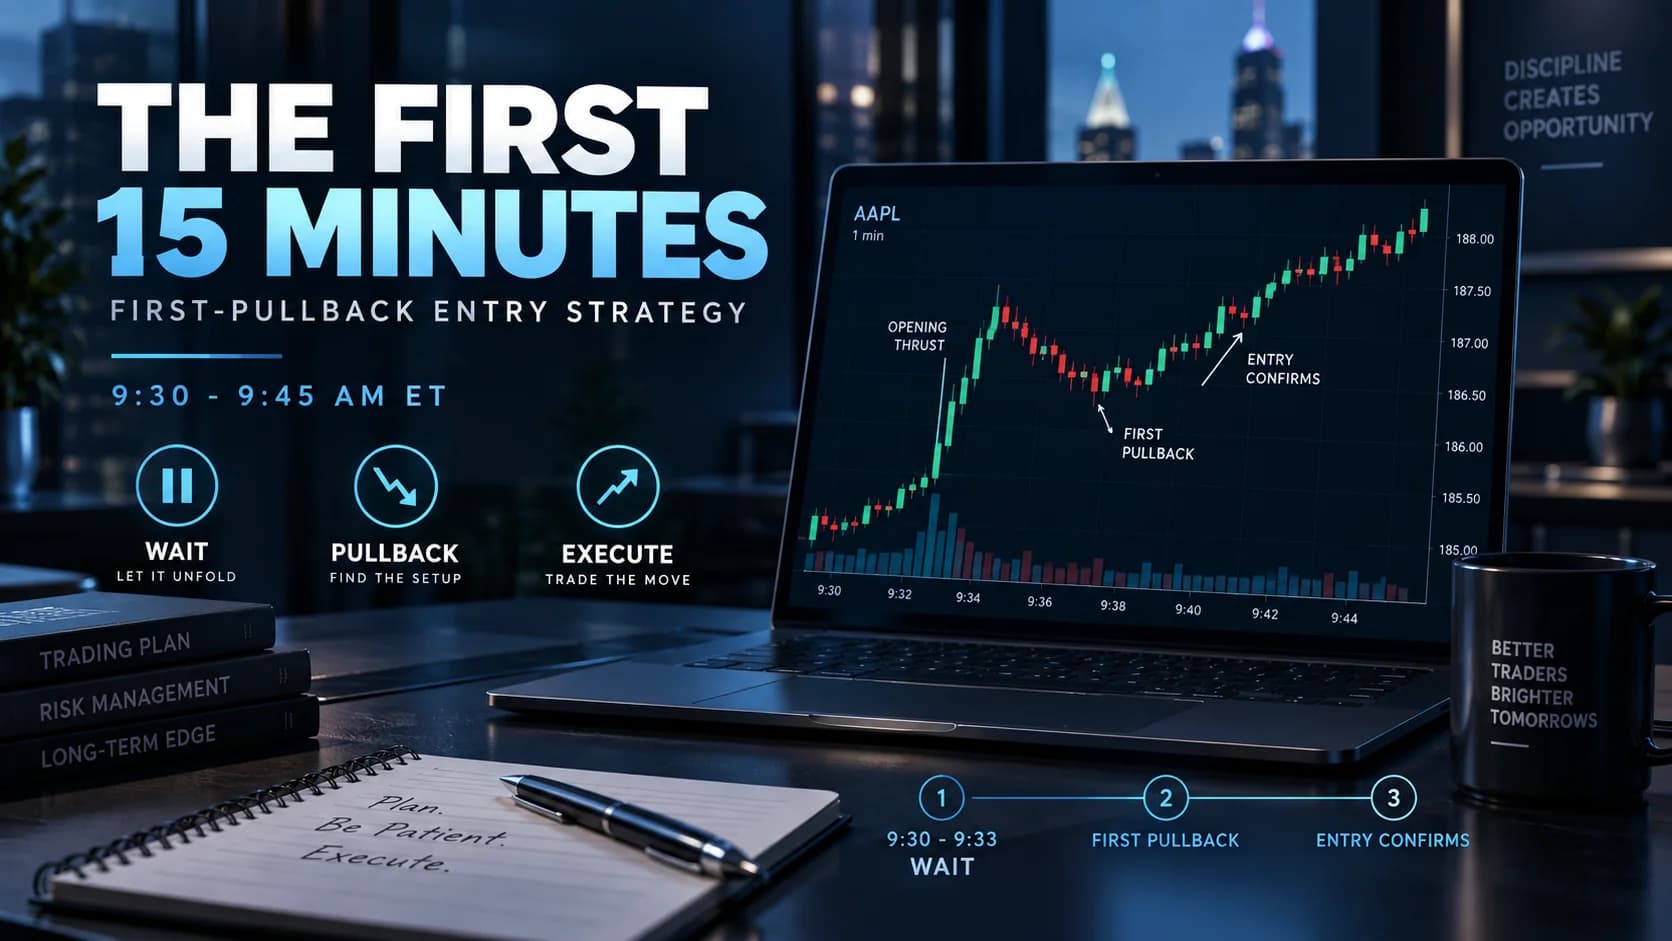
The First-Pullback Entry Setup Specification
Rather than trading the raw opening-range breakout described in DayTradingToolkit's dedicated ORB strategy guide, this playbook's first-15-minute setup waits for the opening imbalance to resolve and trades the first genuine pullback that follows it. That sequencing, imbalance first, then a real two-sided pullback, is what separates this from a standard range breakout.
- Component
- Market Conditions Required
- Rule
- No scheduled economic release in the first 15 minutes; stock showing a clear directional thrust off the open, not a flat, directionless print
- Component
- Time of Day
- Rule
- No entries before 9:33 AM ET, regardless of how clean the setup looks; entries taken through 9:45 AM ET
- Component
- Stock Selection Criteria
- Rule
- Confirmed catalyst, pre-market volume already meeting this playbook's pre-market gapper threshold, spread narrowed to under 0.5% of price by the time of entry
- Component
- Entry Trigger
- Rule
- After an initial directional thrust off the open, price pulls back at least one-third of that thrust's range and then prints a 1-minute close back in the direction of the original thrust
- Component
- Stop Loss
- Rule
- Below the low of the pullback itself, not below the opening print
- Component
- Initial Profit Target
- Rule
- 2:1 reward-to-risk measured from entry to the pullback stop, scaling a portion at 1:1
- Component
- Trade Management
- Rule
- No new entries on this setup after 9:45 AM; from that point, any continuation belongs to the broader Golden Hour framework, not this one
- Component
- Invalidation Criteria
- Rule
- Price fails to hold the pullback low and trades through it before the entry trigger fires, or the spread hasn't narrowed to a tradable level by 9:40 AM
| Component | Rule |
|---|---|
| Market Conditions Required | No scheduled economic release in the first 15 minutes; stock showing a clear directional thrust off the open, not a flat, directionless print |
| Time of Day | No entries before 9:33 AM ET, regardless of how clean the setup looks; entries taken through 9:45 AM ET |
| Stock Selection Criteria | Confirmed catalyst, pre-market volume already meeting this playbook's pre-market gapper threshold, spread narrowed to under 0.5% of price by the time of entry |
| Entry Trigger | After an initial directional thrust off the open, price pulls back at least one-third of that thrust's range and then prints a 1-minute close back in the direction of the original thrust |
| Stop Loss | Below the low of the pullback itself, not below the opening print |
| Initial Profit Target | 2:1 reward-to-risk measured from entry to the pullback stop, scaling a portion at 1:1 |
| Trade Management | No new entries on this setup after 9:45 AM; from that point, any continuation belongs to the broader Golden Hour framework, not this one |
| Invalidation Criteria | Price fails to hold the pullback low and trades through it before the entry trigger fires, or the spread hasn't narrowed to a tradable level by 9:40 AM |
The 9:33 AM floor on entries is the setup's single most important rule, and it's worth stating plainly why it exists: it's a deliberate, mechanical way to sit out exactly the stretch of the session described above, where the opening imbalance is still resolving and the spread hasn't narrowed yet. A trader who can wait three minutes captures nearly all of a genuine move while skipping the part of the session with the worst ratio of noise to signal.
Case Study: Reading the Opening Imbalance Before Taking the Pullback
Picture a mid-cap consumer name, ticker QRS, gapping up on a strong pre-market earnings beat. The stock is a confirmed watchlist candidate: real catalyst, heavy pre-market volume, spread still wide at 9:29 AM as expected.
At 9:30:00, QRS opens at $42.10, up from a $40.00 close, and immediately thrusts to $42.80 in the first ninety seconds on choppy, wide-spread prints, exactly the imbalance-driven action described above. No entry is taken here; the setup spec's 9:33 AM floor rules it out by design.
By 9:34 AM, the spread has narrowed meaningfully and QRS pulls back to $42.35, roughly forty percent of the initial thrust's range, before printing a 1-minute close back above $42.55. That's the trigger. Entry at $42.56, stop at $42.30 (the pullback low), for $0.26 of risk per share. A 2:1 target sits at $43.08, with a partial scale at 1:1 ($42.82).
QRS clears the 1:1 level by 9:39 AM and the 2:1 target by 9:44 AM, having spent its most chaotic ninety seconds doing nothing but working off the opening imbalance, exactly the stretch this setup was built to sit out.
Managing the Trade Once the Pullback Confirms
Because this setup enters later than a raw range breakout would, there's less room for hesitation once the trigger fires. The pullback low is a tight, specific stop, and moving it further away "for more room" defeats the entire purpose of waiting for a confirmed, narrower-risk entry in the first place.
Taking the partial scale at 1:1 matters more here than in a wider setup: because the stop is already tight, the position size tends to run larger relative to the dollar risk, and locking in real progress early protects that size from giving it all back on a second pullback.
Where This Setup Breaks Down
The most common failure is impatience: entering during the imbalance-driven thrust itself, before 9:33 AM, because the move "looks too good to wait for." That's exactly the price action this setup is designed to avoid trading, and jumping in during it means buying into a mechanical backlog clearing rather than a genuine directional move.
A second failure shows up on stocks where the spread never narrows. If the bid-ask spread is still wide at 9:40 AM, that's a liquidity problem this specific stock has today, not a timing issue that a few more minutes will fix, and the invalidation criteria call for standing down rather than forcing the setup regardless.
A third, more structural failure happens on days with a scheduled economic release inside the first 15 minutes. A CPI or jobs report landing at 8:30 AM can still be actively repricing the entire market when the bell rings, and in that environment the individual stock's opening imbalance gets swamped by the market-wide one, making the pullback read unreliable regardless of how clean any single ticker looks.
The Liquidity Air Pocket: When the Pullback Never Comes
Sometimes the opening thrust simply doesn't pull back before the move is already over. Price gaps, thrusts hard in the first ninety seconds, and then grinds sideways at the highs rather than giving back the third of its range this setup requires.
That's not a failure of the framework so much as a signal that this particular setup doesn't apply that morning. The instinct to chase the move at 9:36 AM because "it's not pulling back" is worth resisting; a stock that never gives a genuine pullback in the first 15 minutes is better handled by the broader ORB and Golden Hour frameworks, which don't require the specific pullback sequence this setup is built around.
Reading Opening Volatility With the Right Tools
Watching the spread narrow in real time, rather than guessing when it has, requires a Level 2 or time-and-sales view, not just a candlestick chart. A scanner that also tracks real-time relative volume through the open helps confirm that the stock's early volatility is genuinely catalyst-driven rather than a thin, easily-reversed print. Trade Ideas covers both of these in one place, with real-time alerts built around the exact volume and price conditions this setup screens for.
Where the First 15 Minutes Fit the Rest of the Morning
This setup is deliberately narrow: one specific entry pattern, inside one specific 12-minute window, built around one specific structural quirk of how the market opens. It isn't a replacement for the broader Golden Hour playbook, which covers the full first hour and the standard opening range breakout, or for the dedicated ORB strategy guide, which covers the 5, 15, and 30-minute range variants in depth. Think of this article as what happens in the seams before those broader frameworks even have a clean signal to work with.
The discipline required to sit on hands for the first three minutes of the loudest part of the trading day, while every instinct says to act immediately, is worth naming honestly: it's a psychological skill as much as a mechanical rule, and it belongs alongside the broader trading psychology and risk material for traders who find that specific three-minute wait harder than it sounds.
First 15 Minutes Trading FAQs
Why does this setup require waiting until 9:33 AM instead of trading the very first breakout?
Market makers are still working through inventory left over from the opening auction during this stretch, and spreads haven't narrowed to a tradable level yet. Waiting until 9:33 AM skips that noisiest window while still capturing the large majority of a genuine directional move.
Key Takeaway: The 9:33 AM floor is a deliberate filter against the session's least reliable price action, not overcaution.
How is this first-pullback setup different from the opening range breakout described in the ORB strategy guide?
The sequencing matters: this setup requires a directional move to already be underway before looking for an entry, while the ORB setup defines a range first and waits for price to break outside it. They can both apply to the same stock on different mornings, or even the same morning at different points.
Key Takeaway: One trades a range break; the other trades confirmation after an existing thrust has already started.
What does it mean for a stock's spread to "narrow to a tradable level," and how is that measured in practice?
A $40 stock with a spread still running $0.30 to $0.40 wide at 9:38 AM hasn't cleared that bar and shouldn't be traded under this setup's rules, regardless of how clean the chart pattern looks. Checking the actual quote, not just the last-trade price, is required.
Key Takeaway: Spread width is a hard, checkable number, not a feel-based judgment call.
Why does the stop go below the pullback low instead of below the opening print or the pre-market low?
A stop below the opening print or the pre-market low would be far wider than this setup's risk profile calls for, and it wouldn't reflect the actual level the entry decision was based on. Tight, setup-specific stops are what allow the tighter dollar risk this setup is built around.
Key Takeaway: The stop should sit at the level that actually invalidates the specific trade idea, not at a more distant, generic level.
What happens if a stock never gives a genuine pullback in the first 15 minutes?
Chasing that kind of move because it "looks too strong to wait for" defeats the purpose of a setup built around a confirmed retracement. The broader Golden Hour and ORB frameworks, which don't require this specific pullback sequence, are the better fit for a stock behaving that way.
Key Takeaway: Not every strong opener fits this setup, and that's fine; it's not meant to cover every stock every morning.
Does a scheduled economic release change how this setup should be traded?
On those mornings, market-wide volatility swamps the stock-specific signal this setup depends on. Checking the economic calendar before trading this setup on a scheduled-release morning is a required step, not an optional precaution.
Key Takeaway: Treat a scheduled macro release inside the first 15 minutes as a reason to stand down on this specific setup.
Why does this playbook single out the first 15 minutes instead of just treating it as part of the broader opening hour?
The broader hour is loud because of volume and participation; the first 15 minutes specifically are loud because of an auction mechanism resolving itself. Understanding that distinction is what makes the 9:33 AM entry floor make sense as a rule rather than an arbitrary number.
Key Takeaway: The first 15 minutes have their own mechanical quirks that the rest of the Golden Hour doesn't share.
Can this setup be shorted the same way it's traded long?
The same 9:33 AM floor, spread requirement, and stop placement logic apply in reverse, with the stop placed above the pullback high instead of below the pullback low.
Key Takeaway: This is a directionally neutral setup; the rules are identical on the short side, just mirrored.
Disclaimer
Article Sources
- University of Virginia Darden School: The Effects of Opening and Closing Procedures on the NYSE and Nasdaq - research on how opening procedures shape early-session price behavior.
- Tick Size and Price Reversal After Order Imbalance - peer-reviewed research on how imbalance-driven price moves tend to partially reverse once continuous trading normalizes.
- Nasdaq: The Nasdaq Opening and Closing Crosses Fact Sheet - official documentation on how the opening auction resolves order imbalances into a single print.
Was this helpful?
Be the first to weigh in

Written by
Kazi Mezanur RahmanFounder, independent researcher, and editor of DayTradingToolkit. A one-person publication focused on risk-first trading education and documented tool research. He trades his own capital as a retail trader and combines personal market experience with systematic primary-source research.
Keep Reading

Strategies
The Trader's Playbook: How to Day Trade the Market Open
Master DayTradingToolkit's "Golden Hour" framework for the first 60 minutes of trading, including the Opening Range Breakout setup, its failed-breakout mirror trade, and how to build a pre-market watchlist.

Strategies
Trading the Breakout of Prior-Day High/Low Levels
PDH and PDL need no formula, just yesterday's range. This guide covers the breakout, the liquidity-sweep fade, and why stops cluster right at these levels.
Strategies
Range-Bound Trading: A Complete Sideways Market Guide
Learn range-bound trading strategies for sideways markets — how to identify a genuine range, fade the edges with confirmation, and manage the breakout risk.

Strategies
The Trader's Playbook: How to Day Trade the Market Close (The Final Hour)
Learn DayTradingToolkit's Power Hour playbook: how to read the day's character, trade the Range Day breakout setup, and why this playbook steps aside before the closing cross.
Comments
No comments yet. Be the first to share your thoughts.