
The Opening Range Breakout (ORB) Strategy: 5, 15, and 30 Minute Variants

In this article9 sections
Every opening range breakout trade starts with the same question: how long should the range actually be? Five minutes reacts fast and gets whipsawed often. Thirty minutes filters out most of the noise and gets traders in late. Fifteen minutes sits in between and works as a reasonable default, but "reasonable default" isn't the same as "correct for this stock, this morning." Picking the wrong timeframe for a given setup is one of the more common, most fixable mistakes in a breakout trader's process.
This guide is the full breakdown: what actually changes about the setup as the range window stretches from 5 to 15 to 30 minutes, which stocks and conditions favor each one, and the mechanical rules for trading all three without guessing.
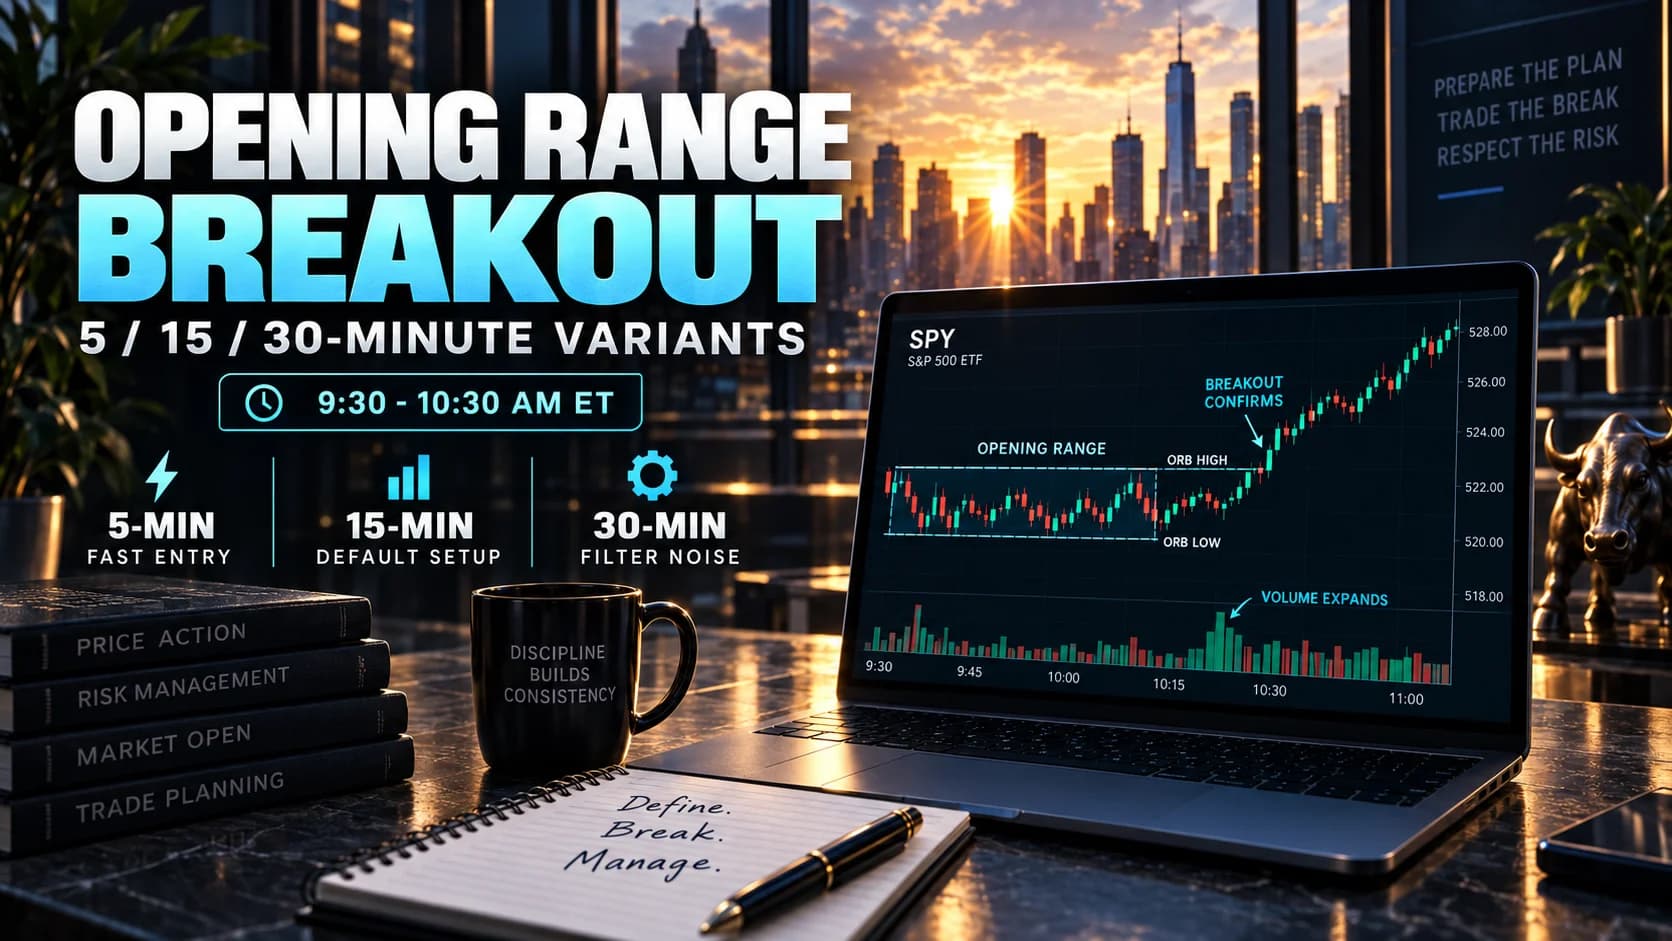
What is the Opening Range Breakout strategy? The Opening Range Breakout, or ORB, is a day trading strategy that marks the high and low of a defined window at the start of the regular session, typically 5, 15, or 30 minutes, and trades the break of that range as a signal that one side of the market has taken control for the rest of the morning.
Why the Range Timeframe Changes the Entire Trade, Not Just the Timing
A 5-minute range and a 30-minute range aren't the same trade played at different speeds. They're built on different assumptions about how a stock behaves in its first minutes, and picking between them means picking which assumption fits the stock in front of you.
A shorter range assumes the stock's real directional intent shows up almost immediately, and that waiting longer just means giving back entry price for no added reliability. That assumption holds best on the most explosive gappers, names with a major catalyst and volume so heavy that the first few minutes already reflect genuine conviction rather than the opening auction's imbalance settling out (a mechanical process covered in full in the first 15 minutes playbook).
A longer range assumes the opposite: that the stock needs more time to work through opening noise before its real direction becomes trustworthy, and that the wider range, while giving up some entry price, filters out enough false signals to be worth it. That assumption tends to hold better on larger, more liquid names and broad index ETFs, where the first few minutes carry more mechanical noise relative to the stock's overall size.
Neither assumption is universally right. The setup specification below breaks out the concrete rules for each timeframe rather than treating them as interchangeable.
The Multi-Timeframe ORB Setup Specification
All three variants share the same underlying logic and differ on specific, checkable parameters.
- Component
- Market Conditions Required
- 5-Minute Variant
- Confirmed catalyst, no scheduled data release in the next 30 minutes
- 15-Minute Variant
- Same
- 30-Minute Variant
- Same, plus broad market itself not choppy or range-bound
- Component
- Time of Day
- 5-Minute Variant
- Range forms 9:30 to 9:35 AM; entries through 9:50 AM
- 15-Minute Variant
- Range forms 9:30 to 9:45 AM; entries through 10:15 AM
- 30-Minute Variant
- Range forms 9:30 to 10:00 AM; entries through 10:30 AM
- Component
- Stock Selection Criteria
- 5-Minute Variant
- Relative volume at least 3x normal; high-beta, high-catalyst names only
- 15-Minute Variant
- Relative volume at least 2x normal; most confirmed gappers
- 30-Minute Variant
- Relative volume at least 1.5x normal; suits large-cap and index ETFs too
- Component
- Entry Trigger
- 5-Minute Variant
- 1-minute close beyond the range high/low, volume clearly above the range-forming candles
- 15-Minute Variant
- Same
- 30-Minute Variant
- Same, but require the breakout candle itself to be at least a 5-minute candle, not a 1-minute print
- Component
- Stop Loss
- 5-Minute Variant
- Full opposite side of the (narrow) range
- 15-Minute Variant
- Range midpoint
- 30-Minute Variant
- Range midpoint, or the 20-EMA on the 5-minute chart if tighter
- Component
- Initial Profit Target
- 5-Minute Variant
- 1.5:1 minimum, taken quickly; this variant is built for speed, not for riding a full trend
- 15-Minute Variant
- 2:1 minimum, scaled in thirds
- 30-Minute Variant
- 2:1 minimum, held longer given the wider, more filtered range
- Component
- Trade Management
- 5-Minute Variant
- Full exit on any stall; this variant does not hold through chop
- 15-Minute Variant
- Move stop to breakeven after first scale-out
- 30-Minute Variant
- Trail using higher lows (or lower highs); more room given for normal pullbacks
- Component
- Invalidation Criteria
- 5-Minute Variant
- Price re-enters the range within 2 minutes of the trigger
- 15-Minute Variant
- Price closes back inside the range
- 30-Minute Variant
- Price closes back inside the range, or the breakout candle's volume doesn't clear the range-forming average
| Component | 5-Minute Variant | 15-Minute Variant | 30-Minute Variant |
|---|---|---|---|
| Market Conditions Required | Confirmed catalyst, no scheduled data release in the next 30 minutes | Same | Same, plus broad market itself not choppy or range-bound |
| Time of Day | Range forms 9:30 to 9:35 AM; entries through 9:50 AM | Range forms 9:30 to 9:45 AM; entries through 10:15 AM | Range forms 9:30 to 10:00 AM; entries through 10:30 AM |
| Stock Selection Criteria | Relative volume at least 3x normal; high-beta, high-catalyst names only | Relative volume at least 2x normal; most confirmed gappers | Relative volume at least 1.5x normal; suits large-cap and index ETFs too |
| Entry Trigger | 1-minute close beyond the range high/low, volume clearly above the range-forming candles | Same | Same, but require the breakout candle itself to be at least a 5-minute candle, not a 1-minute print |
| Stop Loss | Full opposite side of the (narrow) range | Range midpoint | Range midpoint, or the 20-EMA on the 5-minute chart if tighter |
| Initial Profit Target | 1.5:1 minimum, taken quickly; this variant is built for speed, not for riding a full trend | 2:1 minimum, scaled in thirds | 2:1 minimum, held longer given the wider, more filtered range |
| Trade Management | Full exit on any stall; this variant does not hold through chop | Move stop to breakeven after first scale-out | Trail using higher lows (or lower highs); more room given for normal pullbacks |
| Invalidation Criteria | Price re-enters the range within 2 minutes of the trigger | Price closes back inside the range | Price closes back inside the range, or the breakout candle's volume doesn't clear the range-forming average |
The stop placement column is worth reading closely, because it's not arbitrary across the three variants. A 5-minute range is narrow enough that its opposite side is already a tight stop; a 15 or 30-minute range is wide enough that the opposite side would risk too much, so the midpoint (or a moving average) substitutes as a tighter, more honest invalidation level.
Choosing a Variant: A Researched Insight, Not a Preference
The temptation is to pick a favorite timeframe and use it on everything. That's a mistake this setup specifically punishes, and it's worth stating as a genuine finding rather than a stylistic note: the 5-minute variant's edge comes almost entirely from speed on the most extreme gappers, and using it on an ordinary, moderately-gapping stock tends to produce far more false breakouts than the 15-minute default would on the same name, because there simply isn't enough conviction in the first 5 minutes of an ordinary mover to justify trading its range that tightly.
The inverse failure shows up with the 30-minute variant: applying it to a small, thin, high-beta name usually means giving up most of the move waiting for a range that stock never needed. A 30-minute range suits a stock (or an index ETF) whose first half hour is genuinely still resolving, not one that already made its real move in the first five minutes.
Case Study: The 30-Minute Variant on a Large-Cap Index Move
Consider a scenario using SPY on a morning with a strong, broad market catalyst, a major economic data beat released before the open. SPY gaps up and trades choppily through the first 20 minutes as the market digests the number, a pattern the shorter variants would likely have faded or stopped out on.
The 30-minute range, formed from 9:30 to 10:00 AM, prints a high of $452.80 and a low of $450.90, a $1.90 range reflecting that early digestion. At 10:12 AM, a 5-minute candle closes decisively above $452.80 on volume clearly above the range-forming average. Entry at $452.90, stop at the range midpoint of $451.85 (the 20-EMA sits close enough to confirm it), for $1.05 of risk per share. The 2:1 target sits at $455.00.
SPY trails higher through the rest of the morning, held with a trailing stop under rising lows rather than a single fixed exit, and clears the 2:1 level by 11:15 AM. The 5-minute variant on the same morning would likely have triggered multiple false starts during the first 20 minutes of digestion; the wider window let the noise resolve before committing.
Where Each Variant Fails
The 5-minute variant's dominant failure mode is exactly what its speed trades away: getting whipsawed by the normal, healthy noise of the first five minutes on a stock that isn't actually explosive enough to justify that tight a window. If the invalidation criteria (re-entry within 2 minutes) triggers more than once on the same name in the same morning, that's a signal the stock doesn't suit this variant that day, not a reason to keep re-entering.
The 15-minute variant, covered in depth as this hub's default setup in the market open playbook, fails most often on a breakout that isn't volume-confirmed, the single most common ORB failure across all three timeframes.
The 30-minute variant's failure mode is different: missing the move entirely. On a stock that thrusts hard and holds in the first ten minutes with no meaningful pullback, waiting the full 30 minutes for a range means entering well after the best part of the move, on a range that's really just capturing a trend that already started. Recognizing that pattern early, a stock that clearly doesn't need 30 minutes, and switching down to the 15-minute variant in real time is an advanced adjustment worth building once all three variants are individually comfortable.

Market Profile traders use a related but distinct concept called the Initial Balance, typically the first 60 minutes of trading (or the first two 30-minute TPO periods), to judge whether a day is likely to trend or stay range-bound, and to estimate how far price might extend beyond that early range. The ORB setups above are shorter, discrete breakout trades; the Initial Balance is a broader framework for reading the whole day's character from its first hour. The two ideas overlap conceptually but aren't the same tool, and the dedicated Initial Balance trading strategy guide covers that broader framework and how it complements the setups here.
Scanning for ORB Candidates Across Timeframes
Because the three variants need different stock profiles, a scanner that can filter by relative volume threshold in real time is more useful here than a static gap list. Trade Ideas supports building separate alert profiles for each variant's volume threshold, which turns "which timeframe fits this stock today" from a judgment call made cold into a filtered, pre-sorted list by 9:30 AM.
Fitting the ORB Into a Complete Morning Plan
None of the three ORB variants replaces the judgment covered in the broader Golden Hour playbook: building a focused watchlist, confirming a real catalyst, and sizing positions consistently with the rest of the trading day. The variants here are the mechanical entry rules for one specific tool within that broader framework, not a standalone system.
Opening Range Breakout FAQs
How do you decide which ORB timeframe to use before the market even opens?
Checking relative volume and the size/beta of the name during pre-market prep, before the bell rings, is what makes this a pre-planned decision rather than a real-time guess. Switching timeframes mid-trade should be rare and only in the specific case described in this guide's failure section.
Key Takeaway: Match the timeframe to the stock's pre-market profile before the open, not to a personal default.
Why does the 30-minute variant use a trailing stop while the 5-minute variant exits on any stall?
A wider, more-filtered range has already screened out more of the noise by the time it triggers, which justifies giving the trade room to breathe with a trailing stop. The 5-minute variant's edge comes from getting in early on the most explosive names, where a stall is a stronger signal that the extreme move has already run its course.
Key Takeaway: Trade management should match each variant's underlying assumption about how much follow-through to expect.
Can more than one ORB timeframe be traded on the same stock in the same morning?
If a 5-minute breakout stops out and the stock then builds a genuinely different 15-minute range afterward, that's a fresh, independent setup. Treating a stopped-out 5-minute trade and its subsequent 15-minute range as one continuous idea, and averaging into it, defeats the purpose of having a hard stop in the first place.
Key Takeaway: Each timeframe's setup should be evaluated as its own independent trade, not stacked on top of a failed one.
What's the actual difference between the ORB and the Initial Balance concept from Market Profile trading?
A trader can use the Initial Balance to form a view on whether today is likely to trend or range, and separately use one of the ORB variants above as the actual mechanical entry once that view is confirmed by price action. They're complementary rather than redundant.
Key Takeaway: ORB is the entry technique; Initial Balance is the broader read on the day it can sit inside of.
Why does the 15-minute variant require a 5-minute breakout candle instead of a 1-minute one?
A 1-minute close beyond the range can happen on a single aggressive order and reverse immediately; waiting for a full 5-minute candle to confirm the same break filters out a meaningful share of those single-print head-fakes without giving up much entry price.
Key Takeaway: A slightly slower confirmation candle reduces false signals without materially delaying the entry.
Does the ORB strategy work on futures or only on individual stocks?
Futures markets trade nearly continuously, so "the open" for this purpose refers to the regular equity session's 9:30 AM ET start, since that's when the bulk of the volume this setup depends on actually arrives.
Key Takeaway: The core mechanics transfer to futures, with the 30-minute variant usually the better starting point for large index contracts.
What causes the 5-minute variant specifically to produce more false signals than the other two?
That's the tradeoff the variant makes deliberately: more false signals in exchange for the earliest possible entry on names explosive enough to make that tradeoff worth it. It isn't a flaw to fix; it's the reason the setup spec restricts this variant to only the most extreme, highest-conviction gappers.
Key Takeaway: The 5-minute variant's higher false-signal rate is a built-in tradeoff for speed, appropriate only on the most extreme setups.
Disclaimer
Article Sources
- Heston, Korajczyk, Sadka: Intraday Patterns in the Cross-section of Stock Returns - academic research on systematic intraday return patterns relevant to why breakout reliability changes across the morning.
- Chapman University: Revisiting the U-shaped Patterns in Volatility and Price Impacts - research on the intraday volume and volatility curve underlying why range timeframes behave differently on different stock types.
- Price Discovery Without Trading: Evidence from the Nasdaq Preopening - academic research on how pre-market order flow feeds into the price the market actually opens at, relevant background for why the earliest minutes carry more noise.
Was this helpful?
Be the first to weigh in

Written by
Kazi Mezanur RahmanFounder, independent researcher, and editor of DayTradingToolkit. A one-person publication focused on risk-first trading education and documented tool research. He trades his own capital as a retail trader and combines personal market experience with systematic primary-source research.
Keep Reading

Strategies
Trading the Breakout of Prior-Day High/Low Levels
PDH and PDL need no formula, just yesterday's range. This guide covers the breakout, the liquidity-sweep fade, and why stops cluster right at these levels.

Strategies
Trading Breakouts From Consolidation: The Volatility Contraction Pattern
The VCP isn't just a volatility squeeze. This guide covers the staged contraction sequence, the pivot point, and why context matters as much as the pattern.
Strategies
The 52-Week High Breakout Strategy: Trading Stocks at New Highs
Investors anchor on the 52-week high, and that bias is exactly why breaking it carries real weight. This guide covers the research and trading the breakout.
Strategies
The Bollinger Band Squeeze Strategy: Trading Volatility Compression
Tight Bollinger Bands signal a coiled market. This guide covers measuring real squeeze compression, trading the breakout direction, and avoiding false starts.
Comments
No comments yet. Be the first to share your thoughts.