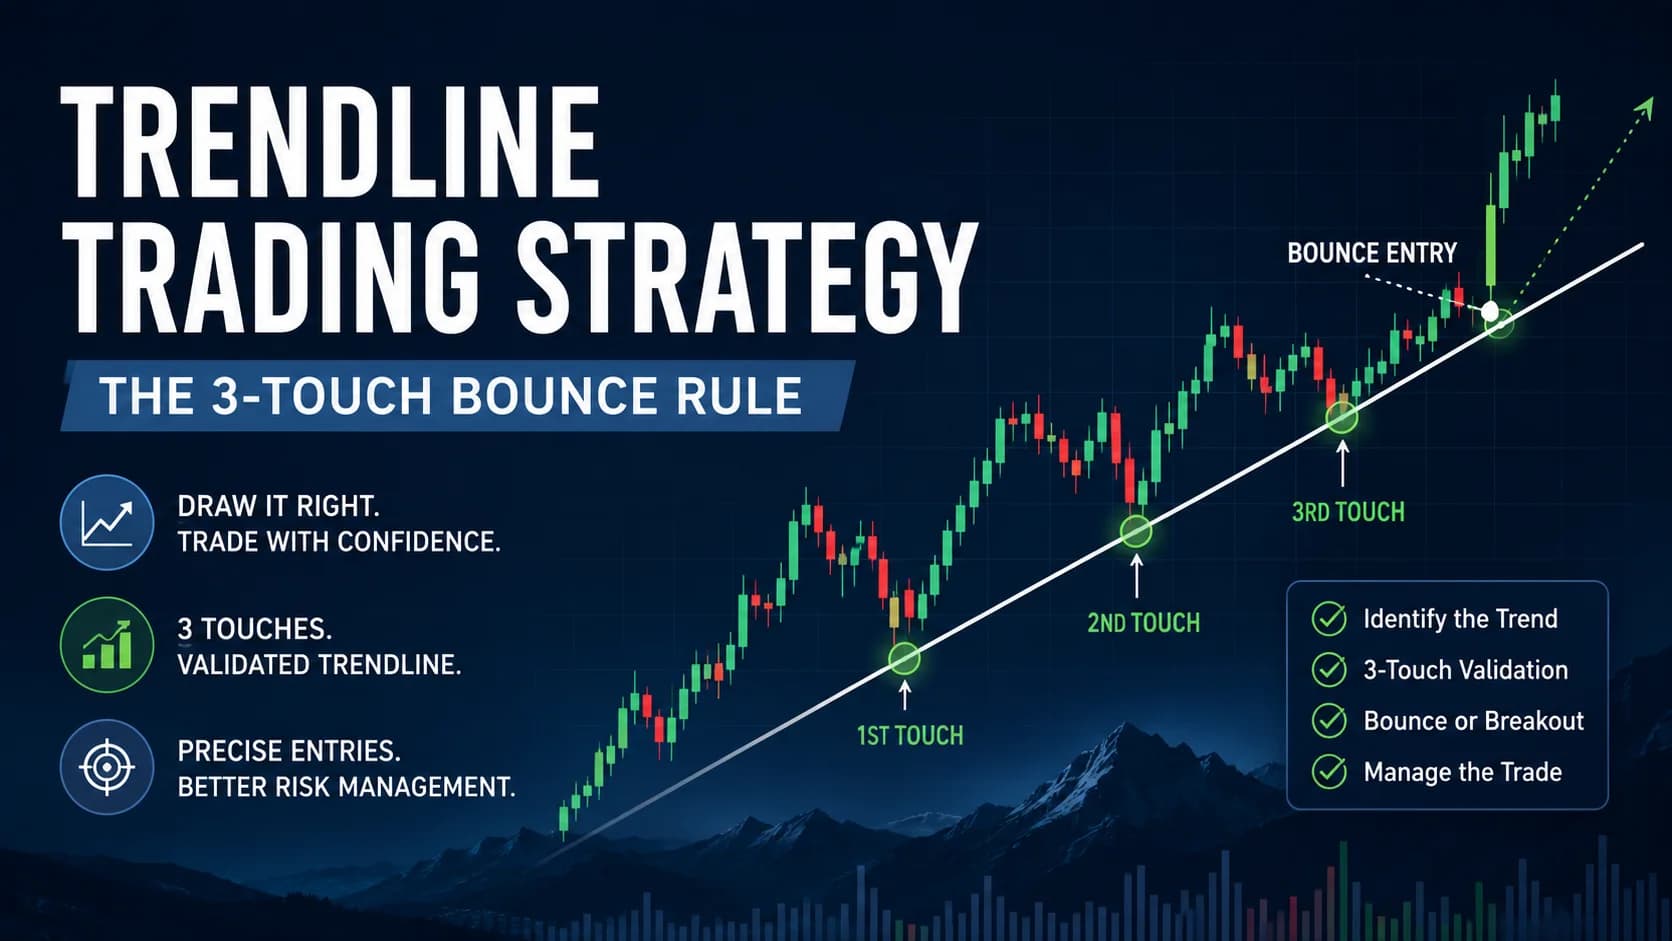
A stock pulls back 20% from a recent high, rallies, pulls back again — this time only 10% — rallies again, then pulls back a third time for just 5% before tightening into a narrow RangeA range (or trading range) is a price zone where a stock oscillates between a defined support floor and resistance ceiling without making meaningful new highs or lows — price is consolidating rather than trending, and the dominant trade is Read definition → near the highs. Each wave of selling does less damage than the one before it. That progression, not any single indicator reading, is the entire signal.
This is the Volatility Contraction Pattern, popularized by trader Mark Minervini in his books Trade Like a Stock Market Wizard and Think and Trade Like a Champion. It's a distinct methodology from a statistical volatility SqueezeA squeeze (short squeeze) occurs when a stock that is heavily shorted rises sharply, forcing short sellers to buy back shares to cover their losing positions — the forced buying adds fuel to the upward move, creating a feedback loop that caRead definition → — it's a specific, staged base-building sequence with its own context requirements, its own price-action tells, and its own definition of exactly where the BreakoutA breakout is when price moves decisively beyond a defined level — a resistance zone, a consolidation boundary, a chart pattern boundary, or a prior high — suggesting that the previous supply at that level has been overcome.Read definition → entry sits.
What is the Volatility Contraction Pattern? The VCP is a chart pattern in which a stock's price pulls back in a series of progressively smaller waves — each contraction shallower and lower-VolumeVolume is the total number of shares (or contracts) traded during a given time period — it's the primary confirmation tool for all price action, because a price move accompanied by high volume indicates genuine market participation, while tRead definition → than the last — while consolidating within an existing uptrend. The pattern is considered complete when the final, tightest contraction resolves with a breakout above its high (the "pivot point") on expanding volume.
How This Differs From a Statistical Volatility Squeeze
It's worth being precise about this distinction, since both concepts involve "volatility contracting" and get confused often. The Bollinger Band Squeeze covered elsewhere in this hub is a statistical, indicator-driven signal — BandWidth compressing to a multi-month low, confirmed by Keltner Channel overlap, with no requirement about prior TrendA trend is a sustained directional movement in price over time — an uptrend is characterized by a sequence of higher highs and higher lows, a downtrend by lower highs and lower lows — and correctly identifying the current trend direction isRead definition → context and no directional bias built into the signal itself.
The VCP is a specific, structured price-action sequence rather than a single indicator reading. It requires a defined series of contractions (typically two to four), each one tighter and lower-volume than the last, occurring specifically within an existing uptrend. Unlike a Bollinger squeeze, which can appear in any market context and doesn't predict direction, the VCP is explicitly a bullish continuation setup — it only counts as a valid VCP when it appears as a pause within an uptrend, not as a standalone reversal signal at the bottom of a decline.
The Stage 2 Requirement: Why Context Comes Before the Pattern
Minervini's framework builds on stage analysis, a concept associated with trader Stan Weinstein's Secrets for Profiting in Bull and Bear Markets, which divides a stock's life cycle into four stages: basing (Stage 1), advancing (Stage 2), topping (Stage 3), and declining (Stage 4). A VCP is only considered valid when it forms during Stage 2 — a stock already in a confirmed uptrend, typically trading above rising 50-day and 200-day moving averages with strong relative strength versus the broader market.
This context requirement is easy to skip and important not to. A sideways consolidation appearing after a stock has fallen for months isn't the same pattern as a VCP forming after a strong advance — even if the price action looks superficially similar. Applying VCP logic to a stock that hasn't already proven itself with a genuine prior uptrend is one of the more common ways this pattern gets misapplied.
Relative strength is the other half of this context check. A stock that's merely tracking the broader index, rather than outperforming it, doesn't carry the same institutional-accumulation signal Minervini's framework assumes is behind a genuine VCP. The combination of a Stage 2 trend and market-beating relative performance is what separates a market leader digesting a strong move from a stock that's simply gone quiet without having demonstrated any real strength in the first place.
Reading the Contraction Sequence
The core of the pattern is the progression itself. A typical VCP might show a first pullback of around 20%, a second of around 10%, and a third of around 5% — each wave doing meaningfully less downside damage than the one before it, and each ideally accompanied by lower volume than the prior contraction.
Minervini describes healthy contractions as showing "tennis ball action" — quick, sharp recoveries after each small pullback, rather than a slow, grinding decline. Higher lows across the sequence, and closes near the top of the daily range during the tightening phase, are additional signs that buyers are stepping in earlier at each successive test. A base that keeps undercutting its own prior lows, or that shows heavy selling volume persisting into the final, supposedly "tightest" contraction, isn't showing the progression the pattern depends on.
The VCP Breakout: A Setup Specification
- Component
- Market Conditions Required
- Rule
- Stock in a confirmed Stage 2 uptrend — trading above rising 50-day and 200-day moving averages with relative strength versus the broader market; base showing at least two to three sequential contractions, each tighter and lower-volume than the last
- Component
- Time of Day
- Rule
- 9:45 AM–3:30 PM ET for the actual breakout entry candle, consistent with the general breakout confirmation framework — the base itself typically builds over several weeks
- Component
- Stock Selection Criteria
- Rule
- Market leaders showing genuine relative strength, not laggards or weak stocks basing after a prolonged decline; the VCP applies to stocks that have already proven themselves with a real advance
- Component
- Entry Trigger
- Rule
- A close above the pivot point — the high of the final, tightest contraction — on volume expansion; volume on the breakout candle itself should be visibly above the recent average
- Component
- Stop Loss
- Rule
- Placed just below the low of the final contraction — because that contraction is, by design, the tightest in the sequence, this produces a well-defined and typically fairly tight risk relative to a standard breakout stop
- Component
- Initial Profit Target
- Rule
- A reward-to-risk framing of roughly 2:1 to 3:1 relative to the stop distance is a commonly used starting point, adjusted as the position develops using a trailing stop
- Component
- Trade Management
- Rule
- Elevated volume often persists for several sessions after the breakout rather than appearing only on the breakout candle itself — sometimes peaking one to three days after the initial break — which is worth checking as ongoing confirmation rather than assuming the breakout candle alone tells the whole story
- Component
- Invalidation Criteria
- Rule
- The final contraction fails to actually tighten relative to the prior ones, the stock undercuts earlier lows in the sequence rather than making higher lows, or the broader uptrend context breaks down before the pattern completes
| Component | Rule |
|---|---|
| Market Conditions Required | Stock in a confirmed Stage 2 uptrend — trading above rising 50-day and 200-day moving averages with relative strength versus the broader market; base showing at least two to three sequential contractions, each tighter and lower-volume than the last |
| Time of Day | 9:45 AM–3:30 PM ET for the actual breakout entry candle, consistent with the general breakout confirmation framework — the base itself typically builds over several weeks |
| Stock Selection Criteria | Market leaders showing genuine relative strength, not laggards or weak stocks basing after a prolonged decline; the VCP applies to stocks that have already proven themselves with a real advance |
| Entry Trigger | A close above the pivot point — the high of the final, tightest contraction — on volume expansion; volume on the breakout candle itself should be visibly above the recent average |
| Stop Loss | Placed just below the low of the final contraction — because that contraction is, by design, the tightest in the sequence, this produces a well-defined and typically fairly tight risk relative to a standard breakout stop |
| Initial Profit Target | A reward-to-risk framing of roughly 2:1 to 3:1 relative to the stop distance is a commonly used starting point, adjusted as the position develops using a trailing stop |
| Trade Management | Elevated volume often persists for several sessions after the breakout rather than appearing only on the breakout candle itself — sometimes peaking one to three days after the initial break — which is worth checking as ongoing confirmation rather than assuming the breakout candle alone tells the whole story |
| Invalidation Criteria | The final contraction fails to actually tighten relative to the prior ones, the stock undercuts earlier lows in the sequence rather than making higher lows, or the broader uptrend context breaks down before the pattern completes |
The Invalidation Criteria row matters as much as the entry trigger. A base that never actually tightens — where the final pullback is just as deep as the first one — isn't a VCP with a delayed breakout. It's a pattern that never qualified in the first place, regardless of how long it's been watched.
A Walk-Through: Reading a Three-Stage Contraction
Picture a large-cap technology stock — call it ABC — that's advanced from $80 to $130 over several months, comfortably above its rising 50-day and 200-day moving averages, with strong relative performance against the broader index. The stock then begins to consolidate.
The first pullback takes it from $130 down to $104 — a 20% contraction — before rallying back toward the highs. The second pullback takes it from $128 down to $115, roughly a 10% contraction, again on lighter volume than the first pullback. The third and final pullback is tighter still: from $126 down to $120, about a 5% move, with volume noticeably drier than either of the prior two contractions. Through this final stage, the stock is closing consistently near the top of its daily range.
The pivot point sits at $126, the high of that final contraction. When the stock closes at $128 on volume running well above its recent average, the breakout confirms. The stop goes just below the final contraction's low, near $119 — a comparatively tight risk given the stock's overall trading range. Volume stays elevated for the next several sessions, consistent with genuine continuation rather than a one-day spike that quickly fades.
Now picture an alternate version: the third "contraction" actually dips to $112 — deeper than the second pullback, not tighter. That's not a valid final-stage contraction; the sequence has broken down, and the pattern shouldn't be treated as VCP-qualified regardless of how the price eventually resolves.
Where the VCP Breaks Down
The most common misapplication is treating any sideways consolidation as a VCP regardless of the stock's broader trend context. The pattern's logic depends specifically on a prior genuine advance and a Stage 2 uptrend — applying it to a stock that's simply gone flat after a long decline skips the entire premise the pattern is built on.
It also fails when the contraction sequence doesn't actually tighten. A base where the pullbacks stay roughly the same size, or get deeper rather than shallower, isn't showing the progressive exhaustion of selling pressure the VCP depends on — it's just an ordinary, unremarkable consolidation that happens to share a superficial resemblance to the pattern.
And it's worth being honest about the nature of the evidence behind this pattern. Unlike some concepts covered elsewhere in this hub, the VCP's track record comes primarily from Minervini's own documented trading results and writing rather than independent, peer-reviewed academic research. That doesn't make the pattern's underlying logic — decreasing supply, tightening price action, a well-defined breakout point — any less sound as a practical framework, but it's a different category of evidence than a controlled academic study, and it's worth knowing the distinction.
A further, quieter failure mode: forcing the pattern's specific percentage sequence onto a stock that doesn't naturally fit it. Not every genuine VCP hits a clean 20%-10%-5% progression — some stocks contract in two stages rather than three, others show a less tidy sequence that still demonstrates the same underlying principle of diminishing downside damage. Rejecting a setup solely because it doesn't match a textbook percentage example, while ignoring that the broader progression and volume dry-up are both genuinely present, misses the forest for the trees.
Tools for Screening VCP Candidates
Manually scanning for stocks in a confirmed uptrend with a multi-stage tightening contraction sequence isn't practical across a broad watchlist — this is exactly the kind of structured, multi-condition filtering a scanner is built for.
A platform like Trade Ideas can screen for the underlying components — stocks above rising moving averages with strong relative strength and contracting recent volatility — narrowing a broad universe down to genuine candidates worth a manual chart review, rather than requiring that review across the entire market.
Where This Fits a Complete Trading Plan
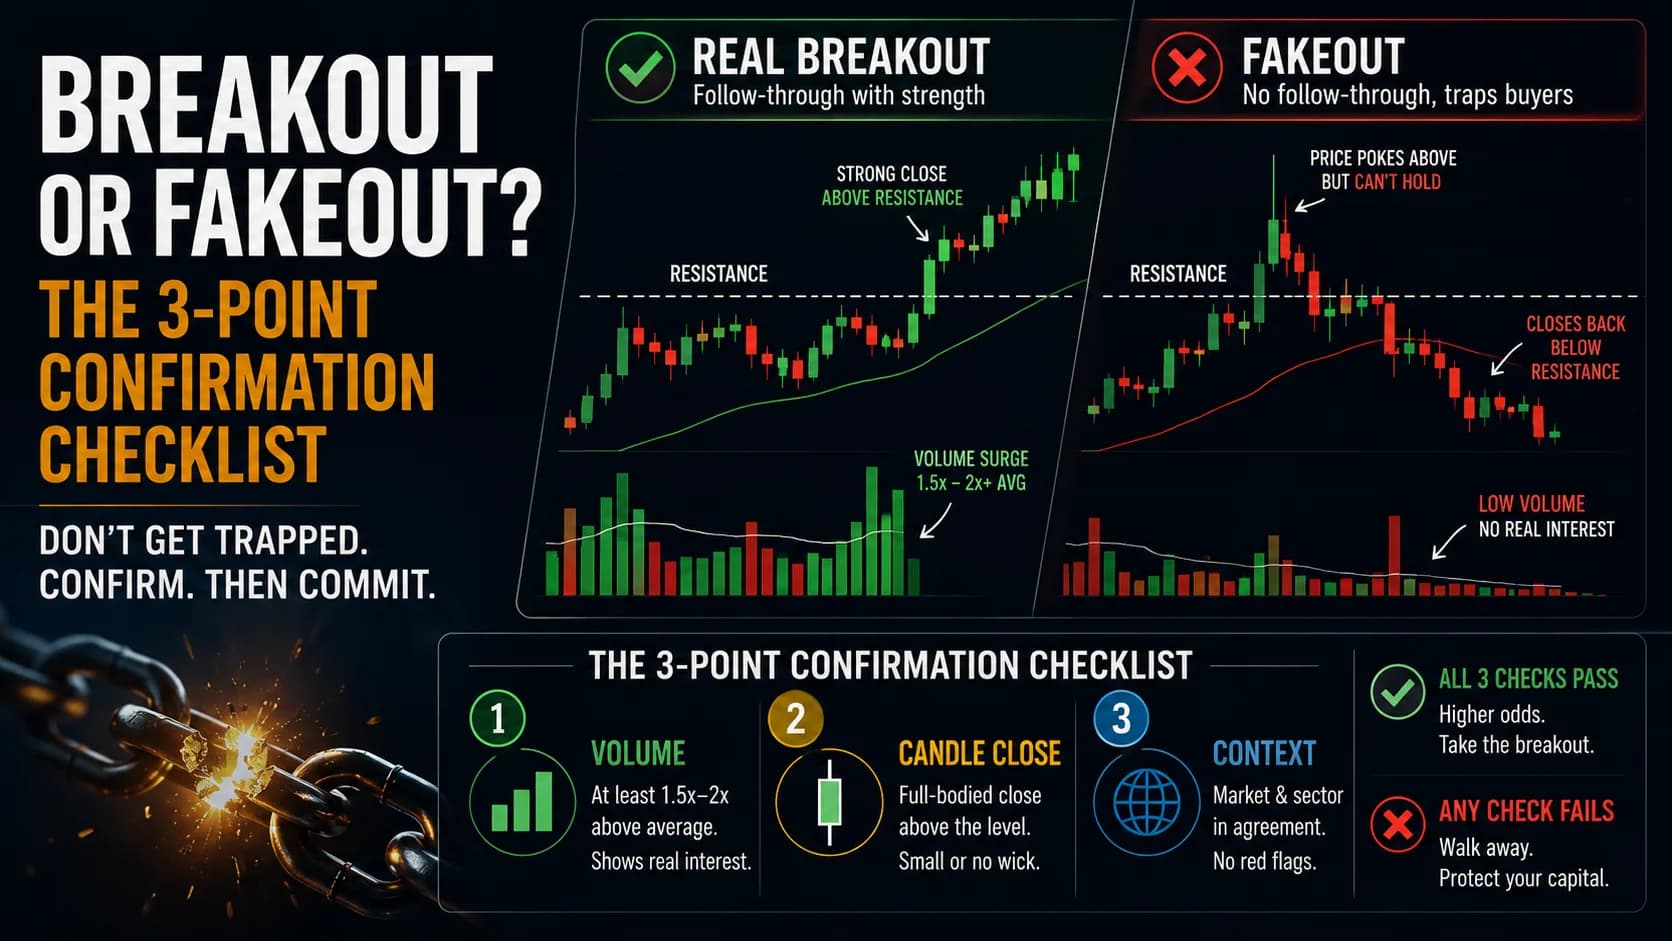
The VCP is best understood as a distinct methodology alongside, not a replacement for, the general breakout confirmation checklist covering volume, candle close, and context — the pivot breakout itself still needs to clear those same basic checks. For anyone applying the pattern's volume-based confirmation more deeply, the volume breakout guide covers reading volume pace and structure beyond a single spike, which applies directly to confirming a VCP's pivot breakout.
For the rest of the breakout and breakdown setups this guide complements, the Strategies Hub organizes the full library by market condition.
Frequently Asked Questions About the Volatility Contraction Pattern
How is the VCP different from a Bollinger Band Squeeze?
The two concepts both involve "volatility contracting," but the VCP requires a specific progression of tightening, lower-volume pullbacks and a defined uptrend context, while a Bollinger squeeze can appear in any market condition and doesn't predict which direction the eventual move will go.
Key Takeaway: Treat these as two distinct methodologies that happen to share the word "contraction," not variations of the same signal.
Why does the VCP only count as valid within an existing uptrend?
A superficially similar-looking sideways consolidation can appear in very different trend contexts, but only the version occurring within a genuine Stage 2 uptrend carries the interpretation the VCP assigns to it.
Key Takeaway: Confirm the stock is in a genuine, established uptrend before treating any tightening base as a VCP candidate.
How many contractions does a typical VCP show?
The exact percentages vary by stock and by how volatile the underlying advance was, but the progression — each wave doing less downside damage than the last — matters more than hitting any specific numerical target for each stage.
Key Takeaway: Focus on the shrinking progression across contractions rather than matching an exact percentage sequence.
What is the pivot point, and how is it defined?
This is a more specific definition than a generic resistance level, since it's tied directly to the most recent and tightest stage of the contraction sequence rather than any broader high in the base.
Key Takeaway: Use the high of the final contraction specifically as the pivot, not an earlier or broader high within the base.
What is "tennis ball action," and why does Minervini emphasize it?
This price-action tell adds qualitative confirmation to the quantitative contraction-and-volume progression, helping distinguish a genuinely healthy tightening base from one that merely looks tight on a chart without showing real underlying buying interest.
Key Takeaway: Look for quick bounces after each pullback, not just shrinking price ranges, as a sign of a healthy contraction sequence.
Why does volume sometimes peak a few days after the breakout rather than on the breakout day itself?
This means the breakout candle's own volume, while important, isn't necessarily the single moment of maximum confirmation — checking that volume remains elevated over the following sessions adds a further layer of confidence beyond the initial breakout bar.
Key Takeaway: Continue watching volume for several sessions after the breakout rather than treating the breakout candle as the only relevant volume reading.
Is the VCP backed by independent academic research the same way some other patterns are?
This doesn't invalidate the pattern's underlying logic, which reflects a reasonable read of decreasing supply and tightening price action, but it's a meaningfully different category of evidence than a controlled academic study, and that distinction is worth keeping in mind when weighing how much confidence to place in the pattern.
Key Takeaway: Treat the VCP as a well-documented practitioner methodology, not as a pattern with the same evidentiary backing as peer-reviewed academic research.
What invalidates a VCP before the breakout even occurs?
Any of these signals that the progressive exhaustion of selling pressure the pattern depends on isn't actually occurring, regardless of how the price action might otherwise resemble a textbook base.
Key Takeaway: Watch for a genuinely tightening final stage and intact uptrend context — without both, the pattern hasn't actually formed.
How should the stop-loss be set on a VCP breakout entry?
This tight, structurally defined stop is one of the practical advantages of the VCP over a less-defined breakout setup, since the pattern's own final stage naturally provides a close, logical risk reference point.
Key Takeaway: Use the final contraction's low as the stop reference — its tightness is a structural feature of the pattern, not an arbitrary choice.
Can the VCP be applied to any stock, or only certain kinds?
Applying VCP logic indiscriminately to any stock showing a tightening price range, without confirming the broader relative strength and trend context, misses the qualitative filter that separates a genuine VCP candidate from an ordinary, unremarkable consolidation.
Key Takeaway: Reserve the VCP framework for stocks that have already demonstrated real strength, not for any stock that happens to be consolidating.
Disclaimer
Article Sources
- Minervini, M. (2013). Trade Like a Stock Market Wizard. McGraw-Hill Education. — the primary published source for the Volatility Contraction Pattern methodology referenced throughout this guide.
- Minervini, M. (2019). Think and Trade Like a Champion. McGraw-Hill Education. — further elaborates the VCP concept and the "tennis ball action" and "line of least resistance" terminology referenced in this guide.
- Weinstein, S. (1988). Secrets for Profiting in Bull and Bear Markets. McGraw-Hill Education. — the original source for the four-stage market cycle analysis (Stage 1 through Stage 4) that underpins the VCP's uptrend context requirement.