"Check for a VolumeVolume is the total number of shares (or contracts) traded during a given time period — it's the primary confirmation tool for all price action, because a price move accompanied by high volume indicates genuine market participation, while tRead definition → spike" is the standard advice for confirming a BreakoutA breakout is when price moves decisively beyond a defined level — a resistance zone, a consolidation boundary, a chart pattern boundary, or a prior high — suggesting that the previous supply at that level has been overcome.Read definition →, and it's correct as far as it goes. But a single elevated bar on the breakout candle is a blunt tool — it tells you something happened, not whether the buying (or selling) pressure driving it is likely to continue, or whether it's already spent by the time the candle closes.
The three-point breakout checklist covered elsewhere in this hub uses a simple volume-multiple check as one of its three gates. This guide goes deeper into volume itself — the reasons volume confirms price moves in the first place, and three specific ways of reading it that go beyond a single bar's height.
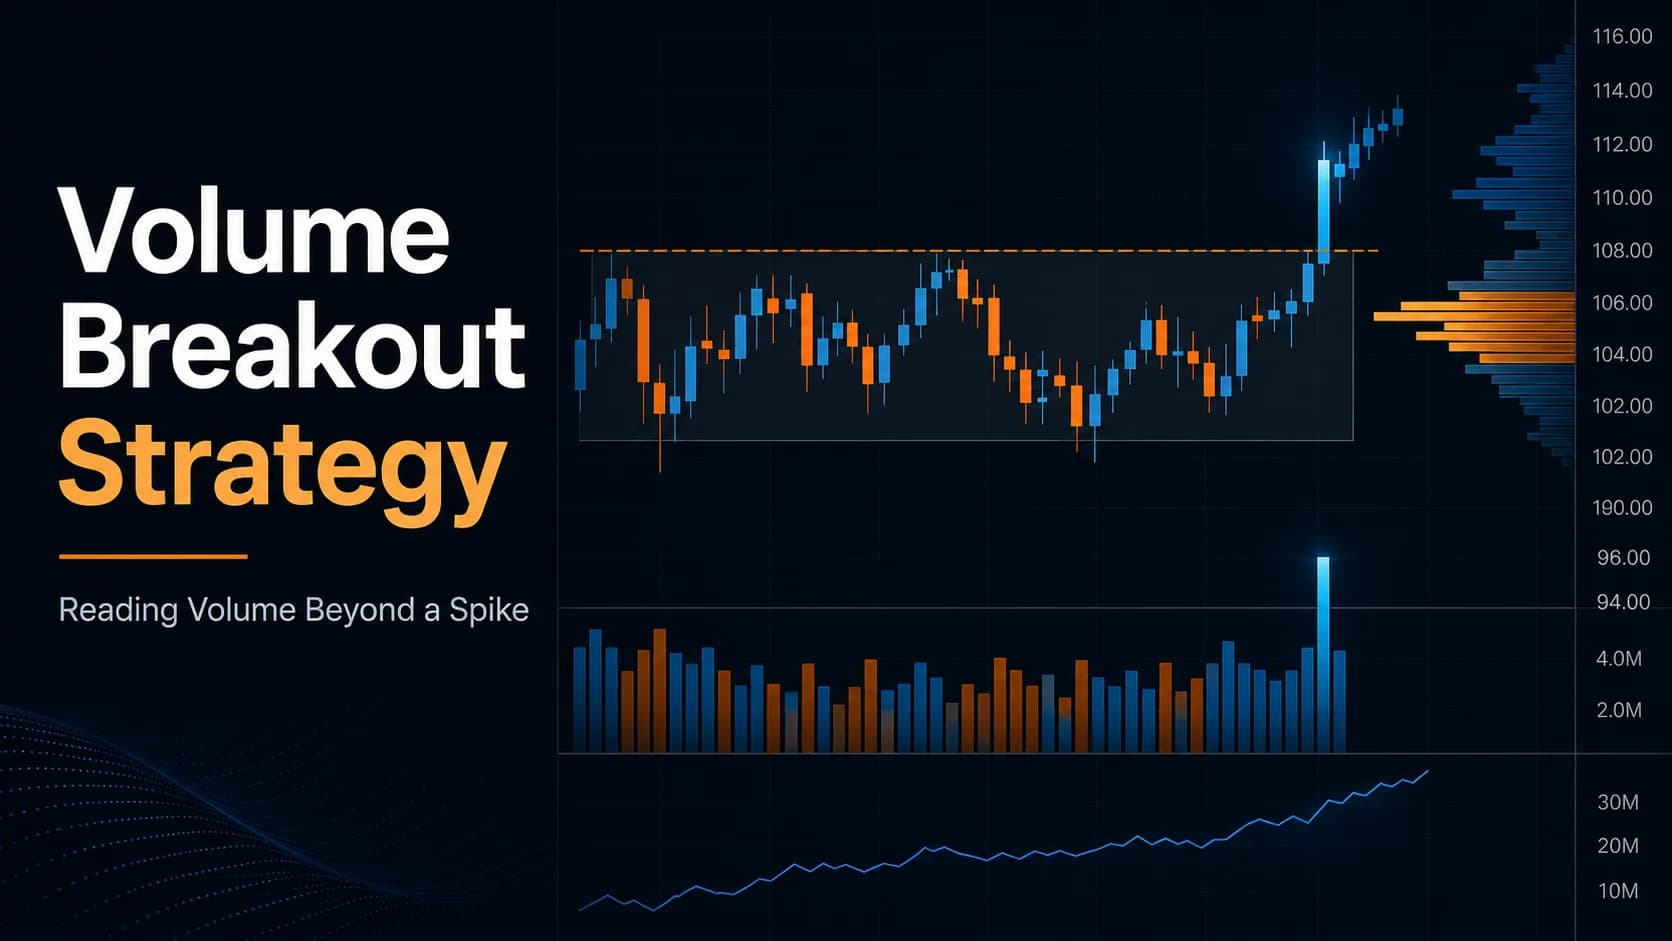
What is the volume breakout strategy? It's an approach to confirming breakouts that treats volume as more than a single spike to check off — using the pace of volume relative to a stock's normal session, a cumulative volume indicator to confirm the underlying TrendA trend is a sustained directional movement in price over time — an uptrend is characterized by a sequence of higher highs and higher lows, a downtrend by lower highs and lower lows — and correctly identifying the current trend direction isRead definition →, and the structure of prior volume at different price levels to judge whether a breakout is likely to continue or stall.
Why Volume Confirms Price in the First Place
The relationship between volume and price isn't just a trading convention — it has real academic grounding. Karpoff (1987), published in the Journal of Financial and Quantitative Analysis, surveyed decades of research and established that trading volume is positively related to the magnitude of a price change, meaning larger price moves tend to occur alongside higher volume as a general market-wide pattern.
The practical read: volume acts as a rough proxy for how much genuine disagreement and fresh participation is behind a given price move. A breakout on high volume reflects a large number of participants actively repricing the stock; a breakout on low volume reflects a small number of orders pushing price through a level with comparatively little broader agreement behind the move. That's the underlying reason the simple "check for a spike" rule works as well as it does — and also why a single bar's spike doesn't capture the full picture.
Beyond the Spike: Volume Pace, Not Just Volume Height
A single candle's volume bar only shows activity during that specific bar. Volume pace looks at something related but distinct: how much of the stock's typical full-session volume has already traded by a given point in the day.
A stock that's already traded 60% of its 20-day average daily volume by 11:00 AM ET is on pace for a session considerably busier than normal — a different, and often more informative, signal than any single 5-minute bar in isolation. A breakout occurring during a session that's already running well ahead of its normal volume pace carries more weight than the same breakout candle occurring on an otherwise average-paced day, even if the breakout bar itself looks identical in both cases.
On-Balance Volume: Confirming the Trend Behind the Breakout
On-Balance Volume (OBV), developed by Joseph Granville and introduced in his 1963 book Granville's New Key to Stock Market Profits, is a running cumulative total that adds a period's volume when price closes higher and subtracts it when price closes lower. The specific numerical value of OBV isn't meaningful on its own — what matters is its slope and whether it agrees with price.
For breakout confirmation specifically, OBV is useful in two ways. First, an OBV line that's been rising steadily in the sessions leading into a breakout supports the idea that buying pressure has been building before the visible price move, rather than the breakout being a sudden, unsupported spike. Second, OBV divergence — price making a new high while OBV fails to confirm with its own new high — is a warning sign worth checking before trusting a breakout, since it suggests the move isn't being backed by proportionally strong cumulative buying pressure.
Volume Profile: Where Prior Volume Traded, Not Just How Much
Volume profile takes a different cut at the same underlying data by mapping how much volume traded at each specific price level, rather than at each time period. Two concepts from this approach matter most for breakout confirmation.
High-volume nodes (HVNs) are price levels where a large amount of prior volume has traded — these tend to act as areas of ConsolidationConsolidation is a period where price moves sideways within a relatively tight range after a directional move — it reflects a temporary equilibrium between buyers and sellers before the next move.Read definition →, since many participants have an established interest at that price. A breakout that has to fight through a nearby high-volume node above it faces real ResistanceResistance is a price level where selling pressure has historically overcome buying pressure, causing price to stall, reverse, or consolidate — it's the ceiling where supply enters the market and where breakout traders watch for either a coRead definition → from participants who are comfortable trading (and potentially adding to positions) at that level.
Low-volume nodes (LVNs) are the opposite — price levels where very little prior volume traded, often because price moved through them quickly on a previous strong move. These "air pocket" zones tend to see price accelerate through them again, since there's comparatively little established interest to slow the move down. A breakout that clears a level and finds a low-volume node just above it has a more open path than one immediately running into a high-volume node.
Checking a stock's volume profile before a breakout — noting where the nearest high-volume and low-volume nodes actually sit — adds a structural dimension that a simple time-based volume bar can't show.
The Volume-Confirmed Breakout: A Setup Specification
- Component
- Market Conditions Required
- Rule
- A defined support or resistance level being tested, with the broader session already running at an elevated volume pace relative to the stock's normal average for that time of day
- Component
- Time of Day
- Rule
- 9:45 AM–3:30 PM ET — the opening 15 minutes are excluded, consistent with the general breakout confirmation framework
- Component
- Stock Selection Criteria
- Rule
- Liquid stocks or ETFs with average daily volume above 1 million shares — volume profile and OBV readings are less meaningful on thinly traded names
- Component
- Entry Trigger
- Rule
- All three volume checks align: (1) the breakout candle's volume is at least 1.5–2x the recent average, (2) OBV has been trending in the direction of the breakout without a recent bearish (or bullish, for a breakdown) divergence, (3) the path immediately beyond the breakout level is a low-volume node rather than a high-volume node
- Component
- Stop Loss
- Rule
- Placed at the breakout candle's low (for a long breakout) or high (for a short breakdown), consistent with the general breakout framework
- Component
- Initial Profit Target
- Rule
- The next high-volume node above the breakout point, which tends to act as a natural resting place for price rather than an arbitrary measured-move distance
- Component
- Trade Management
- Rule
- If volume pace slows sharply after the breakout — the stock stops trading at an elevated relative pace — treat this as reduced conviction even if price hasn't reversed yet
- Component
- Invalidation Criteria
- Rule
- OBV shows a clear divergence against the breakout direction at the time of the break, or the breakout immediately runs into a nearby high-volume node rather than clearing space
| Component | Rule |
|---|---|
| Market Conditions Required | A defined support or resistance level being tested, with the broader session already running at an elevated volume pace relative to the stock's normal average for that time of day |
| Time of Day | 9:45 AM–3:30 PM ET — the opening 15 minutes are excluded, consistent with the general breakout confirmation framework |
| Stock Selection Criteria | Liquid stocks or ETFs with average daily volume above 1 million shares — volume profile and OBV readings are less meaningful on thinly traded names |
| Entry Trigger | All three volume checks align: (1) the breakout candle's volume is at least 1.5–2x the recent average, (2) OBV has been trending in the direction of the breakout without a recent bearish (or bullish, for a breakdown) divergence, (3) the path immediately beyond the breakout level is a low-volume node rather than a high-volume node |
| Stop Loss | Placed at the breakout candle's low (for a long breakout) or high (for a short breakdown), consistent with the general breakout framework |
| Initial Profit Target | The next high-volume node above the breakout point, which tends to act as a natural resting place for price rather than an arbitrary measured-move distance |
| Trade Management | If volume pace slows sharply after the breakout — the stock stops trading at an elevated relative pace — treat this as reduced conviction even if price hasn't reversed yet |
| Invalidation Criteria | OBV shows a clear divergence against the breakout direction at the time of the break, or the breakout immediately runs into a nearby high-volume node rather than clearing space |
This setup asks more of a breakout than the general checklist does — it's a stricter filter intended for the highest-conviction setups, not a replacement for the simpler volume-spike check that still applies to every breakout regardless of whether the deeper reads are available.
A Walk-Through: Reading Volume in Three Layers
Picture a mid-cap technology stock — call it ABC, trading around $68 — approaching $70 resistance that's been tested twice over the past two weeks. By 10:30 AM ET, the stock has already traded 45% of its 20-day average full-session volume — a fast pace suggesting an unusually active day already underway.
OBV has been rising steadily for the past four sessions, even during a period when price was relatively flat under $70 — a sign of accumulation building ahead of the visible breakout attempt. Checking the volume profile shows a high-volume node clustered right around $69.50–$70.00 (unsurprising, since that's exactly where the stock has been consolidating), but a clear low-volume node between $70.50 and $72.00, left over from a fast move through that zone several weeks earlier.
At 11:15 AM, ABC clears $70 on a 5-minute candle with volume at 2.4x the recent average. All three checks align: the volume spike, the confirming OBV trend, and a clear low-volume node immediately ahead rather than another wall of prior volume. The trade targets the next high-volume node near $72.50, where the stock is more likely to find real resistance again.
Now picture the same breakout candle occurring with OBV having been flat or drifting down over the preceding sessions, and a dense high-volume node sitting just $0.50 above the breakout point. Even with an identical breakout candle and volume spike, the deeper reads suggest a much lower-conviction setup — one where the general checklist's volume check passes, but the added layers in this guide suggest real caution.
Where This Approach Breaks Down
The most common misuse is treating OBV's absolute level, rather than its slope and divergence pattern, as meaningful. OBV's specific numerical value depends entirely on an arbitrary starting point and carries no meaning on its own — only the trend direction and whether it agrees with price actually matters.
It also breaks down on thinly traded stocks, where both OBV and volume profile become noisy and less reliable. A stock with genuinely low average volume doesn't have enough historical trading activity to build a meaningful profile of high- and low-volume nodes, and its OBV line can whipsaw on a handful of large orders that say little about broader participation.
And it fails when a trader waits for every layer to align perfectly before ever taking a trade. The three-layer approach in this guide is a way to add conviction to the strongest setups, not a requirement for every breakout — the simpler volume-spike check from the general breakout checklist remains a reasonable standalone filter when the deeper reads aren't clearly available or conclusive.
Tools for Reading Volume in Real Time
Manually tracking volume pace, OBV trend, and volume profile structure across a watchlist isn't practical without the right charting tools.
A platform like TradingView includes built-in OBV and volume profile overlays that make these deeper reads accessible without manual calculation, while a scanner like Trade Ideas can flag stocks running at an elevated relative volume pace in real time, narrowing a broad watchlist down to the names where a volume-confirmed breakout is more likely to be developing.
Where This Fits a Complete Trading Plan
This deeper volume analysis is meant to sit on top of the general breakout vs. fakeout checklist, adding conviction to the highest-quality setups rather than replacing the simpler volume check that applies to every breakout. For anyone who needs the underlying concept of volume and liquidity refreshed before applying these more advanced reads, that foundational guide is worth reviewing first.
For the rest of the breakout and breakdown setups this guide complements, the Strategies Hub organizes the full library by market condition.
Frequently Asked Questions About Volume Breakout Confirmation
How is this different from the simple volume check in the general breakout checklist?
The simple check — is the breakout candle's volume meaningfully above average — remains a reasonable standalone filter and still applies here. The additional layers in this guide are for situations where extra conviction is worth the additional analysis, not a replacement for the baseline check.
Key Takeaway: Use the simple volume-spike check as the baseline for every breakout, and add these deeper reads when extra conviction is needed.
What is volume pace, and why does it matter more than a single candle's volume?
A stock running well ahead of its normal volume pace by mid-morning suggests unusually high participation for that entire session, which is a broader and often more reliable signal than the volume on any single 5-minute bar considered in isolation.
Key Takeaway: Check how much of the average session volume has already traded, not just the volume on the specific breakout candle.
What does On-Balance Volume actually measure, and why does its absolute value not matter?
Because OBV's absolute level is arbitrary, comparing OBV values between different stocks, or treating a specific OBV number as meaningful on its own, misunderstands how the indicator is meant to be used. What matters is whether OBV is trending in the same direction as price and whether that trend has been consistent leading into a breakout.
Key Takeaway: Judge OBV by its trend and divergence pattern, never by its raw numerical value.
What is OBV divergence, and why is it a warning sign?
A breakout accompanied by this kind of divergence is breaking a level on weaker underlying participation than the price action alone suggests, which is exactly the kind of gap between appearance and substance the general breakout checklist's volume check is trying to catch — OBV divergence is a more specific version of that same concern.
Key Takeaway: Treat an OBV divergence at the moment of a breakout as a reason for added caution, even if the breakout candle's own volume looks acceptable.
What's the difference between a high-volume node and a low-volume node?
This distinction comes from volume profile, which maps volume by price level rather than by time period. A breakout heading toward a nearby high-volume node faces more resistance than one heading toward a low-volume node, since the high-volume node represents a price where many participants already have an established interest.
Key Takeaway: Check what lies immediately beyond a breakout level on the volume profile — a low-volume node offers a more open path than a high-volume node.
Does this approach work on stocks with low average daily volume?
A stock with low typical volume can see its OBV line whipsaw based on a handful of large orders that don't reflect genuine broad participation, and its volume profile may not have enough historical data to produce meaningful high- and low-volume nodes.
Key Takeaway: Reserve the deeper volume reads in this guide for liquid stocks with substantial average daily volume.
Should every breakout wait for volume pace, OBV, and volume profile to all align before entering?
The baseline volume-spike check from the general breakout checklist remains sufficient for many setups. The three-layer approach in this guide is best reserved for situations where the added analysis is available and where extra confidence is specifically valuable, such as sizing up a position beyond a standard size.
Key Takeaway: Treat these deeper reads as a way to add conviction on the strongest setups, not a requirement that blocks otherwise valid trades.
Why does academic research on volume and price changes matter for a practical trading decision?
This doesn't mean every individual volume-confirmed breakout will succeed, since the academic research describes a general statistical tendency across markets rather than a guarantee for any specific stock on any specific day. It does mean the underlying logic behind checking volume has real grounding, rather than being an arbitrary rule of thumb.
Key Takeaway: Use the academic research as confidence that the underlying logic is sound, not as a promise about any individual trade's outcome.
Can volume profile nodes from weeks or months ago still matter for a breakout today?
A composite volume profile built over a longer lookback period can reveal structural levels that a short-term, single-session profile would miss entirely. Checking both a recent, shorter-term profile and a longer composite view can surface nodes that matter for a current breakout despite having formed well in the past.
Key Takeaway: Consider a longer-term composite volume profile alongside a shorter-term one, since older nodes can still be structurally relevant.
How does this three-layer approach change position sizing compared to a standard breakout?
This isn't a formal, quantified sizing formula — it's a qualitative adjustment reflecting that a more thoroughly confirmed setup carries a different risk profile than one confirmed by a single check alone. Sizing should still respect the same stop-loss and account-risk rules regardless of how many layers of volume confirmation are present.
Key Takeaway: Let stronger multi-layer confirmation support a larger size within normal risk limits, not an exception to standard stop-loss discipline.
Disclaimer
Article Sources
- Karpoff, J. M. (1987). "The Relation Between Price Changes and Trading Volume: A Survey." Journal of Financial and Quantitative Analysis, 22(1), 109–126. — the foundational academic survey establishing the empirical relationship between volume and price change magnitude referenced throughout this guide.
- On Balance Volume (OBV) — StockCharts ChartSchool - documents the OBV formula, its origin with Joseph Granville, and its use in confirming trends and spotting divergence.chartschool.stockcharts.com
- Volume Profile Indicators: Basic Concepts — TradingView - explains the Point of Control, Value Area, and high/low volume node concepts referenced in this guide's volume profile section.tradingview.com