
The Initial Balance (IB) Trading Strategy: First-Hour Edge


In this article8 sections
By 10:30 AM, the market has already told a trader most of what they need to know about the rest of the day, if they know where to look. Not through a single indicator, but through the shape of the range itself: how wide it is, whether price is extending beyond it, and how convincingly. Floor traders who developed Market Profile decades ago called that first-hour range the Initial Balance, and the read it offers is still one of the more reliable, underused edges available before lunch.
This is a broader, slower framework than a single breakout trade. Where the Opening Range Breakout strategy is a discrete, mechanical entry technique, the Initial Balance is a lens for classifying the entire day's likely character, trend, range, or something in between, and using that classification to size and manage trades for the rest of the session.
What is the Initial Balance in trading? The Initial Balance is the price range established during the first 60 minutes of the regular session (traditionally the first two 30-minute TPO periods in Market Profile), used to judge whether a day is likely to trend, stay range-bound, or extend meaningfully beyond that early range.
Why the First Hour's Range Predicts More Than It Seems To
The Initial Balance isn't a magic number. It's a read on how much genuine disagreement exists between buyers and sellers in the session's most information-dense hour, and that disagreement tends to resolve in identifiable patterns as the day continues.
A narrow Initial Balance suggests the market found a price both sides were reasonably comfortable transacting at quickly, which often precedes a trend day as the balance gets tested and broken in one direction with real conviction. A wide Initial Balance suggests genuine, ongoing disagreement about value, which more often precedes a choppier, range-bound day as the market continues working out where it actually wants to be. Neither pattern is a guarantee, but the tendency is consistent enough to build a real framework around.
This is where Market Profile's classic day-type taxonomy earns its keep, four categories that describe how a session tends to unfold relative to its Initial Balance:
- Normal Day: Price stays entirely within the Initial Balance range, or extends only slightly beyond it. Low conviction on both sides; often a lower-opportunity day for range extension strategies.
- Normal Variation Day: Price extends beyond the Initial Balance by roughly the same size as the IB itself, in one direction, and then holds. A moderate, single-direction extension.
- Trend Day: Price extends well beyond the Initial Balance and keeps going, often closing near the extreme of the day's range. The highest-opportunity day type for range-extension trend trades.
- Neutral Day: Price extends beyond the Initial Balance in both directions before the session ends, testing and rejecting both extremes. A choppier, harder-to-trade day type that often traps directional bets made too early.
The Range Extension Setup Specification
The core tradable idea built on the Initial Balance is the range extension: trading the break of the IB itself once the day's character starts confirming which type it's likely to become.
- Component
- Market Conditions Required
- Rule
- Initial Balance fully formed (first 60 minutes complete); no major scheduled data release imminent that could distort the read
- Component
- Time of Day
- Rule
- No entries before 10:30 AM ET; most reliable extension signals develop 10:30 AM to 12:30 PM
- Component
- Stock Selection Criteria
- Rule
- Liquid index ETFs (SPY, QQQ) or large, actively-traded single names where relative volume is running at or above average through the first hour
- Component
- Entry Trigger
- Rule
- A 5-minute candle closes beyond the Initial Balance high or low with volume clearly above the IB-period average, confirming genuine extension rather than a brief poke
- Component
- Stop Loss
- Rule
- Back inside the Initial Balance range, typically at the midpoint or a recent higher low/lower high formed just outside it
- Component
- Initial Profit Target
- Rule
- A minimum of one full Initial Balance range-width beyond the extension point (the classic Normal Variation Day target), trailed further if the day is confirming as a Trend Day
- Component
- Trade Management
- Rule
- Reassess the day-type read after each 30-minute period; a second, opposite-direction extension is the Neutral Day signal to exit and stand down
- Component
- Invalidation Criteria
- Rule
- Price re-enters and holds back inside the Initial Balance range after the extension attempt
| Component | Rule |
|---|---|
| Market Conditions Required | Initial Balance fully formed (first 60 minutes complete); no major scheduled data release imminent that could distort the read |
| Time of Day | No entries before 10:30 AM ET; most reliable extension signals develop 10:30 AM to 12:30 PM |
| Stock Selection Criteria | Liquid index ETFs (SPY, QQQ) or large, actively-traded single names where relative volume is running at or above average through the first hour |
| Entry Trigger | A 5-minute candle closes beyond the Initial Balance high or low with volume clearly above the IB-period average, confirming genuine extension rather than a brief poke |
| Stop Loss | Back inside the Initial Balance range, typically at the midpoint or a recent higher low/lower high formed just outside it |
| Initial Profit Target | A minimum of one full Initial Balance range-width beyond the extension point (the classic Normal Variation Day target), trailed further if the day is confirming as a Trend Day |
| Trade Management | Reassess the day-type read after each 30-minute period; a second, opposite-direction extension is the Neutral Day signal to exit and stand down |
| Invalidation Criteria | Price re-enters and holds back inside the Initial Balance range after the extension attempt |
The Trade Management row matters more here than in a typical single-trigger setup, because this framework is explicitly about updating a read as the day develops rather than committing to one interpretation at 10:31 AM and holding it regardless of what price does afterward.
Case Study: Reading a Trend Day Through Its Initial Balance
Consider a scenario on QQQ during a session following a strong overnight tech-sector catalyst. The first 60 minutes (9:30 to 10:30 AM) form an Initial Balance between $385.20 and $386.90, a $1.70 range, relatively narrow given the size of the catalyst behind the move, an early hint that conviction may be one-sided rather than genuinely contested.
At 10:45 AM, a 5-minute candle closes above $386.90 on volume clearly exceeding the IB-period average. That's the extension trigger. Entry at $387.05, stop back inside the range near the midpoint at $386.05, for $1.00 of risk per share. The initial target, one full IB range-width beyond the extension ($1.70), sits at $388.60, consistent with a Normal Variation Day outcome.
QQQ clears that target by 11:30 AM and keeps extending through the early afternoon without ever testing back into the Initial Balance range, upgrading the day-type read from Normal Variation to a genuine Trend Day. Trade management shifts accordingly: rather than taking the first target and walking away, the position trails using rising lows, consistent with holding through what the day is now confirming itself to be.
Where the Initial Balance Framework Breaks Down
The most common failure is treating a narrow Initial Balance as an automatic trend-day signal. A narrow IB raises the odds of a trend day; it doesn't guarantee one, and plenty of narrow-IB sessions still resolve as Normal Days with no meaningful extension at all. Entering an extension trade purely because the IB looked tight, without the volume confirmation in the setup spec, is how this framework's most common losing trade happens.
A second failure is misreading a Neutral Day as a Trend Day in progress. An extension in one direction that later gets fully reversed and extended in the other direction is the Neutral Day signature, and it specifically punishes traders who held a directional position through the first extension without respecting the invalidation criteria once price reclaimed the Initial Balance range.
A third, more structural failure shows up on days with a scheduled economic release landing after the Initial Balance has already formed. A surprise CPI print at 10:00 AM, for instance, can distort the entire read, since the IB itself was formed under different conditions than the ones now driving price. Checking the economic calendar before trusting an IB-based read is a required step, not optional.

Where the Initial Balance Fits Alongside the ORB
The Initial Balance and the Opening Range Breakout are frequently confused because they both use an early-session price range as their foundation, but they answer different questions. The ORB variants covered in the dedicated ORB guide are discrete, mechanical breakout trades on a fixed 5, 15, or 30-minute window, built for a single specific entry. The Initial Balance is a full-hour framework for classifying the day itself, and the range extension trade above is a slower-developing, higher-context setup on top of that classification.
In practice, a trader might take a 15-minute ORB trade at 9:50 AM using that guide's rules, and separately use the same stock's full Initial Balance, formed by 10:30 AM, to decide whether to add to that position, stand aside, or look for a genuinely different range extension trade an hour later. They're complementary tools reading the same early session at two different resolutions, not competing versions of the same idea. Market Profile traders who want the deeper mechanics behind value area and point of control, the concepts this framework builds on, can find the foundational treatment in this hub's Market Profile strategy guide.
Tools for Tracking the Initial Balance in Real Time
Plotting the Initial Balance range and watching for a volume-confirmed extension in real time benefits from a platform that can auto-mark session ranges and alert on a genuine break, rather than eyeballing it on a plain candlestick chart. Trade Ideas supports custom alerts built around a defined early-session range, which turns the extension trigger into a notification rather than a manual watch.
Building the Initial Balance Into a Full Trading Plan
The Initial Balance read is most valuable as context that shapes how aggressively the rest of the day gets traded, not as a single, isolated setup. A confirmed Trend Day read supports holding Golden Hour momentum trades longer and sizing afternoon continuation setups with more confidence. A confirmed Neutral or Normal Day read supports exactly the opposite: tighter targets, smaller size, and a faster shift toward the fading tactics covered in the midday chop playbook.
Initial Balance Trading FAQs
How is a narrow Initial Balance actually measured, since "narrow" is relative to the stock?
An IB running at roughly a third or less of the stock's typical daily range is considered narrow under this framework; one running at half or more of the typical daily range is considered wide. Comparing against the stock's own history, rather than an absolute number, is what makes the read meaningful across very different stock types.
Key Takeaway: Always benchmark Initial Balance width against that specific stock's own recent range, never against a flat threshold.
What's the practical difference between trading a Normal Variation Day and a full Trend Day using this framework?
The distinction only becomes clear as the day develops, which is why the Trade Management row calls for reassessing the read after each 30-minute period rather than committing to one outcome at the moment of the first extension.
Key Takeaway: Treat the first extension as an open question about day type, not a settled answer, and update the plan as price confirms or denies it.
Why does this setup require volume confirmation on the extension candle specifically?
A volume-confirmed extension reflects genuine, size-backed participation pushing price beyond the range that formed the IB, which is a meaningfully stronger signal than a thin, easily-reversed print through the same level.
Key Takeaway: An extension without volume confirmation is a poke, not a signal; wait for the volume to confirm it.
How does a Neutral Day specifically punish a trader who ignores the invalidation criteria?
The invalidation criteria, price re-entering and holding back inside the Initial Balance, exists specifically to exit that first directional bet before the Neutral Day reversal does the damage instead. Respecting that exit is what separates a manageable, small loss from a full round-trip loss on both sides of the day.
Key Takeaway: Respecting the invalidation criteria on the first extension is what protects against getting caught on both sides of a Neutral Day.
Does the Initial Balance framework work the same way on a stock with no clear catalyst that day?
This framework works best applied to index ETFs at all times, and to individual stocks specifically on days when they have a real, identifiable reason to be in play, similar to the catalyst requirement used throughout this hub's other morning setups.
Key Takeaway: The Initial Balance framework is most reliable on index ETFs or on individual stocks with a confirmed catalyst that day.
Can the Initial Balance framework be combined with the failed-breakout reversal setup from the midday playbook?
Recognizing by late morning that a session is shaping up as a Normal or Neutral Day, rather than waiting until 11:00 AM to notice the chop has already started, gives a trader more lead time to prepare the fading tactics that playbook describes.
Key Takeaway: An early Normal or Neutral Day read is a useful heads-up that midday fading setups are likely to outperform breakout setups that afternoon.
What's the honest track record for range extension trades based on the Initial Balance?
The broader logic, that early-session range width carries information about the rest of the day, has intuitive and observational support going back to Market Profile's original development, but a precise, citable win rate for this specific extension trade would mean inventing a number this guide can't actually back.
Key Takeaway: Treat the day-type framework as a well-observed lens for context, not a strategy with a documented, guaranteed win rate.
Disclaimer
Article Sources
- Chapman University: Revisiting the U-shaped Patterns in Volatility and Price Impacts - research on the intraday volume and volatility curve relevant to why the first hour carries outsized informational weight.
- Heston, Korajczyk, Sadka: Intraday Patterns in the Cross-section of Stock Returns - academic research on systematic intraday return patterns relevant to how early-session behavior relates to the rest of the day.
- CME Group: Education - CME Group's market education resources, including material on Market Profile concepts originally developed on the CBOT trading floor.
Was this helpful?
Be the first to weigh in

Written by
Kazi Mezanur RahmanFounder, independent researcher, and editor of DayTradingToolkit. A one-person publication focused on risk-first trading education and documented tool research. He trades his own capital as a retail trader and combines personal market experience with systematic primary-source research.
Keep Reading

Strategies
Trading the Breakout of Prior-Day High/Low Levels
PDH and PDL need no formula, just yesterday's range. This guide covers the breakout, the liquidity-sweep fade, and why stops cluster right at these levels.

Strategies
Trading Breakouts From Consolidation: The Volatility Contraction Pattern
The VCP isn't just a volatility squeeze. This guide covers the staged contraction sequence, the pivot point, and why context matters as much as the pattern.
Strategies
The 52-Week High Breakout Strategy: Trading Stocks at New Highs
Investors anchor on the 52-week high, and that bias is exactly why breaking it carries real weight. This guide covers the research and trading the breakout.
Strategies
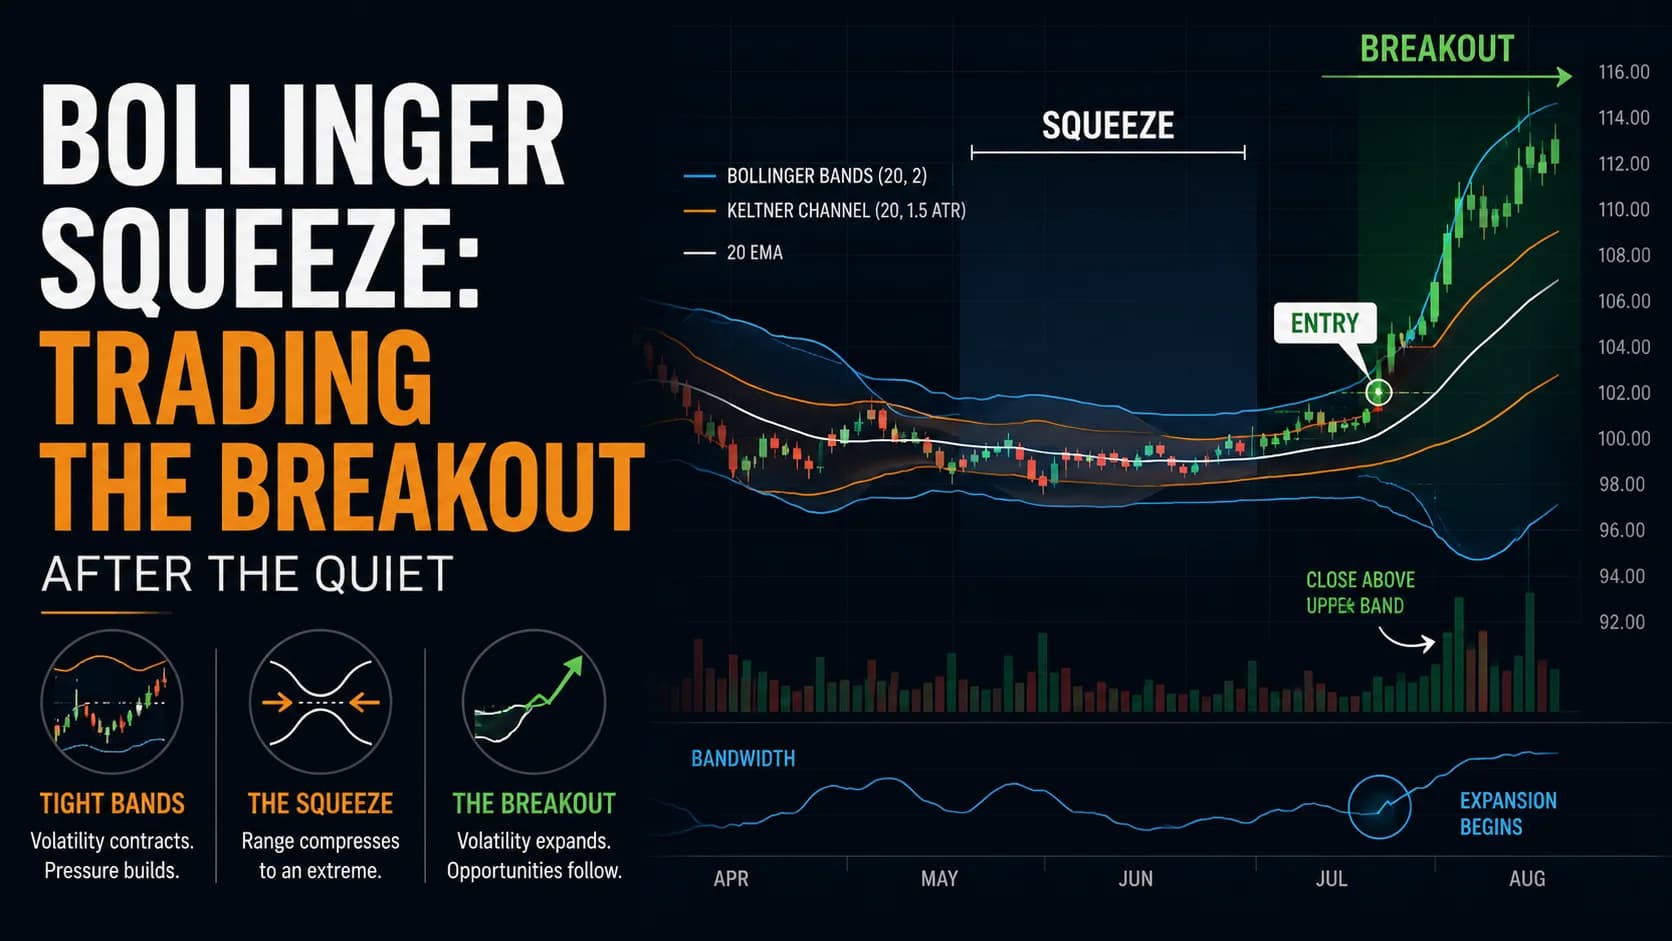
The Bollinger Band Squeeze Strategy: Trading Volatility Compression
Tight Bollinger Bands signal a coiled market. This guide covers measuring real squeeze compression, trading the breakout direction, and avoiding false starts.
Comments
No comments yet. Be the first to share your thoughts.