
The Trader's Playbook: How to Day Trade the Market Open


In this article11 sections
The first 60 minutes after the 9:30 AM ET bell moves more volume than almost any other stretch of the trading day, and it does it while spreads are still settling and stops are still getting hunted. DayTradingToolkit calls this window the Golden Hour. It's where the day's primary trend usually gets decided, and it's also where undisciplined size and impulsive entries do the most damage to an account.
The difference between those two outcomes isn't speed or reflexes. It's having one clean, repeatable framework for reading the first hour, built before the bell rings rather than improvised in real time once it does.
What is the Golden Hour in day trading? The Golden Hour is DayTradingToolkit's term for the first 60 minutes of the regular session (9:30 to 10:30 AM ET), when institutional order flow, overnight news, and the day's highest retail participation combine to produce the session's heaviest volume and its clearest early trend signals.
Why the First Hour Trades Differently From the Rest of the Day
The open isn't just randomly chaotic. Three forces converge in that first hour and then fade as the day goes on:
Institutional order flow front-loads here. Large funds routing sizable orders often execute a meaningful portion of their daily volume in the first hour, rather than spreading it evenly across the session. Overnight and pre-market information gets digested for the first time at full liquidity: news, earnings reactions, and economic data that traded thin before 9:30 AM finally meets the market's real depth. And participation peaks. More traders are watching their screens in the first hour than at almost any other point in the day, which means both genuine conviction and pure emotional reaction are running at full volume simultaneously.
This isn't a hunch. Academic research on intraday trading patterns has repeatedly found that volume and volatility both trace a U-shape across the session, elevated at the open, quieter in the middle hours, elevated again near the close. The practical version of that finding is simple: the setups that work during the Golden Hour lean on volume and momentum in a way that midday setups usually can't, because the volume simply isn't there to lean on for most of the session's middle stretch.
Building a Watchlist Before the Opening Bell Rings
Trying to trade the open by watching the entire market is a losing game before the bell even rings. This approach works on a small, curated list of stocks that are actually "in play" that morning, built in the twenty to thirty minutes before 9:30 AM.
The screening checklist:
- Relative volume, not absolute volume. Look for pre-market volume running at least 2 to 3 times a stock's normal pre-market pace. A stock moving on unusually heavy participation is telling you something a quiet mover isn't.
- An identifiable catalyst. Earnings, news, an analyst action, a sector-wide move. A stock gapping for a clear, nameable reason behaves more predictably than one gapping for no reason anyone can point to.
- Clean air on the daily chart. A stock gapping directly into a major prior support or resistance level tends to chop and stall right at that level rather than trend cleanly. Stocks with open room above or below the gap trend more reliably in the first hour.
- A short list. Narrow the scan down to three to five names. More than that and decision paralysis becomes the actual risk, not the market.
For each name on the list, mark the pre-market high and low before the bell rings. Those levels, and the fresh ones the first few minutes of the regular session add on top of them, are the map for everything that follows.
The Opening Range Breakout Setup Specification
The single most useful tool for reading the first minutes of the regular session is the opening range: the high and low established in a defined window right after 9:30 AM. That range represents the initial tug-of-war between buyers and sellers, and which way it breaks is one of the clearest early trend signals the first hour offers.
DayTradingToolkit's default version of this setup uses the first 15 minutes of trading (9:30 to 9:45 AM ET) to define the range, then trades the break of it. The table below is the mechanical spec for the continuation version of that trade.
- Component
- Market Conditions Required
- Rule
- No major scheduled data release (CPI, FOMC, jobs report) within the first hour; broad market (SPY/QQQ) not in a violent, one-directional opening move that overrides individual stock signals
- Component
- Time of Day
- Rule
- Range forms 9:30 to 9:45 AM ET; entries taken 9:45 to 10:15 AM ET only
- Component
- Stock Selection Criteria
- Rule
- From the pre-built watchlist only: confirmed catalyst, relative volume at least 2x normal, price above $10
- Component
- Entry Trigger
- Rule
- 1-minute candle closes beyond the 15-minute range high (long) or range low (short), on volume visibly higher than the preceding 15-minute average
- Component
- Stop Loss
- Rule
- At the midpoint of the opening range, not at the opposite extreme, to keep risk proportional to the range's own width
- Component
- Initial Profit Target
- Rule
- Scale out in thirds: first third at 1:1 reward-to-risk, second third at 2:1, final third trailed
- Component
- Trade Management
- Rule
- Move stop to breakeven only after the first scale-out target is hit, never before
- Component
- Invalidation Criteria
- Rule
- Price closes back inside the opening range after the breakout, or the breakout candle prints on volume no higher than the range-forming candles
| Component | Rule |
|---|---|
| Market Conditions Required | No major scheduled data release (CPI, FOMC, jobs report) within the first hour; broad market (SPY/QQQ) not in a violent, one-directional opening move that overrides individual stock signals |
| Time of Day | Range forms 9:30 to 9:45 AM ET; entries taken 9:45 to 10:15 AM ET only |
| Stock Selection Criteria | From the pre-built watchlist only: confirmed catalyst, relative volume at least 2x normal, price above $10 |
| Entry Trigger | 1-minute candle closes beyond the 15-minute range high (long) or range low (short), on volume visibly higher than the preceding 15-minute average |
| Stop Loss | At the midpoint of the opening range, not at the opposite extreme, to keep risk proportional to the range's own width |
| Initial Profit Target | Scale out in thirds: first third at 1:1 reward-to-risk, second third at 2:1, final third trailed |
| Trade Management | Move stop to breakeven only after the first scale-out target is hit, never before |
| Invalidation Criteria | Price closes back inside the opening range after the breakout, or the breakout candle prints on volume no higher than the range-forming candles |
The stop placement at the range midpoint, rather than the far side of the range, is worth explaining rather than just stating. Placing a stop at the opposite extreme of the range gives a trade more room to be wrong, but it also means a full round-trip of the range has to happen before the setup is invalidated, by which point the original thesis is usually already dead. A midpoint stop accepts a smaller cushion in exchange for cutting a failing trade closer to where it actually starts failing.
Case Study: A Golden Hour Breakout From Range to Target
Picture a mid-cap industrial name, call it ticker XYZ, gapping up 4% in pre-market trading on a new contract announcement. It clears the watchlist screen: real catalyst, relative volume running well above normal, and clean air above the gap on the daily chart.
Between 9:30 and 9:45 AM, XYZ prints a high of $182.00 and a low of $180.50, a $1.50 range. After a few minutes of quiet consolidation just under the highs, XYZ breaks firmly above $182.00 at 9:52 AM on a volume spike well above the range-forming candles.
The trigger is met: entry at $182.10. The stop goes at the range midpoint, $181.25, for $0.85 of risk per share. On a $9,000 max risk-per-trade budget at this account size, that's roughly 105 shares. The first scale-out target at 1:1 sits at $182.95, the second at 2:1 sits at $183.80, and the final third rides with a trailing stop under each new higher low.
XYZ clears both scale-out levels inside the next twenty minutes and continues drifting higher into 10:30 AM before the trailing stop catches the position on a pullback. That's the setup working as designed: a defined range, a volume-confirmed trigger, and a scaling plan that locks in progress instead of gambling the entire position on one exit price.
Managing Size and Stops Once the Trade Is Working
The setup spec above covers entry, but what happens in the ten minutes after entry is where most of the actual skill in this playbook lives.
Scaling out in thirds does two things at once: it locks in real progress before the trade has a chance to give it back, and it keeps a trader in the position long enough to catch a genuinely strong move without needing to guess the exact top. The mistake to avoid is moving a stop to breakeven immediately after entry out of nerves. Doing that before the first scale-out target is hit tends to just get a working trade stopped out on normal, healthy pullback noise, the exact kind of price action a real breakout regularly produces on its way to a bigger move.
Where a Golden-Hour Breakout Trade Goes Wrong
This setup has specific, identifiable failure conditions rather than generic market risk.
The most common failure is trading a breakout with no volume behind it. A 1-minute close above the range high that isn't accompanied by a visible volume spike is frequently just price drifting past a level on light participation, and those breakouts fail at a meaningfully higher rate than volume-confirmed ones. The setup spec's volume requirement on the trigger candle exists specifically to filter this out, and skipping it for a stock that "looks ready" is the single most common way this playbook loses money.
A second failure mode shows up on days with a scheduled macro release inside the first hour. A CPI print or an FOMC statement can override every individual stock's opening range in seconds, turning a clean-looking breakout into instant chop as the whole market reprices around the headline. Checking the economic calendar before building the morning watchlist is not optional.
A third, quieter failure is trading too many names at once. The three-to-five-stock watchlist limit exists because managing more positions than that during the fastest-moving hour of the day degrades decision quality on every single one of them, even the ones that would have worked in isolation.
The Failed Breakout: Trading the Opening Range Reversal
Not every range break continues. A meaningful subset of them fail immediately and reverse hard, and that failure is its own tradable setup rather than just noise to avoid.
The pattern: a stock breaks above (or below) its opening range, stalls almost immediately instead of accelerating, then trades back through the breakout level in the opposite direction. That's a trapped-breakout signature. Traders who bought the initial break are now underwater, and their stop-losses, which become market sell orders once triggered, add fuel to the reversal as they're forced out.
Consider a large-cap pharmaceutical name, ticker ABC, gapping down slightly on mixed clinical trial news but showing unusually heavy pre-market volume. Its opening range prints a high of $35.50 and a low of $35.00. At 9:48 AM, ABC breaks below $35.00, looking like a clean short. But the move doesn't follow through. By 9:52 AM, ABC has reclaimed $35.00 and then breaks above $35.50, the top of the original range entirely, a total failure of the short thesis and a signal that the sellers who pushed the initial breakdown are now trapped.
The reversal trade goes long on the reclaim of the range high, with a stop below the failed breakdown low and a target measured as a multiple of the failed range's width. This is a lower-frequency setup than the continuation trade above and requires reading the failure to follow through in real time rather than following a single mechanical trigger, which makes it worth adding only after the continuation version of this playbook is second nature.
Beyond the 15-Minute Range: When to Read the Full ORB Playbook
The 15-minute window above is DayTradingToolkit's default because it balances noise-filtering against reaction speed well for most stocks and most traders. It is not the only way to trade an opening range.
A 5-minute range reacts faster and suits smaller, more volatile names where waiting a full 15 minutes means missing most of the move. A 30-minute range filters out more false signals and suits larger, more liquid names where the extra patience pays for itself in fewer failed breakouts. Choosing between these, and combining the opening range concept with the related idea of the session's Initial Balance, is its own deep topic with its own mechanical rules for each timeframe. The full breakdown, including exactly when each variant outperforms the others, lives in the dedicated Opening Range Breakout strategy guide, which is worth reading in full once this article's 15-minute default is comfortable.
Scanning Tools for Building a Golden Hour Watchlist
Manually scrolling a broad market scanner at 9:15 AM to find three to five qualifying names, by the time that process finishes, the bell has usually already rung.
A real-time scanner built for pre-market and opening-bell conditions does this filtering continuously rather than on a manual refresh. Trade Ideas is built specifically to alert on relative volume and gap combinations as they develop, which is the exact filter this playbook's watchlist screen depends on. For a free starting point on pure price movers, Finviz's screener covers the basics, though without the real-time relative-volume alerting that makes the morning screen genuinely fast.
Where the Golden Hour Fits the Rest of Your Trading Day
The Golden Hour is the loudest part of the trading day, not the only part of it. Treating every morning as a mandatory trading morning, regardless of whether any name on the watchlist actually meets the setup spec, is how discipline erodes over time. If nothing on the watchlist forms a clean range and a volume-confirmed break, the correct trade is no trade, full stop.
It's also worth being honest about the literal first few minutes of the session, before the 15-minute range has even formed. Those first prints carry their own distinct risks, thin liquidity, wide spreads, opening-auction noise, that are different from the Golden Hour risks described here. The first 15 minutes playbook covers that narrower window specifically. Once the Golden Hour's momentum has run its course, typically by 10:30 AM, the market usually shifts into a slower, choppier regime, covered in the midday session playbook.
The emotional pull to force a trade during the fastest, loudest hour of the day, just because it's the fastest, loudest hour of the day, is a discipline issue more than a strategy issue, and it belongs with the broader trading psychology and risk material rather than being solved by a setup rule alone.
Golden Hour and Opening Range Breakout FAQs
Why does this playbook use the range midpoint for a stop instead of the opposite side of the range?
Placing the stop at the far side of the range gives more room to be wrong, but by the time price travels that far back through the range, the original breakout thesis is almost always already dead. The midpoint stop accepts a tighter cushion in exchange for a faster, more honest exit.
Key Takeaway: A tighter, midpoint stop reflects when the trade idea actually breaks, not just when the account can no longer tolerate the loss.
How does the opening range breakout differ from the failed-breakout reversal described in this same article?
Both use the same opening range as their reference point, but they trigger on opposite price behavior: a clean, volume-confirmed break for the continuation trade, and a stalled, reclaimed break for the reversal trade. Watching for which pattern actually develops, rather than assuming a breakout automatically continues, is what keeps a trader from fighting the reversal signal.
Key Takeaway: The same range can produce two opposite trades depending on whether the breakout holds or fails.
Why does the watchlist get capped at three to five stocks instead of scanning the whole market live?
The Golden Hour already asks a trader to read volume, price, and range breaks in real time under time pressure. Adding more simultaneous names doesn't add more opportunity so much as it dilutes attention across all of them, including the ones that were genuinely worth trading.
Key Takeaway: A short, high-conviction watchlist outperforms a long, unfiltered one during the fastest hour of the day.
What market condition makes the opening range breakout fail most often?
Price can drift past a range high or low on light participation without any real conviction behind the move, and those low-volume breaks are the setup's single most common failure mode. A scheduled macro release inside the first hour is the other major failure condition, since it can override every individual stock's range in seconds.
Key Takeaway: No volume spike on the trigger candle means no trade, regardless of how clean the range looks.
Should the opening range breakout be traded on every stock on a watchlist, or only the strongest setup?
Making the watchlist is a screening step, not a trading signal on its own. A stock can clear the watchlist criteria and still fail to form a clean range or a volume-confirmed break, in which case the correct move is no trade on that name that morning.
Key Takeaway: Being on the watchlist earns a stock a chance to set up, not an automatic trade.
Why does this playbook default to a 15-minute opening range instead of 5 or 30 minutes?
A 5-minute range reacts faster but produces more false signals on names that take longer to establish real direction. A 30-minute range filters more noise but arrives late enough to miss a meaningful chunk of a fast-moving stock's move. Fifteen minutes is a default, not a universal rule; the full breakdown of when to use each timeframe lives in the dedicated ORB variants guide.
Key Takeaway: The 15-minute default suits most setups; faster and slower variants exist for specific stock types.
How should position size change between the continuation trade and the reversal trade?
The continuation trade has one clear signal: a volume-confirmed break of a defined level. The reversal trade requires judging that an initial break has genuinely failed, which carries more interpretation and, historically, a higher variance of outcomes for traders still building the skill.
Key Takeaway: Size down on setups that require more real-time judgment until the pattern recognition is consistent.
What's the honest win rate for a volume-confirmed opening range breakout?
Broader research on intraday momentum and reversal patterns around the open supports the general logic behind trading a confirmed early break, but translating that into a precise win rate for this exact retail setup would mean inventing a number this guide can't actually back. What the setup spec's filters, catalyst, relative volume, and volume-confirmed trigger, are built to do is stack the odds in the trader's favor, not guarantee a specific outcome.
Key Takeaway: Treat this setup as a framework for finding better odds, not as a strategy with a guaranteed, citable win rate.
Disclaimer
Article Sources
- Chapman University: Revisiting the U-shaped Patterns in Volatility and Price Impacts - research on the U-shaped intraday volume and volatility pattern that makes the opening hour structurally different from the middle of the session.
- Heston, Korajczyk, Sadka: Intraday Patterns in the Cross-section of Stock Returns - academic research on systematic intraday return patterns, relevant background for why early-session price action behaves differently from later in the day.
- Nasdaq: The Nasdaq Opening and Closing Crosses Fact Sheet - explains how the official opening print itself is formed from pre-market order imbalances.
- Price Discovery Without Trading: Evidence from the Nasdaq Preopening - academic research on how pre-market order flow feeds into the price the market actually opens at.
Was this helpful?
Be the first to weigh in

Written by
Kazi Mezanur RahmanFounder, independent researcher, and editor of DayTradingToolkit. A one-person publication focused on risk-first trading education and documented tool research. He trades his own capital as a retail trader and combines personal market experience with systematic primary-source research.
Keep Reading
Strategies
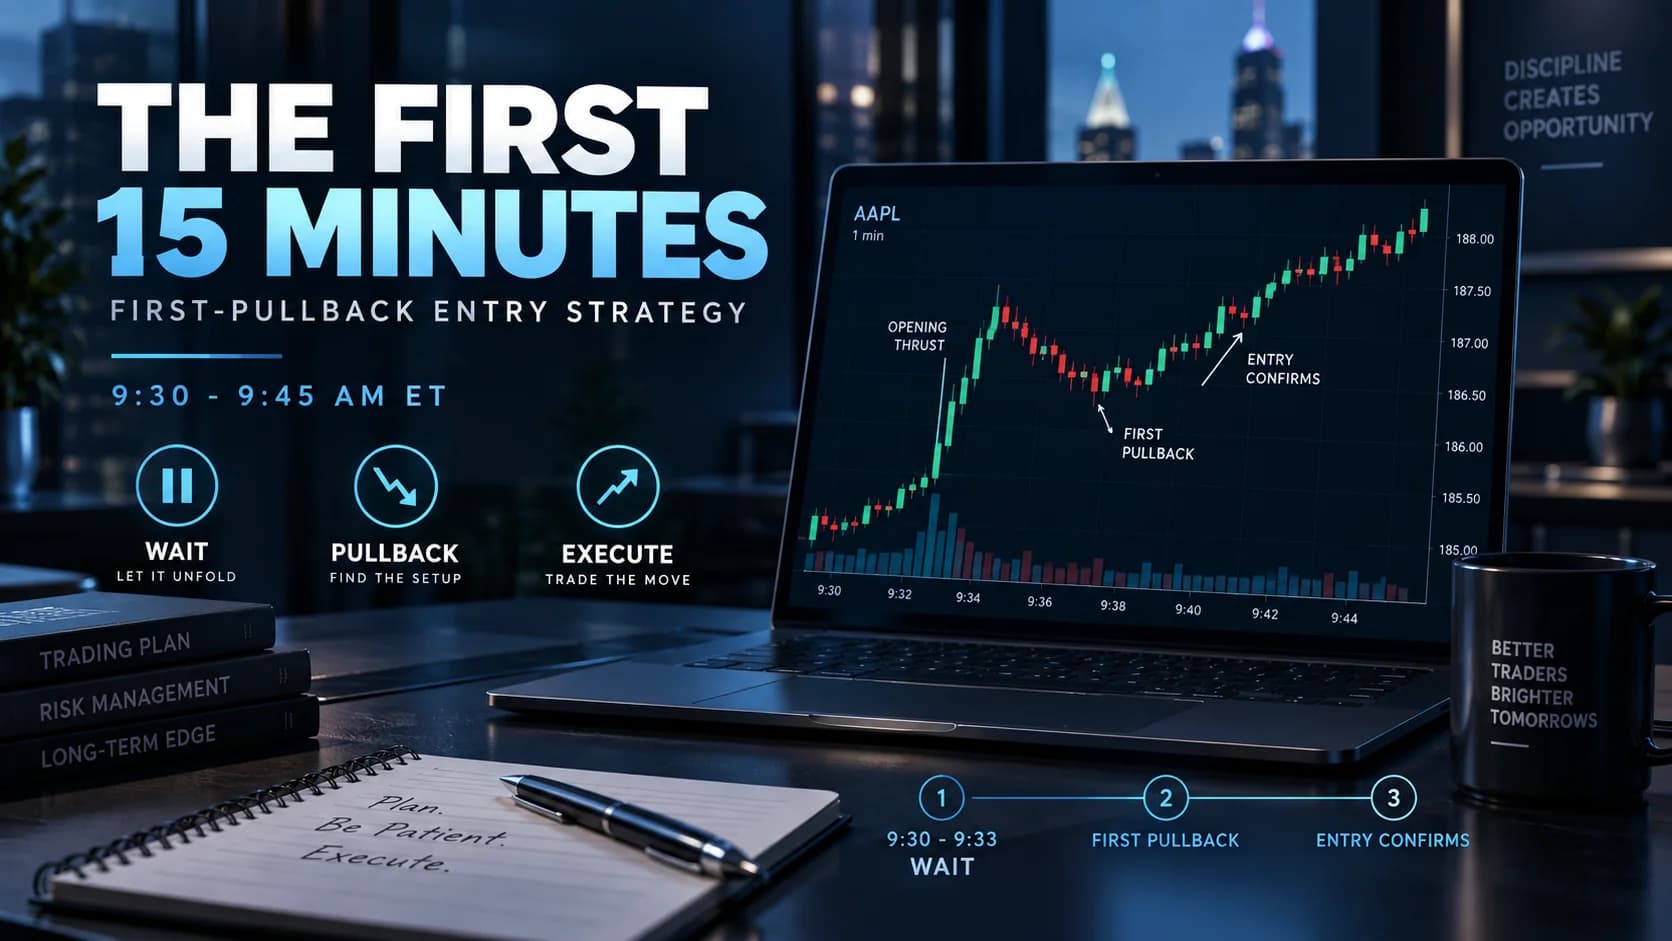
The Trader's Playbook: How to Day Trade the First 15 Minutes
The opening auction leaves an imbalance that takes a few minutes to resolve. This playbook covers what's structurally different about the first 15 minutes and the one pullback setup built around it.

Strategies
Trading the Breakout of Prior-Day High/Low Levels
PDH and PDL need no formula, just yesterday's range. This guide covers the breakout, the liquidity-sweep fade, and why stops cluster right at these levels.
Strategies
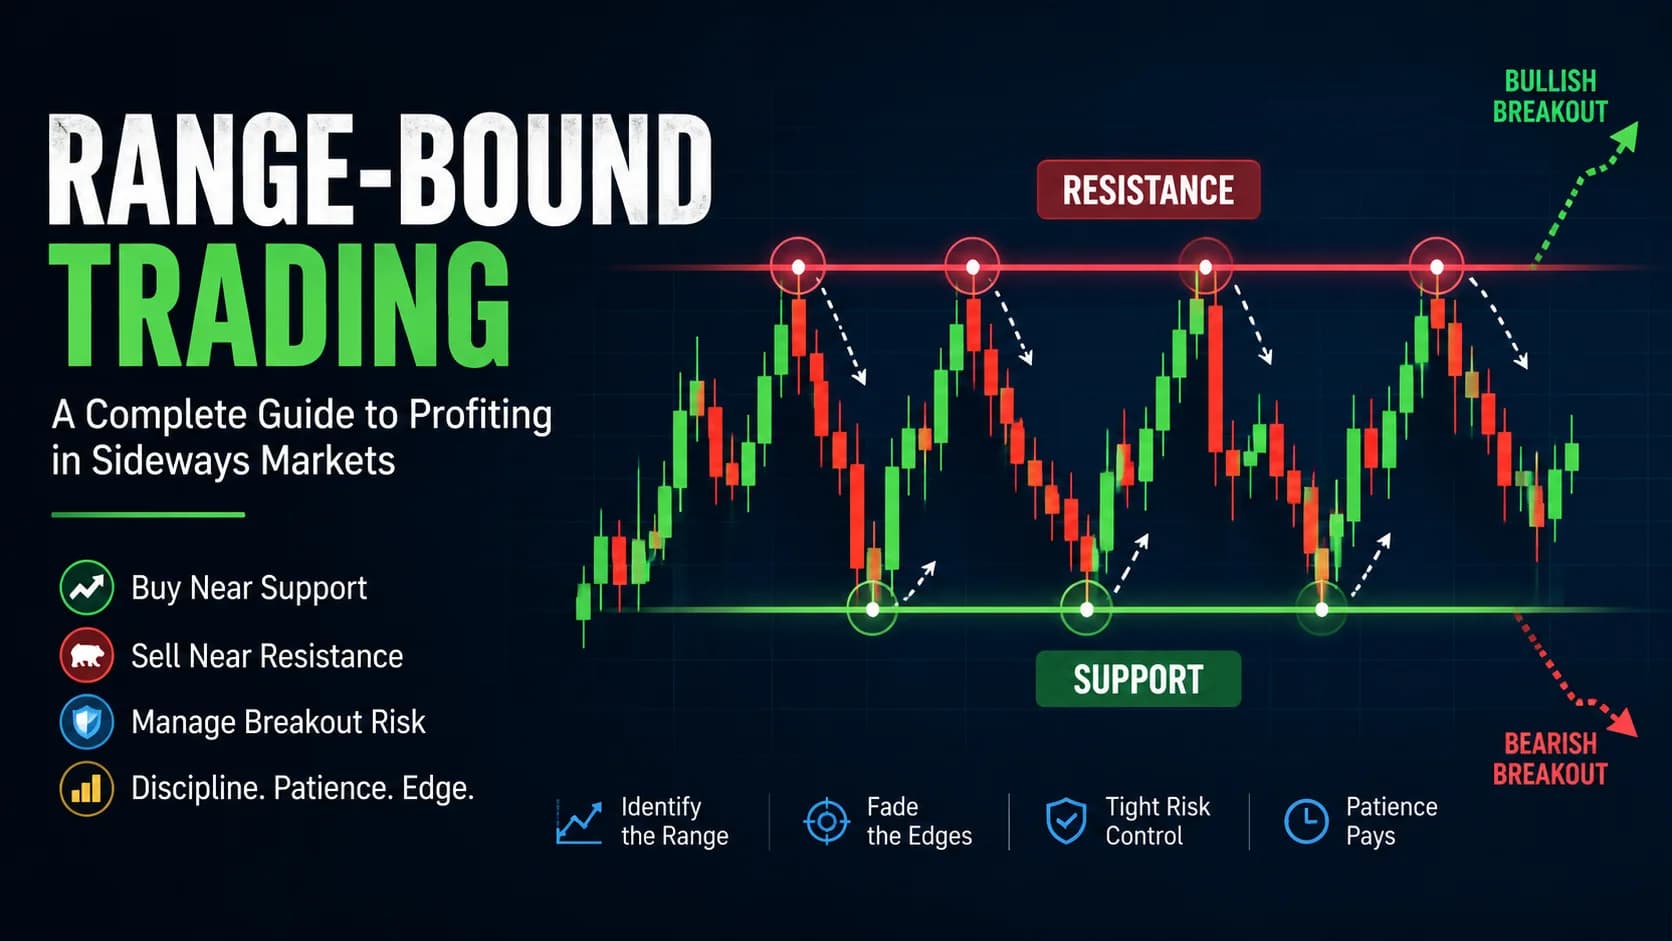
Range-Bound Trading: A Complete Sideways Market Guide
Learn range-bound trading strategies for sideways markets — how to identify a genuine range, fade the edges with confirmation, and manage the breakout risk.

Strategies
The Trader's Playbook: How to Day Trade the Market Close (The Final Hour)
Learn DayTradingToolkit's Power Hour playbook: how to read the day's character, trade the Range Day breakout setup, and why this playbook steps aside before the closing cross.
Comments
No comments yet. Be the first to share your thoughts.