
The Trader's Playbook: How to Day Trade the Market Close (The Final Hour)


In this article10 sections
The trading day has a rhythm: the chaos and opportunity of the market open, the sleepy grind of the midday chop, and then, right as the day seems to be winding down, the real fireworks start. Traders call this stretch Power Hour, and it can turn a mediocre day into a great one, or unravel a great day in minutes.
The volume that goes quiet at lunch comes roaring back for the close, and it comes back for identifiable, structural reasons rather than random excitement. Trading it well means matching a specific play to what kind of day it's actually been, not showing up at 3:00 PM with the same mindset that worked at 10:00 AM.
What is Power Hour in day trading? Power Hour refers to the final 60 to 90 minutes of the regular session, roughly 2:30 to 4:00 PM ET, when institutional order flow, Market-on-Close order imbalances, and short covering combine to produce some of the day's most decisive price moves.
Why Institutional Flow Returns for the Final Hour
Three forces converge as 4:00 PM approaches. Large funds that stepped back during the midday lull return to execute the orders needed to adjust their positions before the close. Market-on-Close orders, instructions to transact at the official closing price, accumulate throughout the afternoon and create growing imbalances that exchanges have to work through. And traders who were positioned earlier in the day, long or short, start closing out ahead of the bell, adding their own directional pressure on top of everything else.
The closing price also carries weight beyond the trading day itself: it's the number that sets the next morning's reference point and shows up in every headline and statement. Institutions and algorithms alike have real incentives to influence where that final print lands, and that competition is a meaningful part of what makes the last hour move the way it does.
The 2:00 PM Pre-Close Routine: Reading the Day's Character
Success in Power Hour gets decided before 3:00 PM, not during it. The routine that matters most is a short, structured read of the day so far, done between roughly 2:00 and 2:30 PM.
The first question is what kind of day it's been. A Trend Day shows consistent higher highs and higher lows (or the mirror image on the downside) with little real pullback. A Range Day rallied or sold off early and then spent the midday hours consolidating sideways. A Reversal Day tried to trend one direction and failed, showing real signs of exhaustion and a potential turn. Each type calls for a different play, covered below.
With that context set, the next step is marking the levels that matter: the high and low of the day, the boundaries of the midday range, VWAP as an institutional benchmark, and the 9 and 20-period exponential moving averages on a 5-minute chart as dynamic reference points. The final step is narrowing focus to three to five stocks showing clean patterns and clear relative strength or weakness against the broader market, the same discipline this hub's market open watchlist uses for the opposite end of the day.
The Range Day Breakout Setup Specification
Of the three day-type plays, the Range Day breakout is the most mechanically reliable and the one worth codifying as a hard setup.
- Component
- Market Conditions Required
- Rule
- Stock spent the midday session (roughly 11 AM to 2 PM) consolidating in a defined, identifiable range after an earlier directional move
- Component
- Time of Day
- Rule
- Entries taken 3:00 to 3:55 PM ET only
- Component
- Stock Selection Criteria
- Rule
- Confirmed relative strength or weakness versus SPY/QQQ; clean, well-respected range boundaries with at least two touches on each side
- Component
- Entry Trigger
- Rule
- High-volume candle closes decisively beyond the range's high-of-day resistance (long) or midday support (short), with volume visibly exceeding the midday average
- Component
- Stop Loss
- Rule
- Just inside the broken range boundary, or at the 9-EMA on the 5-minute chart, whichever is tighter
- Component
- Initial Profit Target
- Rule
- Momentum-managed rather than a fixed level: hold as long as 5-minute candles keep closing in the trade's direction
- Component
- Trade Management
- Rule
- No new entries after 3:55 PM; manually flatten the position by 3:58 PM regardless of where the trade stands
- Component
- Invalidation Criteria
- Rule
- Price closes back inside the range after the breakout, or the breakout candle's volume doesn't clear the midday average
| Component | Rule |
|---|---|
| Market Conditions Required | Stock spent the midday session (roughly 11 AM to 2 PM) consolidating in a defined, identifiable range after an earlier directional move |
| Time of Day | Entries taken 3:00 to 3:55 PM ET only |
| Stock Selection Criteria | Confirmed relative strength or weakness versus SPY/QQQ; clean, well-respected range boundaries with at least two touches on each side |
| Entry Trigger | High-volume candle closes decisively beyond the range's high-of-day resistance (long) or midday support (short), with volume visibly exceeding the midday average |
| Stop Loss | Just inside the broken range boundary, or at the 9-EMA on the 5-minute chart, whichever is tighter |
| Initial Profit Target | Momentum-managed rather than a fixed level: hold as long as 5-minute candles keep closing in the trade's direction |
| Trade Management | No new entries after 3:55 PM; manually flatten the position by 3:58 PM regardless of where the trade stands |
| Invalidation Criteria | Price closes back inside the range after the breakout, or the breakout candle's volume doesn't clear the midday average |
The mandatory 3:58 PM flat time in Trade Management isn't a suggestion. It exists specifically to keep this setup's entries and exits out of the closing cross itself, a separate and much less predictable mechanism covered later in this article.
Case Study: A Range Day Resolving Into a Power Hour Breakout
Here's how this setup played out on a real, dated example: NVIDIA (NVDA) on September 8, 2025.
NVDA gapped up and pushed to a high of $135.00 by 10:30 AM, then spent the next three hours consolidating, a clean Range Day by the checklist above. The 2:00 PM read marked $135.00 as resistance and roughly $133.50 as midday support, with NVDA sitting at the top of the day's watchlist on relative strength and the tightness of its consolidation.
At 3:10 PM, a high-volume candle pushed NVDA decisively through $135.00. Entry at $135.10, stop at $134.40 (below both the breakout level and the 9-EMA), for $0.70 of risk per share. Rather than a fixed target, the position was managed on momentum: holding as long as 5-minute candles kept closing higher, with a planned manual exit by 3:58 PM regardless of price. NVDA trended strongly through the final 45 minutes, and the position closed out at $136.90, a $1.80 gain per share against $0.70 of risk, roughly a 2.6:1 outcome.
That's the Range Day breakout working as designed: a clearly defined range, a volume-confirmed break, and a disciplined exit well ahead of the closing cross rather than an attempt to squeeze out the final few minutes.
Two More Ways the Final Hour Resolves: Trend Continuation and Late-Day Reversal
Not every day sets up as a clean range. Two other patterns cover most of what's left.
Trend Day continuation applies when the market or a stock has trended cleanly with little pullback all session. The setup here is a small, tight flag or pennant forming near the day's high, with the trade being the breakout of that flag as volume surges after 3:00 PM, targeting a fresh high into the close. It's a lower-effort read than the Range Day setup because the day's direction is already established; the flag is just confirmation that the dominant side is ready to press again.
Late-day reversal is a lower-frequency, higher-skill play for a stock that made an extended, near-parabolic move and is now showing exhaustion, long upper or lower wicks, a volume climax, a failed push to new highs. The signature is a "stuff" move: price pokes through a key level and gets immediately and forcefully rejected, trapping the traders who chased the poke. The entry is a position against the exhausted move as the stock loses a key short-term level like the 9-EMA. This setup requires reading exhaustion in real time rather than following a single mechanical trigger, which makes it worth attempting only once the Range Day and Trend Day setups are comfortable.
Where Power Hour Breakouts Go Wrong
The Range Day setup's most common failure is trading a breakout that isn't actually volume-confirmed. Late-day price can drift through a range boundary on thin participation just as easily as it can during the midday chop, and a breakout without the volume signature described in the setup spec fails at a meaningfully higher rate.
A second failure is misreading the day's character in the first place. A day that looks like a clean range at 2:00 PM can still resolve as a late trend or a reversal once the afternoon's real volume shows up, and forcing the Range Day play on a stock that's actually setting up as a Trend Day continuation means fading a move that's about to keep going.
A third, more mechanical failure is holding a position too close to 4:00 PM. Price action in the final minute or two, driven by the closing cross rather than ordinary continuous trading, can reverse a well-managed winning trade in seconds. The 3:58 PM flat rule exists specifically to remove that risk from every setup in this playbook.
The Closing Cross: Why This Playbook Steps Aside Before 3:58 PM
In the literal final minutes, volume spikes dramatically as exchanges run the closing cross, an auction process that matches the accumulated Market-on-Close and Limit-on-Close orders into the single official closing print. It's a genuinely different mechanism from the continuous trading that defines the rest of the session, and it can produce fast, hard-to-predict price swings that have more to do with order matching than with any new information.
This playbook's position is straightforward: be flat well before that auction begins, rather than trying to trade through it. The mechanics of the closing cross itself, how MOC and LOC orders actually work, how imbalance data gets published, and the specific setups some advanced traders use around it, are covered in full in the dedicated Market-on-Close and Limit-on-Close strategy guide. The very last few minutes before that auction, including whether any tactical setups exist in that narrow window at all, get their own dedicated treatment in the final 15 minutes playbook.
Tools for Reading Relative Strength Into the Close
Confirming which stocks are showing genuine relative strength or weakness against SPY or QQQ, rather than just moving in isolation, is easier with a scanner built to compare a stock's intraday performance against a benchmark in real time. Trade Ideas supports this kind of relative-strength screen directly, which speeds up the three-to-five-stock watchlist step in the 2:00 PM routine considerably.
How the Close Fits the Rest of the Trading Day
Power Hour rewards the traders who spent the midday hours preparing rather than forcing trades, which is the entire logic behind treating the midday chop as a preparation window rather than a trading one. The final hour is also, by definition, the end of the trading day: every position, win or lose, gets closed out before 4:00 PM, since carrying a day trade overnight quietly turns it into a swing trade with an entirely different risk profile.
The temptation to chase the final minutes of a strong Power Hour trend, squeezing out a few more cents right into the closing cross, is worth naming as a discipline issue rather than a strategy question; it belongs with the broader trading psychology and risk material as much as with any setup rule here.
Power Hour Trading FAQs
Why does the Range Day breakout require exiting by 3:58 PM instead of holding through the close?
Exiting manually ahead of that auction converts an open-ended risk into a known, already-locked-in outcome. It sacrifices the small chance of an extra few cents in exchange for removing the least predictable minute of the entire trading day from the trade.
Key Takeaway: A disciplined exit before 3:58 PM protects a well-managed trade from the one part of the session this playbook can't reliably read.
How is the Range Day breakout different from the failed-breakout fade covered in the midday playbook?
Both setups use a similar range-and-breakout structure, but the volume backdrop they depend on points in opposite directions. Confusing the two, fading a Power Hour breakout the way the midday setup fades one, means fighting exactly the institutional flow this article describes.
Key Takeaway: The same chart pattern calls for opposite trades depending on whether it's happening during the midday lull or the closing surge.
What market condition makes the Range Day breakout setup fail most often?
A second common failure is misreading the day's character before 2:30 PM. A stock that looks range-bound early in the afternoon can still resolve as a trend continuation or a reversal once real Power Hour volume arrives, which is why the pre-close routine's day classification matters as much as the setup's mechanical trigger.
Key Takeaway: No volume confirmation on the breakout candle, or a misread day type, are this setup's two most common ways to lose.
Why does the late-day reversal setup require more experience than the other two plays?
Both the Trend Day and Range Day setups have a clear, checkable trigger condition. The reversal setup asks a trader to judge that a move has run out of steam, which carries more interpretation and a higher chance of acting too early, before the exhaustion is actually confirmed.
Key Takeaway: Add the reversal play only after the other two mechanical setups are comfortable and consistently executed.
Is holding a day trade past 4:00 PM ever an acceptable adjustment to this playbook?
The rules in this playbook, including position sizing and stop placement, all assume the trade is fully closed out by the close. Carrying it past that point isn't an extension of the same trade; it's a different trade with different risk that should be planned for separately, if at all.
Key Takeaway: Day trades stay day trades; a rule against overnight holds is what keeps the risk assumptions in this playbook valid.
How does the pre-close watchlist differ from the one built for the market open?
By 2:00 PM, a stock's actual behavior all day, not just its pre-market gap, is the more reliable signal. A name that's shown consistent relative strength against SPY or QQQ through the open, midday, and into the afternoon is a stronger Power Hour candidate than one chosen purely on an early gap that may have already faded.
Key Takeaway: The close's watchlist is built on a full day of observed behavior, not a single pre-market data point.
What's the honest win rate for the Range Day breakout setup specifically?
Broader research on intraday volume patterns confirms that volume and volatility genuinely pick back up into the close, which supports the logic behind trading a volume-confirmed breakout during this window, but translating that into a precise, citable win rate for this specific setup would mean inventing a figure this guide can't actually support.
Key Takeaway: Treat the setup's filters as a way to improve the odds, not as a strategy with a documented, guaranteed win rate.
Does Power Hour behave the same way on a low-volatility day as it does during periods of market-wide stress?
On calmer days, the 2:00 PM read of the day's character tends to hold through the close. During genuinely volatile market conditions, checking that read again closer to 3:00 PM, rather than trusting an early-afternoon classification, is worth the extra step.
Key Takeaway: A volatile broader market makes the day-type read less stable, which calls for rechecking it closer to the close rather than locking it in early.
Disclaimer
Article Sources
- Chapman University: Revisiting the U-shaped Patterns in Volatility and Price Impacts - research documenting the volume and volatility surge into the close that this playbook is built around.
- Price Impact in Closing Auctions, Opening Auctions, and Continuous Markets (Journal of Financial and Quantitative Analysis) - peer-reviewed research comparing execution costs and price impact in closing auctions against continuous trading.
- Nasdaq: The Nasdaq Opening and Closing Crosses Fact Sheet - official documentation on how the closing cross matches Market-on-Close and Limit-on-Close orders into the final print.
Was this helpful?
Be the first to weigh in

Written by
Kazi Mezanur RahmanFounder, independent researcher, and editor of DayTradingToolkit. A one-person publication focused on risk-first trading education and documented tool research. He trades his own capital as a retail trader and combines personal market experience with systematic primary-source research.
Keep Reading
Strategies
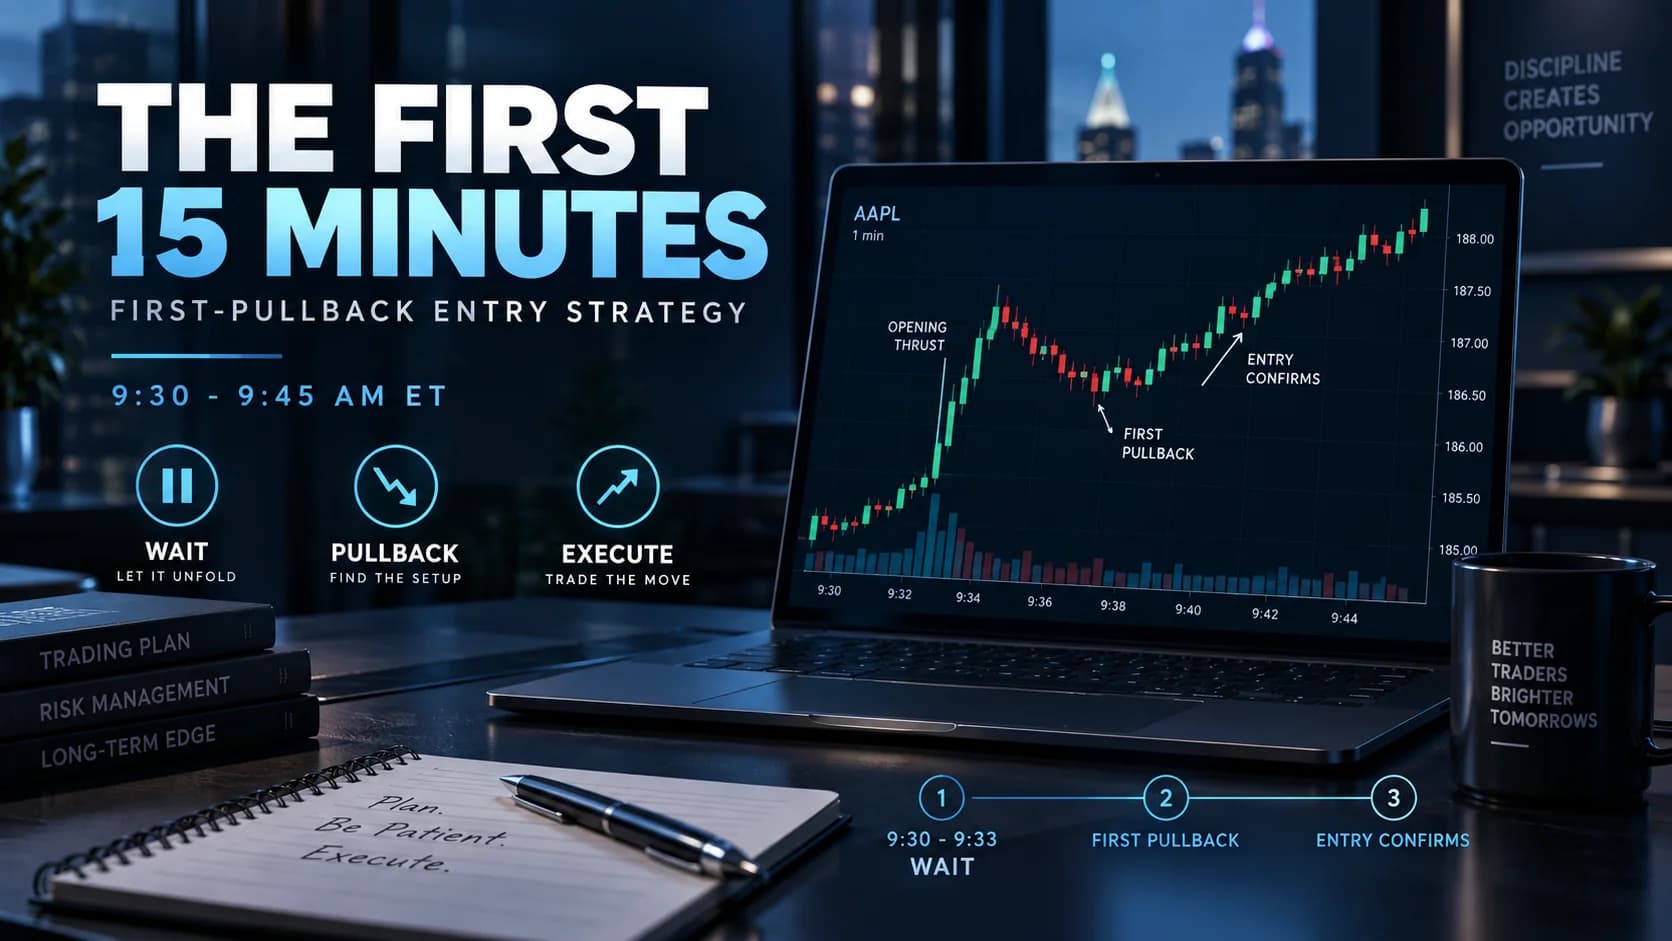
The Trader's Playbook: How to Day Trade the First 15 Minutes
The opening auction leaves an imbalance that takes a few minutes to resolve. This playbook covers what's structurally different about the first 15 minutes and the one pullback setup built around it.

Strategies
The Trader's Playbook: How to Day Trade the Market Open
Master DayTradingToolkit's "Golden Hour" framework for the first 60 minutes of trading, including the Opening Range Breakout setup, its failed-breakout mirror trade, and how to build a pre-market watchlist.
Strategies
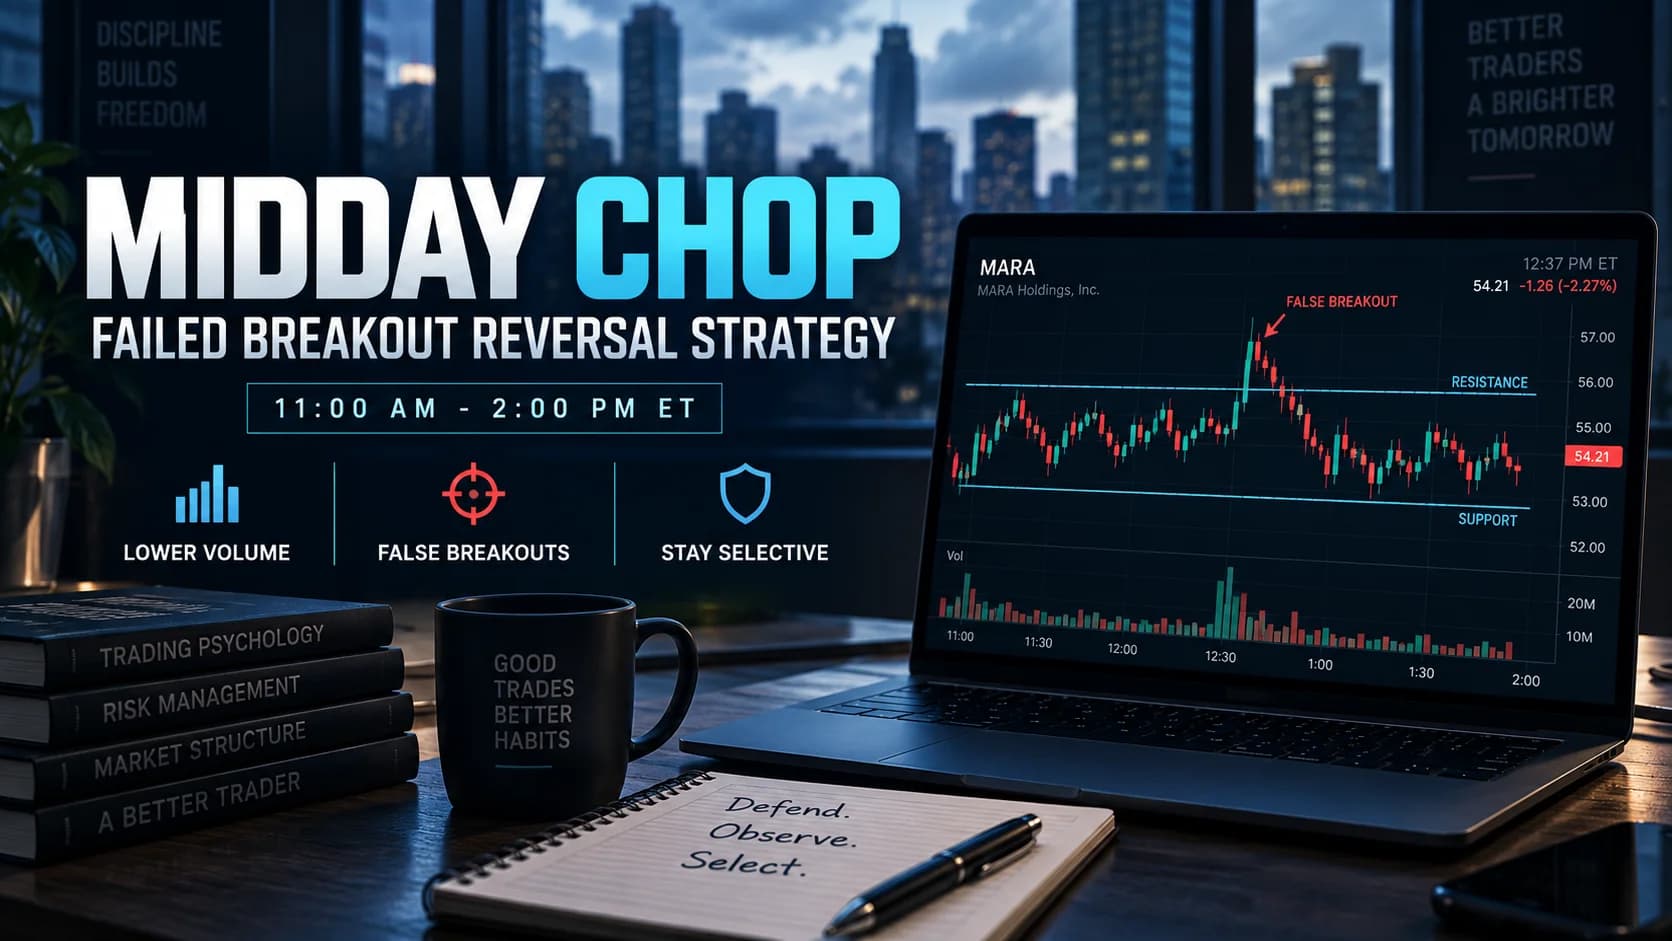
The Trader's Playbook: How to Day Trade the Midday Chop (11 AM - 2 PM)
Stop giving back morning profits. This playbook covers why volume disappears from 11 AM to 2 PM, the failed-breakout fade setup built for it, and how to use the lull to prepare for the close.

Strategies
Trading the Breakout of Prior-Day High/Low Levels
PDH and PDL need no formula, just yesterday's range. This guide covers the breakout, the liquidity-sweep fade, and why stops cluster right at these levels.
Comments
No comments yet. Be the first to share your thoughts.