
The Market-on-Close (MOC) and Limit-on-Close (LOC) Strategy

In this article9 sections
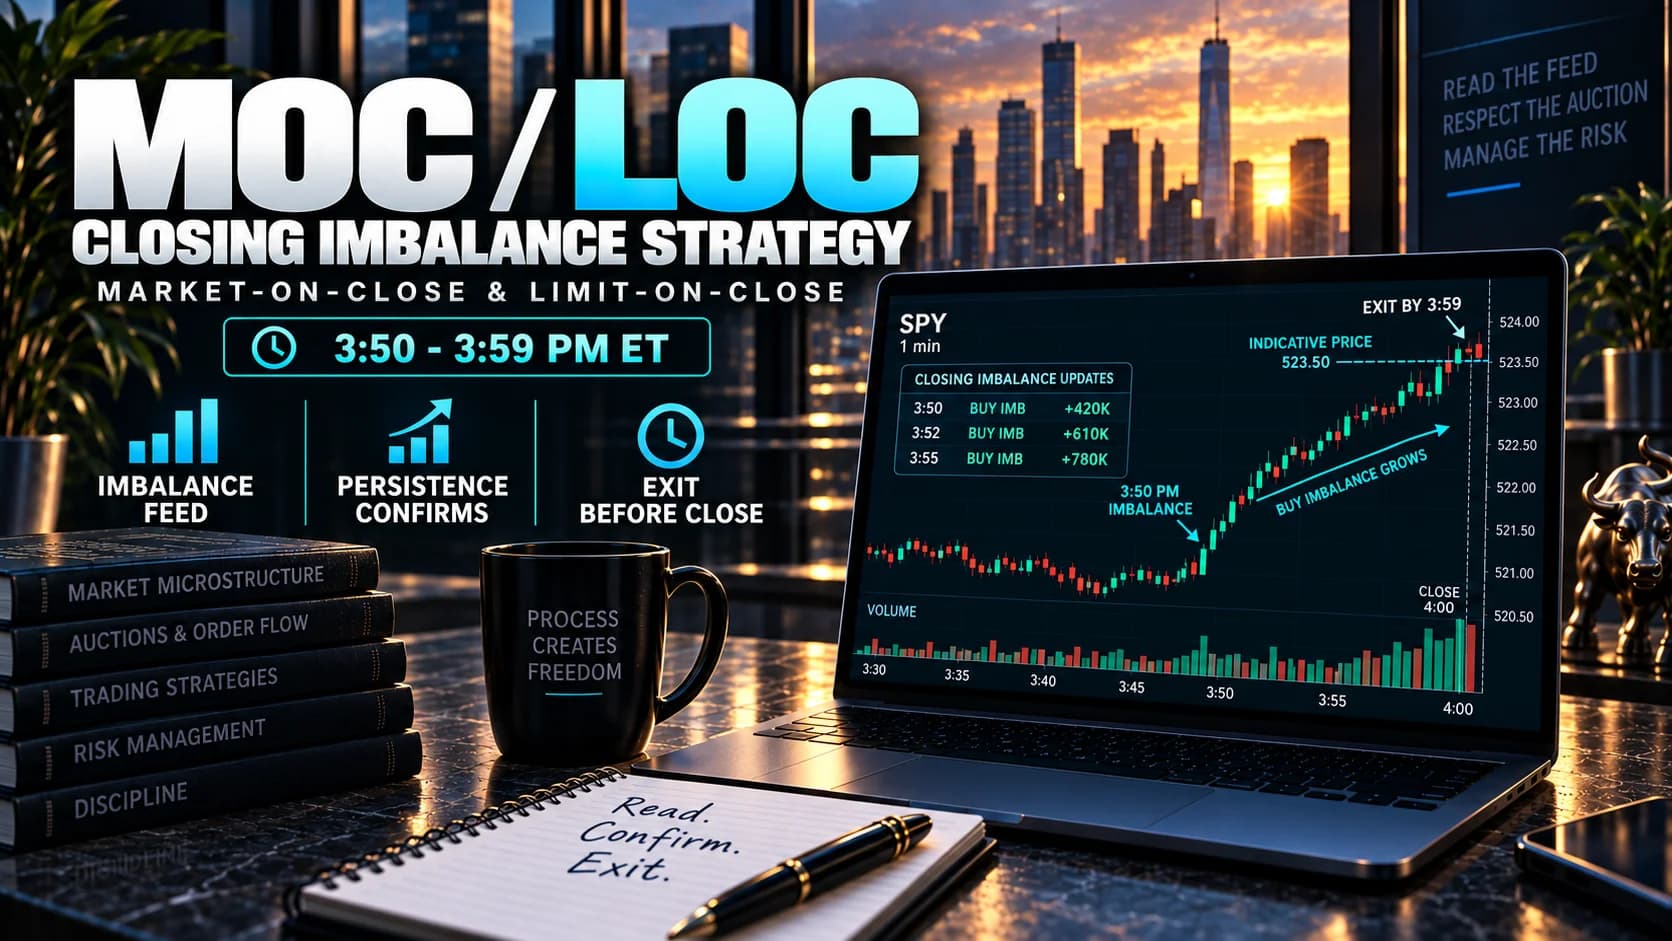
At 3:50 PM ET, exchanges start publishing a number most retail traders never look at: the closing order imbalance, a running tally of how many more shares are lined up to buy versus sell at the official close, updated every few seconds until the bell. That single data feed can telegraph meaningful price pressure in the final ten minutes of trading, and it's publicly available to anyone who knows where to look.
This is the deepest, most mechanical article in this hub's coverage of the trading day's final stretch. The market close playbook covers the broader Power Hour and explicitly steps aside before the closing auction begins; this article covers what actually happens inside that auction, and the specific, higher-skill setups built around reading it.
What are Market-on-Close and Limit-on-Close orders? Market-on-Close (MOC) and Limit-on-Close (LOC) orders are instructions to transact at a stock's official closing price, submitted ahead of the close and executed together in a single auction, the closing cross, that matches accumulated buy and sell orders into one final print.
How MOC and LOC Orders Actually Work
A MOC order has no price limit; it guarantees execution at whatever the closing price turns out to be. An LOC order sets a limit: it executes at the close only if the closing price falls at or better than the specified limit, and simply doesn't fill if it doesn't. Both order types exist specifically to participate in the closing auction rather than in continuous trading, and both come with hard submission deadlines well before 4:00 PM.
On the major U.S. exchanges, the cutoff for submitting a new MOC or LOC order typically falls around 3:50 PM ET, with a narrower window after that for cancellations or size reductions only, closing entirely a few minutes before the bell. These cutoffs exist because the exchange needs a stable picture of accumulated orders to calculate and publish imbalance data in the final minutes, the exact data this article's setup depends on.
Institutions use MOC and LOC orders heavily for reasons that have nothing to do with predicting price direction: index funds transacting to match a benchmark's official closing weights, funds marking a portfolio to the day's official close for accounting purposes, and large orders seeking the deepest available liquidity of the day, which the closing auction reliably provides.
Reading the Imbalance Data Feed
Starting around 3:50 PM ET, exchanges publish live order imbalance data: the number of shares paired for execution, the number of unpaired (imbalance) shares on the buy or sell side, and often an indicative clearing price showing where the auction would currently settle if it closed at that instant.
A large, persistent buy-side imbalance signals more buy interest than sell interest is currently lined up for the close, which tends to exert real upward price pressure in the final minutes as the market works to attract enough sell-side interest to balance it out, sometimes pulling continuous-market price up toward the auction's indicative level even before the actual close happens. A sell-side imbalance works the same way in reverse.
This is a genuinely different kind of signal than anything covered earlier in this hub's close-of-day coverage. It isn't a chart pattern or a volume spike; it's a direct, published readout of accumulated institutional intent for the specific final print of the day.
The Imbalance Momentum Setup Specification
- Component
- Market Conditions Required
- Rule
- A published imbalance that's large relative to the stock's typical closing volume, not just present but genuinely outsized
- Component
- Time of Day
- Rule
- Entries taken 3:50 to 3:57 PM ET only, using the published imbalance updates
- Component
- Stock Selection Criteria
- Rule
- Liquid, actively-traded stocks or index ETFs where imbalance data is reliably published and large enough to matter; particularly relevant on scheduled index rebalancing days
- Component
- Entry Trigger
- Rule
- A newly published imbalance update shows the imbalance growing (not shrinking) on a subsequent refresh, in the same direction, confirming persistence rather than a one-time snapshot
- Component
- Stop Loss
- Rule
- A fixed, tight percentage move against the position, sized smaller than a standard Power Hour trade given the very short holding window
- Component
- Initial Profit Target
- Rule
- A move toward the auction's indicative clearing price, or a fixed small percentage target, whichever is closer; this is a short-duration trade by design
- Component
- Trade Management
- Rule
- Full exit by 3:59 PM regardless of outcome; this setup does not hold into the actual closing print
- Component
- Invalidation Criteria
- Rule
- A subsequent imbalance update shows the imbalance shrinking or flipping direction, meaning the earlier read was a snapshot, not a persistent signal
| Component | Rule |
|---|---|
| Market Conditions Required | A published imbalance that's large relative to the stock's typical closing volume, not just present but genuinely outsized |
| Time of Day | Entries taken 3:50 to 3:57 PM ET only, using the published imbalance updates |
| Stock Selection Criteria | Liquid, actively-traded stocks or index ETFs where imbalance data is reliably published and large enough to matter; particularly relevant on scheduled index rebalancing days |
| Entry Trigger | A newly published imbalance update shows the imbalance growing (not shrinking) on a subsequent refresh, in the same direction, confirming persistence rather than a one-time snapshot |
| Stop Loss | A fixed, tight percentage move against the position, sized smaller than a standard Power Hour trade given the very short holding window |
| Initial Profit Target | A move toward the auction's indicative clearing price, or a fixed small percentage target, whichever is closer; this is a short-duration trade by design |
| Trade Management | Full exit by 3:59 PM regardless of outcome; this setup does not hold into the actual closing print |
| Invalidation Criteria | A subsequent imbalance update shows the imbalance shrinking or flipping direction, meaning the earlier read was a snapshot, not a persistent signal |
The Trade Management row's hard 3:59 PM exit deserves emphasis: this setup trades the pressure an imbalance creates on continuous-market price in the final minutes, not the closing print itself. Holding into the actual auction converts a read-and-react trade into a bet on the exact closing tick, a fundamentally different and far less controllable risk.
Case Study: Trading a Growing Buy-Side Imbalance
Picture a large-cap consumer name, ticker JKL, that's part of a scheduled quarterly index reconstitution, a day when the affected index's fund managers are required to transact large blocks specifically at the close to match the new official weights.
At 3:50 PM, the published imbalance shows a meaningful buy-side imbalance, well above JKL's typical closing-auction volume. At 3:52 PM, the next update shows the imbalance has grown further, confirming persistence rather than a one-off snapshot. That's the entry trigger. A small long position enters with a tight stop and a modest target toward the indicative clearing price shown in the imbalance data.
Continuous-market price drifts up over the next several minutes as the imbalance continues building and the market works to attract enough sell-side interest to offset it, reaching the small target by 3:56 PM. The position exits in full well ahead of the 3:59 PM cutoff, never carrying any exposure into the actual closing print itself.
Where This Setup Breaks Down
The most fundamental limitation is access. Most retail brokerage platforms don't provide the real-time closing imbalance feed this setup depends on directly, and many don't support true MOC or LOC order routing at all for retail accounts. This setup is meaningfully harder to execute than the mechanical, chart-based setups covered elsewhere in this hub, and that access gap is worth stating plainly rather than glossing over.
The most common trading failure, for traders who do have the data access, is reacting to a single imbalance snapshot rather than confirming persistence across at least two updates. Imbalance figures can shift meaningfully between refreshes as more orders come in, and a single large reading that shrinks or reverses on the next update was never the persistent signal this setup requires.
A second failure is holding a position into the actual closing print, hoping to capture a larger move than the continuous-market pressure alone provides. The closing auction itself resolves at a single calculated price that can differ from wherever continuous trading was a moment before it, and that difference is a separate, much less predictable risk than the setup above is built to trade.

Index Rebalancing Days: When Imbalances Get Genuinely Large
Quarterly index reconstitution dates, when funds tracking major indices are required to adjust holdings to match newly announced index changes, reliably produce some of the largest closing imbalances of the year on the affected stocks. Research on index membership changes has documented real, measurable price pressure around these reconstitution events, evidence that the mechanical need for index funds to transact at specific times creates genuine, if temporary, price effects independent of any change in a company's actual value.
Checking whether a stock is part of a scheduled index change before a reconstitution date, rather than discovering an unusually large imbalance in real time with no context for it, turns this from a surprise into an anticipated setup.
Data and Execution Tools for MOC/LOC Trading
Because standard retail charting platforms rarely display live closing imbalance data, accessing it typically requires a broker or data provider with direct exchange auction-imbalance feeds, a meaningfully more advanced setup than the scanners used elsewhere in this hub. Trade Ideas offers real-time alerting infrastructure that can be configured around unusual late-session volume and price movement, which is a reasonable proxy signal for traders without a dedicated imbalance feed, though it isn't a substitute for the exchange's actual published imbalance data.
Fitting MOC/LOC Trading Into the Rest of the Close
This setup is explicitly the advanced, optional layer on top of everything else this hub covers about the final hour. The broader market close playbook is built for traders who want to be flat well before 3:58 PM, and that remains the right default for the large majority of retail day traders. The specific tactical questions around the very last few minutes before the bell, separate from the imbalance-reading setup here, get their own treatment in the final 15 minutes playbook.
Market-on-Close and Limit-on-Close FAQs
What's the actual difference between an MOC order and an LOC order in practice?
An MOC order is used when execution certainty matters more than price control, common for index funds that must match a benchmark's official close regardless of price. An LOC order is used when a trader wants closing-auction participation but with a worst-case price boundary.
Key Takeaway: MOC guarantees a fill at an unknown price; LOC guarantees a price boundary at the risk of no fill.
Why does this setup require confirming the imbalance across at least two updates instead of trading the first reading?
Persistence across updates is what distinguishes a genuine, building institutional pressure from an early, incomplete snapshot of orders that haven't finished accumulating yet.
Key Takeaway: One imbalance reading is a snapshot; two confirming readings in the same direction are a signal.
Why doesn't this setup hold a position into the actual closing print for a potentially larger move?
This setup is built to trade the pressure an imbalance creates on continuous trading in the minutes before the close, a more observable and manageable signal than trying to predict the exact calculated closing print itself.
Key Takeaway: Trading the pressure leading into the close is a different, more controllable bet than trading the closing print's exact resolution.
Can a retail trader realistically access live closing imbalance data, or is this setup effectively institutional-only?
Traders interested in this setup should confirm their broker or data provider explicitly offers closing auction imbalance data before attempting to trade around it, rather than assuming a standard retail charting package includes it.
Key Takeaway: Confirm imbalance data access with your specific broker or data provider before attempting this setup; it isn't universally available.
Why do index rebalancing days produce unusually large closing imbalances specifically?
That mechanical requirement, transacting at a specific time regardless of price, concentrates unusually large buy or sell interest into a single auction, producing imbalances well beyond what an ordinary trading day on the same stock would show.
Key Takeaway: Index rebalancing creates imbalances driven by mechanical fund requirements, not by any change in the underlying company's value.
How does this setup's risk profile compare to the Range Day breakout covered in the broader market close playbook?
The very short holding window here limits how much a single trade can capture, but it also limits exposure to reversal risk in a way a longer-held Power Hour position doesn't share.
Key Takeaway: This setup trades smaller, faster, and more mechanically than the broader Power Hour breakout setup it complements.
Is trading the closing imbalance appropriate for a trader still developing their execution speed and discipline?
Traders newer to day trading are better served mastering the broader, more mechanical setups covered in the Golden Hour and Power Hour playbooks before adding a setup that depends on reading and acting on a specialized data feed within a two-to-three-minute decision window.
Key Takeaway: Build the fundamentals with this hub's other close-of-day setups before adding imbalance trading to the toolkit.
Disclaimer
Article Sources
- Nasdaq: The Nasdaq Opening and Closing Crosses Fact Sheet - official documentation on how MOC and LOC orders are collected and matched into the official closing print.
- Harvard Business School Working Paper: The Disappearing Index Effect - academic research on price effects around index membership changes, directly relevant to why rebalancing days produce outsized closing imbalances.
- Price Impact in Closing Auctions, Opening Auctions, and Continuous Markets (Journal of Financial and Quantitative Analysis) - peer-reviewed research on execution costs and price impact specific to closing auctions.
Was this helpful?
Be the first to weigh in

Written by
Kazi Mezanur RahmanFounder, independent researcher, and editor of DayTradingToolkit. A one-person publication focused on risk-first trading education and documented tool research. He trades his own capital as a retail trader and combines personal market experience with systematic primary-source research.
Keep Reading
Strategies
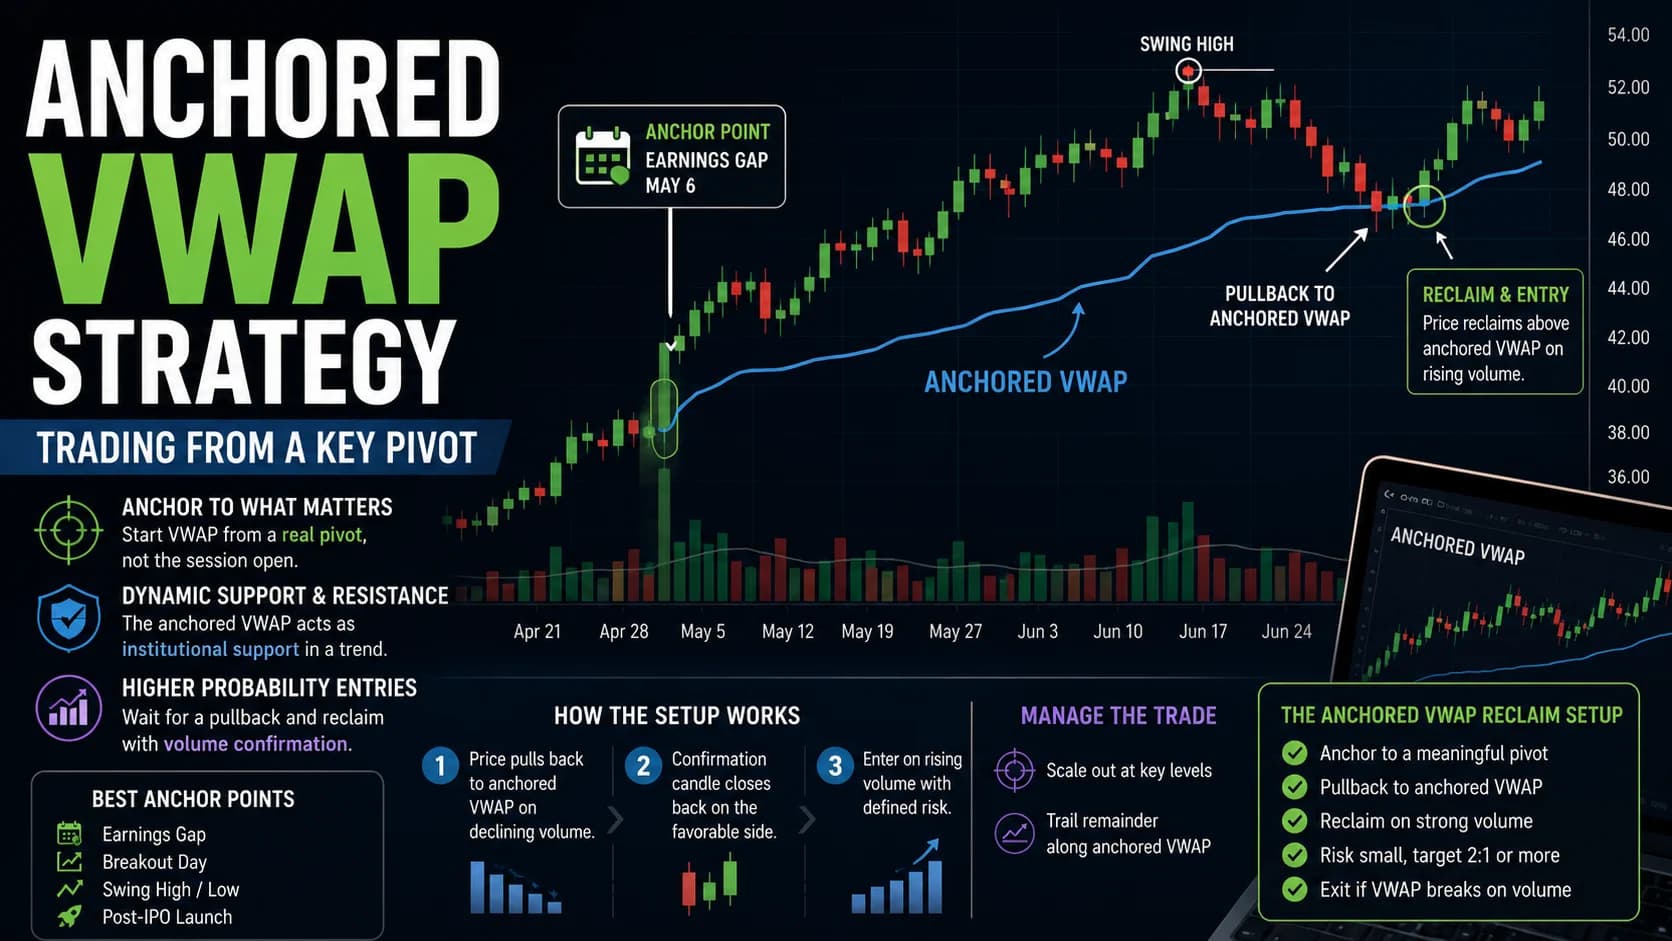
The Anchored VWAP Trend Strategy for Day Traders
The anchored VWAP trading strategy: how to pick a genuine anchor point (a gap, a swing point, a breakout), trade the pullback with volume confirmation, and manage a multi-day anchored position.
Strategies
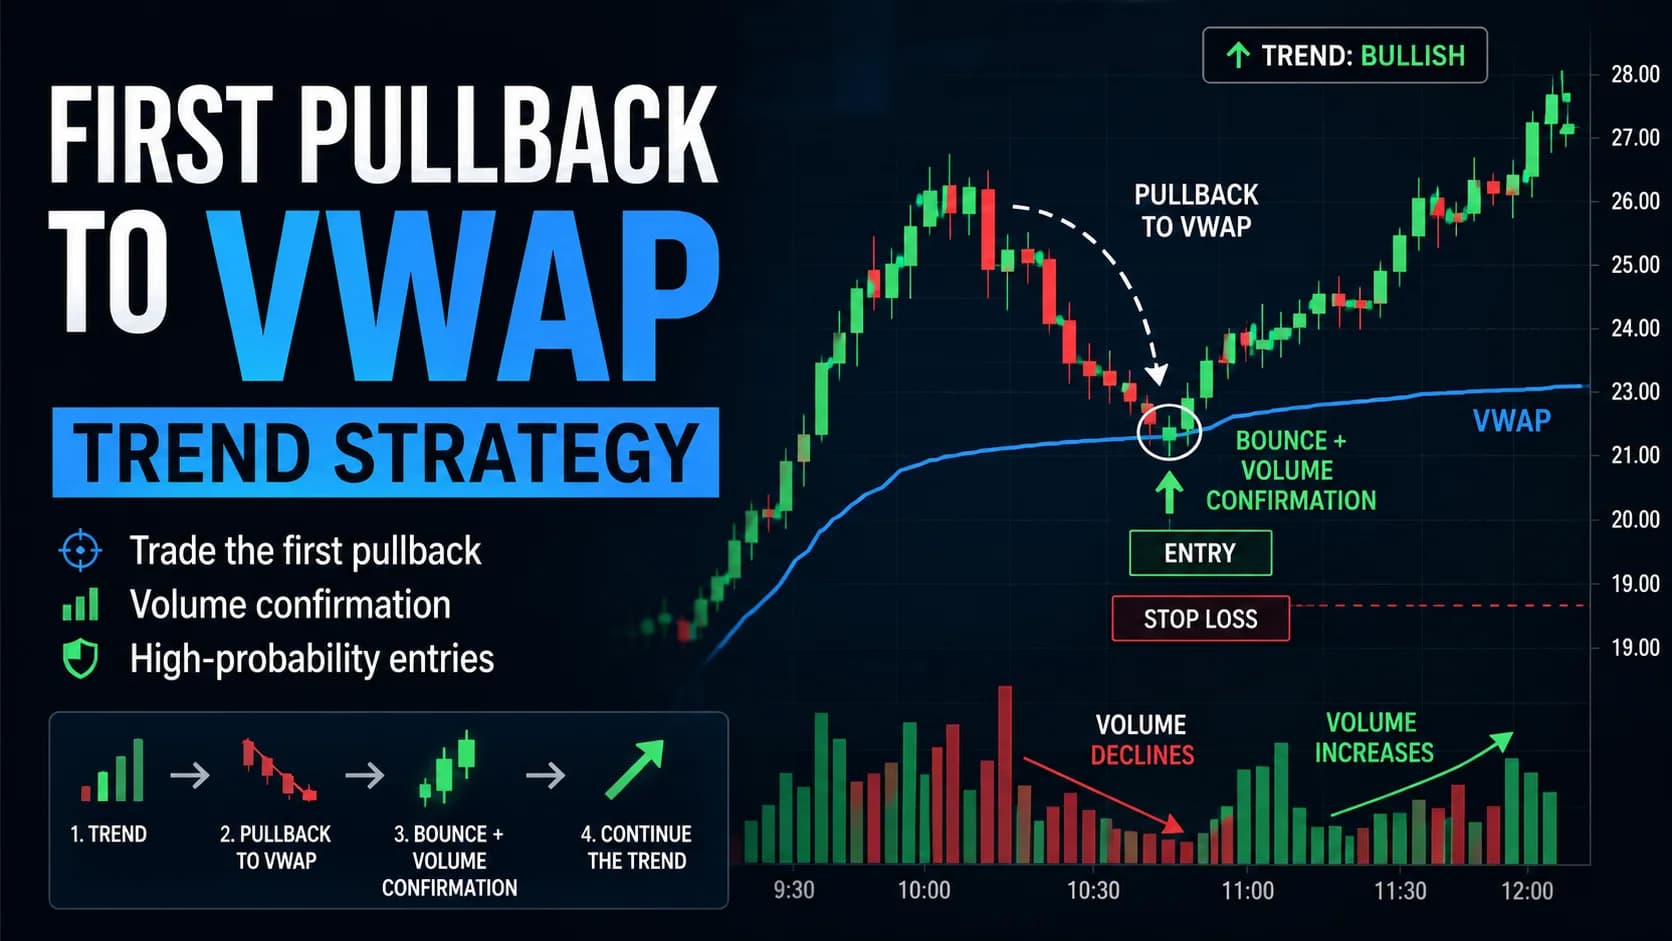
Trading the First Pullback to VWAP in a Trending Stock
A mechanical checklist for trading the first pullback to VWAP in a trending, catalyst-driven stock — volume confirmation, exact entry and stop rules, and an honest look at when this popular setup fails.
Strategies
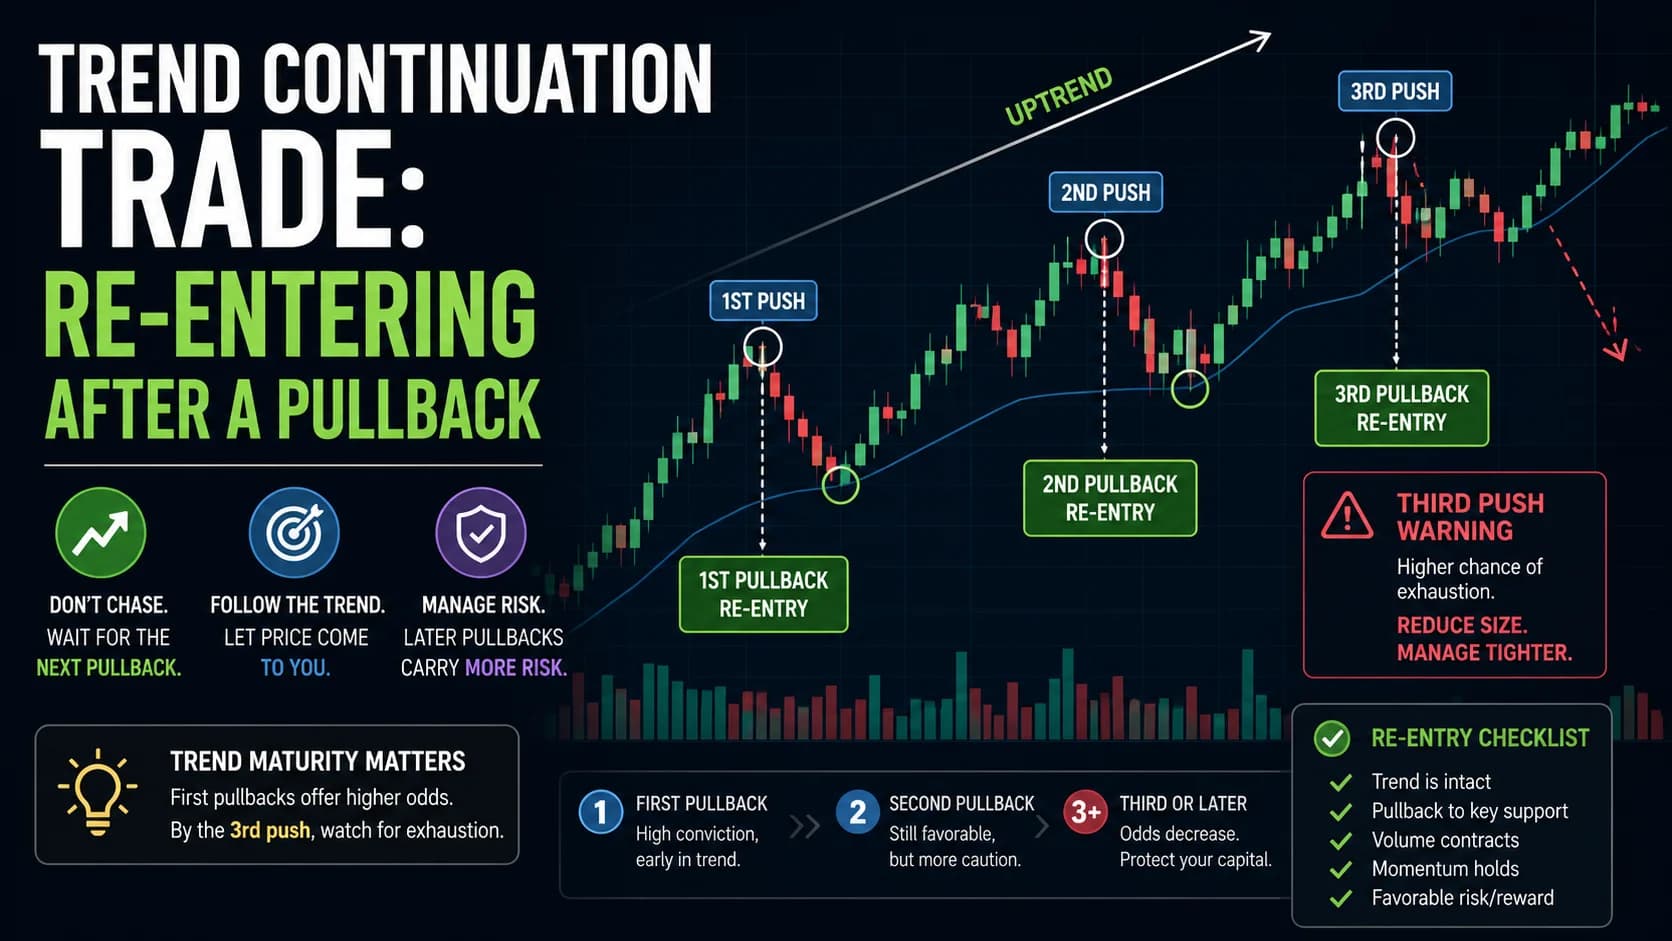
The Trend Continuation Trade: How to Re-Enter After a Pullback
A decision framework for re-entering a trend after the first pullback: track how many "pushes" a trend has made, size down as the well-documented three-pushes exhaustion pattern becomes a real risk, and stop chasing missed entries.
Strategies
The Pullback Trading Strategy: A Pro Guide to Buying Dips & Selling Rips
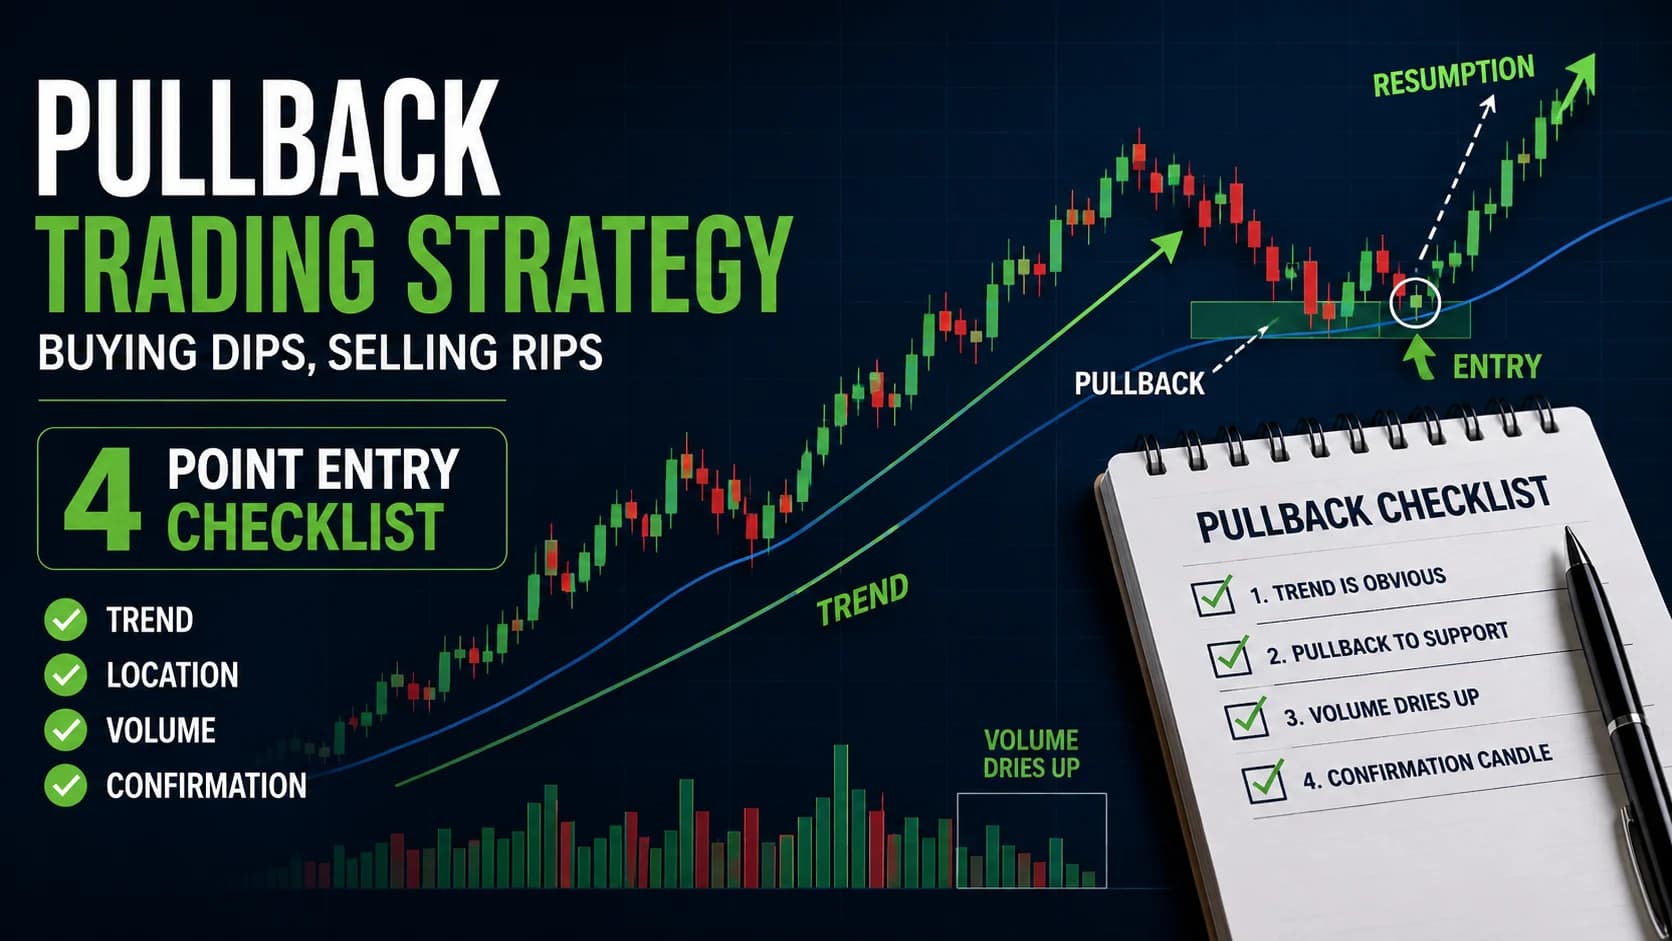
A 4-point mechanical checklist for the pullback trading strategy: trend, location, volume, and confirmation — with exact entry, stop, and target rules for buying dips and selling rips.
Comments
No comments yet. Be the first to share your thoughts.