
Trading the Final 15 Minutes: The 3:45 PM Setup Playbook

In this article9 sections
By 3:45 PM ET, the trading day is fifteen minutes from over, and that changes the math on every remaining decision. A setup that would justify a full-sized position at 10:00 AM, with hours of runway to work, doesn't get the same runway here. This narrow window deserves its own rules, separate from the broader Power Hour framework and separate from the closing-auction imbalance mechanics covered elsewhere in this hub.
What happens in the final 15 minutes of trading? The final 15 minutes, roughly 3:45 to 4:00 PM ET, combine the last window for new institutional execution ahead of the 3:50 PM Market-on-Close order cutoff, the final push from stocks showing strong relative strength or weakness, and the highest volume concentration of the entire session as day traders close out positions ahead of the bell.
Why the Final 15 Minutes Differ From the Rest of Power Hour
The broader market close playbook covers the full final hour and its day-type framework; this narrower window has its own distinct character layered on top of that broader context.
Institutional MOC and LOC order submission largely stops at 3:50 PM, described in full in the MOC and LOC strategy guide, which means any institutional positioning that hasn't happened by then shifts into continuous-market execution instead, adding real volume to this specific window. At the same time, day traders across the market are closing out positions ahead of the 4:00 PM bell, adding their own flow on top of it. The combination produces the session's single highest concentration of volume, often exceeding even the opening bell's pace on an absolute basis.
That volume surge cuts both ways. It can confirm a genuine final push in a stock's dominant direction, or it can produce sharp, hard-to-read whipsaws as multiple large flows (institutional positioning, day-trade closeouts, and the approaching MOC imbalance) collide in the same few minutes.
The High-of-Day Momentum Continuation Setup Specification
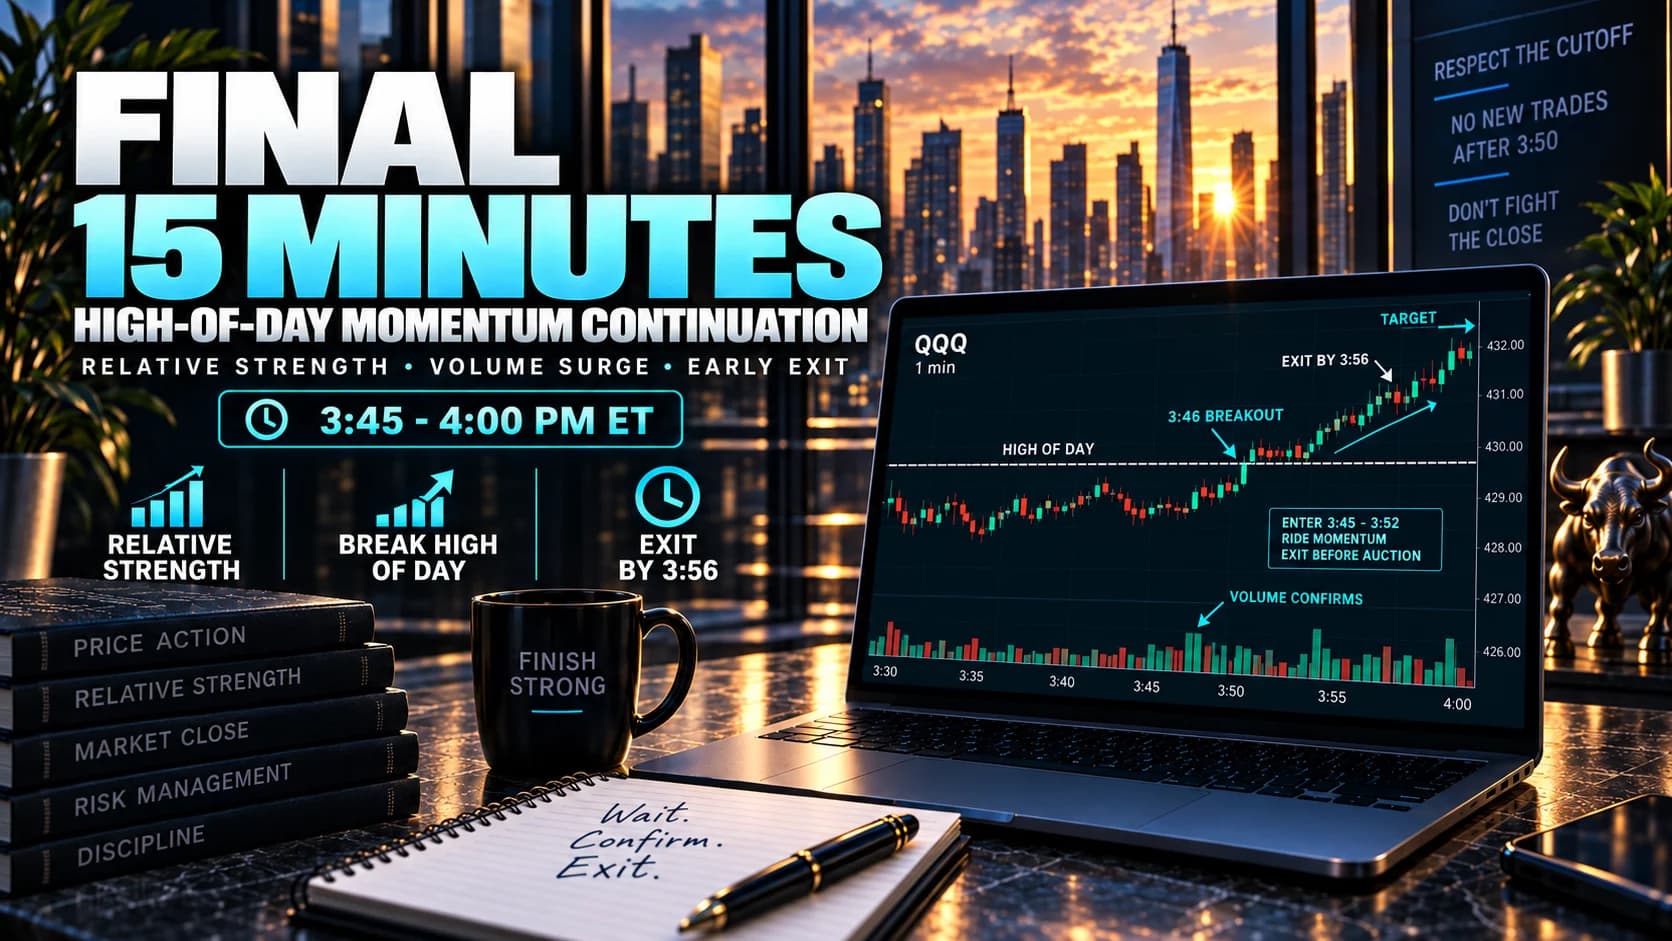
The one setup this narrow window supports well is a final push from a stock that's already shown genuine relative strength or weakness all session, not a fresh, speculative entry on a name with no prior context.
- Component
- Market Conditions Required
- Rule
- Stock already confirmed showing relative strength or weakness versus SPY/QQQ earlier in the session, per the broader market close playbook's watchlist criteria
- Component
- Time of Day
- Rule
- Entries taken 3:45 to 3:52 PM ET only; no new entries after 3:52 PM under this setup
- Component
- Stock Selection Criteria
- Rule
- Price within 1% of the high (or low) of day, with volume in the prior 10 minutes clearly above the session average
- Component
- Entry Trigger
- Rule
- A 1-minute candle closes through the high of day (long) or low of day (short) on volume confirming the push, not just price touching the level
- Component
- Stop Loss
- Rule
- Back below the prior high-of-day level (long) or above the prior low-of-day level (short); a tight, specific invalidation given the short runway remaining
- Component
- Initial Profit Target
- Rule
- A fixed, modest percentage move; this setup does not scale for a large continuation given how little time remains in the session
- Component
- Trade Management
- Rule
- Full exit no later than 3:56 PM regardless of outcome, keeping clear of both the MOC imbalance mechanics and the closing cross itself
- Component
- Invalidation Criteria
- Rule
- Price fails to hold beyond the high/low of day and closes back below/above it within one to two candles
| Component | Rule |
|---|---|
| Market Conditions Required | Stock already confirmed showing relative strength or weakness versus SPY/QQQ earlier in the session, per the broader market close playbook's watchlist criteria |
| Time of Day | Entries taken 3:45 to 3:52 PM ET only; no new entries after 3:52 PM under this setup |
| Stock Selection Criteria | Price within 1% of the high (or low) of day, with volume in the prior 10 minutes clearly above the session average |
| Entry Trigger | A 1-minute candle closes through the high of day (long) or low of day (short) on volume confirming the push, not just price touching the level |
| Stop Loss | Back below the prior high-of-day level (long) or above the prior low-of-day level (short); a tight, specific invalidation given the short runway remaining |
| Initial Profit Target | A fixed, modest percentage move; this setup does not scale for a large continuation given how little time remains in the session |
| Trade Management | Full exit no later than 3:56 PM regardless of outcome, keeping clear of both the MOC imbalance mechanics and the closing cross itself |
| Invalidation Criteria | Price fails to hold beyond the high/low of day and closes back below/above it within one to two candles |
The 3:52 PM entry cutoff and 3:56 PM exit deadline in this setup leave a deliberately short window, four minutes to enter, at most four more to manage and exit. That's intentional: this setup exists to capture a specific, brief continuation, not to open a position that needs meaningful time to develop.

Case Study: A Final Push Through the High of Day
Picture a large-cap technology name, ticker PQR, that showed clear relative strength against QQQ for the entire session, trending higher through the morning and holding that strength through the afternoon. By 3:44 PM, PQR sits at $88.70, just under its $88.85 high of day, on volume already running above the session average for this hour.
At 3:46 PM, a 1-minute candle closes at $89.05, clearing the high of day on confirming volume. Entry at $89.08, stop at $88.80 (back below the prior high-of-day level), for $0.28 of risk per share, a tight, specific level given the limited runway remaining. A modest fixed target, roughly 1% above entry, sits at $89.97.
PQR continues its relative-strength push into the final minutes, clearing the target by 3:54 PM. The position exits in full, comfortably ahead of the 3:56 PM deadline and well clear of the MOC imbalance mechanics and closing cross that take over in the session's very last minutes.
Where This Setup Breaks Down
The most common failure is treating any stock touching its high or low of day in the final minutes as a qualifying setup, rather than requiring the prior relative-strength confirmation the setup spec calls for. A stock with no established relative strength that happens to poke a new high in the final fifteen minutes is a much weaker signal than one continuing a trend it's shown all session.
A second failure is holding the position past the 3:56 PM deadline hoping for a bigger move. The setup's modest, fixed target reflects how little genuine runway remains in the session; treating this like a morning breakout with room to trail a stop and let a winner run misreads how much time is actually left before the closing auction takes over.
A third, more subtle failure is confusing this setup's momentum-continuation logic with the imbalance-driven price action described in the MOC and LOC guide. A stock can be pushing to new highs in the final minutes for either reason, genuine relative-strength continuation, or closing imbalance pressure, and they call for different setups with different risk profiles. Conflating the two means applying this setup's tight, fixed target to what might actually be imbalance-driven price action that behaves differently.
The Case for No New Trades After 3:50 PM
For most traders, the more useful takeaway from this article isn't the setup above. It's permission to stop opening new positions once 3:50 PM passes, full stop, regardless of how compelling a chart looks in that moment.
The reasoning is straightforward: the setup spec above already requires prior relative-strength confirmation and a narrow, specific entry window precisely because unconfirmed setups in this stretch carry meaningfully more risk than the same pattern would earlier in the day. A trader without that established watchlist context, reacting to a chart that suddenly looks interesting at 3:53 PM, is trading blind into the single most volume-dense, least forgiving few minutes of the entire session. The disciplined default, for the large majority of trading days, is treating 3:50 PM as the actual close of the trading day for decision-making purposes, even though the market technically stays open for ten more minutes.
Reading the Close as a Signal for Tomorrow's Pre-Market
How a stock closes, near its high, near its low, or in the middle of its range, carries real informational value for the next session, not just for the day that's ending. Research comparing overnight and intraday return patterns has found that price behavior around the close genuinely relates to what happens at the following open, evidence that a strong or weak close isn't simply a historical footnote but a data point worth carrying into the next day's preparation.
A stock closing strongly near its high of day, on the kind of relative-strength continuation described in this article's setup, is a reasonable candidate to watch on the next morning's pre-market gap scan, since momentum that closes strong sometimes (not always) carries into the next session's early activity. This is context for the next day's preparation, not a standalone trading signal in itself.
Tools for the Final Minutes
Confirming genuine relative strength against SPY or QQQ in real time, rather than trading a chart pattern in isolation, benefits from the same relative-strength scanning covered in the broader market close playbook. Trade Ideas supports this comparison directly, which matters even more in this compressed window than earlier in the session, given how little time is available to double-check a read manually.
How the Three Close-of-Day Playbooks Fit Together
This hub covers the trading day's final stretch across three separate, complementary articles, and it's worth being explicit about how they divide the work. The market close playbook covers the broader 2:30 to 4:00 PM Power Hour, the day-type framework, and the Range Day breakout setup, exiting all positions by 3:58 PM. The MOC and LOC guide covers the advanced, data-dependent setup built around reading published closing-auction imbalances from 3:50 to 3:57 PM. This article covers the narrower, price-action-only final 15 minutes, the momentum-continuation setup above, and, more importantly for most traders, the case for standing aside from new entries once 3:50 PM arrives.
Final 15 Minutes Trading FAQs
Why does this setup require prior relative-strength confirmation instead of just reacting to price touching the high or low of day?
Requiring that earlier confirmation filters out reactive, context-free entries in the session's single riskiest window, keeping this setup scoped to continuing an already-established pattern rather than betting on a brand-new one this late.
Key Takeaway: This setup continues an established trend; it doesn't identify a new one in the final minutes.
How is this setup different from the imbalance momentum trade covered in the MOC and LOC guide?
A stock can show both patterns at once, genuine relative-strength continuation and a large closing imbalance, but they're separate signals with separate setups, and conflating them risks applying the wrong risk profile to what's actually happening.
Key Takeaway: Relative strength and closing imbalance are two distinct signals that happen to occur in the same narrow window; keep the setups separate.
Why does this article recommend against taking any new trade after 3:50 PM for most traders, even though the setup spec allows entries until 3:52 PM?
Most retail day traders don't have a pre-built, confirmed relative-strength watchlist refreshed to the second at 3:50 PM, which is exactly the gap this article's broader "no new trades" guidance is meant to address.
Key Takeaway: The setup's narrow entry window is for traders with pre-confirmed context; everyone else is better served by the more conservative 3:50 PM cutoff.
Does a strong close reliably predict a strong open the next morning?
This is a probabilistic, contextual signal for the next morning's pre-market watchlist, not a standalone trading rule. A stock closing strong is one data point among several a pre-market screen should weigh, not a guarantee of pre-market strength the next day.
Key Takeaway: Treat a strong or weak close as useful context for tomorrow's watchlist, not as a predictive trading signal on its own.
What's the biggest practical difference between trading this setup and trading the Range Day breakout from the broader market close playbook?
The Range Day breakout suits a stock resolving a longer consolidation with real room to run; this setup suits a stock that's already trending and is making one final, brief push before the session ends.
Key Takeaway: The Range Day breakout has a longer runway and a bigger target; this setup is a short, capped continuation play by design.
Why does the stop on this setup sit specifically at the prior high or low of day rather than a percentage-based stop?
A percentage-based stop wouldn't reflect the actual level the trade idea is built on, and given how little time remains in the session, a stop tied to the setup's own logic is more honest than an arbitrary distance.
Key Takeaway: The stop should reflect the level that actually invalidates the trade's premise, which here is the prior high or low of day itself.
Is this setup appropriate for a trader who hasn't yet mastered the broader Power Hour and Golden Hour frameworks?
Traders newer to day trading are better served focusing on the broader, more forgiving setups earlier in the session before adding this narrow, time-compressed continuation play to their toolkit.
Key Takeaway: Build relative-strength reading skills during the broader session before attempting this compressed final-minutes version of it.
Disclaimer
Article Sources
- Lou, Polk, Skouras: A Tug of War, Overnight Versus Intraday Expected Returns - academic research on the relationship between how a session closes and subsequent return patterns.
- Heston, Korajczyk, Sadka: Intraday Patterns in the Cross-section of Stock Returns - academic research on systematic intraday return patterns relevant to late-session momentum continuation.
- Nasdaq: The Nasdaq Opening and Closing Crosses Fact Sheet - official documentation on the mechanics that take over in the session's final minutes.
Was this helpful?
Be the first to weigh in

Written by
Kazi Mezanur RahmanFounder, independent researcher, and editor of DayTradingToolkit. A one-person publication focused on risk-first trading education and documented tool research. He trades his own capital as a retail trader and combines personal market experience with systematic primary-source research.
Keep Reading

Strategies
Trading the Breakout of Prior-Day High/Low Levels
PDH and PDL need no formula, just yesterday's range. This guide covers the breakout, the liquidity-sweep fade, and why stops cluster right at these levels.

Strategies
Trading Breakouts From Consolidation: The Volatility Contraction Pattern
The VCP isn't just a volatility squeeze. This guide covers the staged contraction sequence, the pivot point, and why context matters as much as the pattern.
Strategies
The 52-Week High Breakout Strategy: Trading Stocks at New Highs
Investors anchor on the 52-week high, and that bias is exactly why breaking it carries real weight. This guide covers the research and trading the breakout.
Strategies
The Bollinger Band Squeeze Strategy: Trading Volatility Compression
Tight Bollinger Bands signal a coiled market. This guide covers measuring real squeeze compression, trading the breakout direction, and avoiding false starts.
Comments
No comments yet. Be the first to share your thoughts.