
The Double Top / Double Bottom Trading Strategy

In this article11 sections
Two peaks at nearly the same price, twenty minutes apart. To a trader scrolling through charts after the fact, it looks obvious: a double top, sell it. In real time, before the pattern confirms, that same shape is genuinely ambiguous. It could be a reversal. It could also just be a stock testing resistance twice on its way to breaking through it.
The difference between those two outcomes isn't visible in the two peaks themselves. It's visible in what happens to the trough between them, which is the entire reason this pattern has a confirmation line and not just a shape.
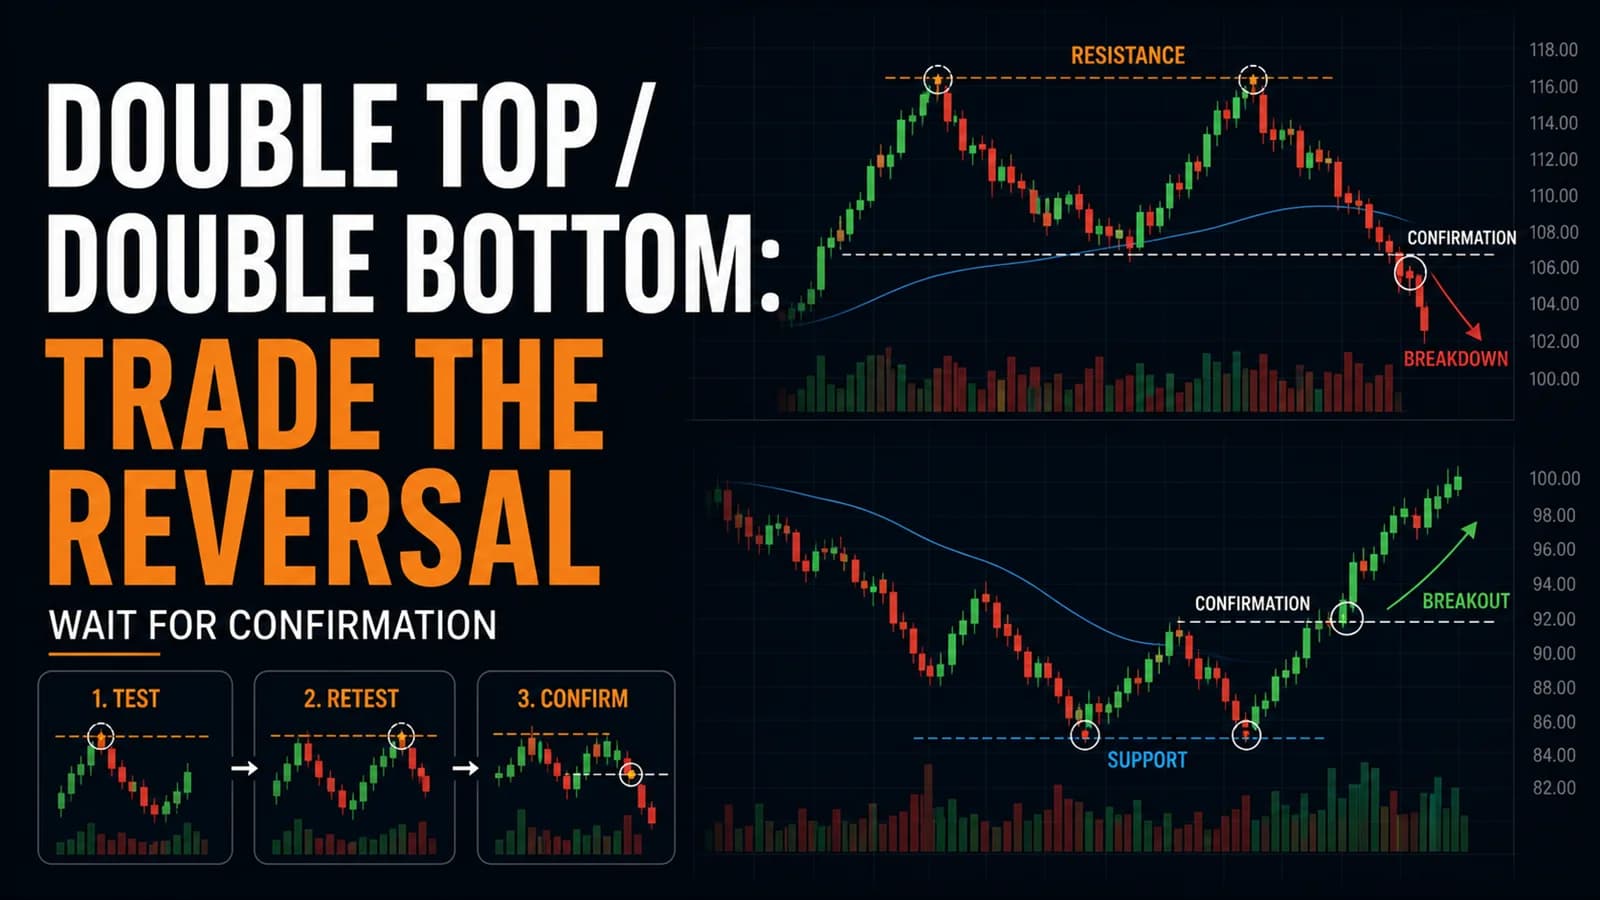
What is the double top / double bottom pattern? A double top is a bearish reversal pattern formed by two peaks at approximately the same price level, separated by a moderate pullback. It confirms when price closes below the trough between the two peaks (the confirmation line), projecting a decline roughly equal to the pattern's height. A double bottom is the bullish mirror image: two troughs at a similar level, confirming on a close above the peak between them.
Confirmed vs. Unconfirmed: The Distinction That Actually Matters
The single most important thing to understand about this pattern is that an unconfirmed double top or double bottom is barely a signal at all. Two peaks at a similar level, without a confirmed break of the middle trough, fail to turn into a real reversal often enough that acting on the shape alone, before confirmation, is closer to guessing than trading a researched setup.
That's a genuinely different risk profile than most of the other patterns in this hub's chart pattern series. A bull flag or a flat top breakout gives a trader a specific, mechanical trigger the moment the pattern is visible. A double top or double bottom gives a trader a shape first, and a genuine trigger only once the confirmation line breaks, which can be a meaningful amount of time, and price movement, after the second peak or trough actually prints.
The other confusion worth clearing up early: a double top with a much deeper trough between the two peaks is really a different pattern in disguise, closer to a head and shoulders without the third peak, or simply two unrelated resistance tests within a broader range. This hub's range fade strategy covers that broader "selling resistance, buying support" behavior when the structure doesn't have the specific double-top or double-bottom shape and confirmation logic described here.
When a Genuine Double Top or Bottom Actually Forms
Best conditions: A stock that's had a real prior move, up into a double top, down into a double bottom, tends to produce a more meaningful version of this pattern than one forming in a stock that's simply chopping in a range all session. The pattern works best as an exhaustion signal after a genuine trend, not as a description of ordinary range behavior.
Best time of day: The two peaks (or troughs) need enough separation in time, typically at least twenty to thirty minutes apart intraday, for the second test to represent a genuinely fresh attempt rather than a continuation of the same initial push. Patterns where both peaks form within a five-minute window are usually just a single resistance test with a brief pause in the middle, not a real double top.
Stock type: Liquid names with a clear, well-defined resistance or support level produce the cleanest versions. A low-float stock prone to spiking through levels on thin liquidity tends to produce messy, hard-to-confirm versions where the "second peak" overshoots the first by an amount that makes the pattern's symmetry questionable.
Volume signature: The healthiest double tops show lower volume on the second peak than the first, echoing the same fading-conviction logic covered in this hub's head and shoulders guide. The healthiest double bottoms often show a volume surge on the second trough, reflecting capitulation-style selling being absorbed by buyers.
The Setup Specification: Double Top (Bearish)
- Component
- Market Conditions Required
- Rule
- A real prior uptrend into the first peak; second peak within roughly 0.5-1.5% of the first peak's price
- Component
- Time of Day
- Rule
- At least 20-30 minutes between the two peaks; avoid treating a pattern whose second peak forms after 2:30 PM ET as reliably confirmable same-day
- Component
- Stock Selection Criteria
- Rule
- Liquid enough for a clean, well-defined trough between the two peaks; declining volume on the second peak preferred
- Component
- Entry Trigger
- Rule
- Candle closes below the confirmation line (the trough between the two peaks), on volume ≥ 1.5x the average of the prior ten bars
- Component
- Stop Loss
- Rule
- Above the second peak's high
- Component
- Initial Profit Target
- Rule
- Confirmation line minus (higher of the two peaks minus confirmation line); scale a third to half at the 0.618x extension
- Component
- Trade Management
- Rule
- Trail below the confirmation line once cleared by a meaningful margin, then below subsequent lower highs
- Component
- Invalidation Criteria
- Rule
- Price closes back above the confirmation line after an initial break; second peak exceeds the first peak by more than roughly 1.5-2%
| Component | Rule |
|---|---|
| Market Conditions Required | A real prior uptrend into the first peak; second peak within roughly 0.5-1.5% of the first peak's price |
| Time of Day | At least 20-30 minutes between the two peaks; avoid treating a pattern whose second peak forms after 2:30 PM ET as reliably confirmable same-day |
| Stock Selection Criteria | Liquid enough for a clean, well-defined trough between the two peaks; declining volume on the second peak preferred |
| Entry Trigger | Candle closes below the confirmation line (the trough between the two peaks), on volume ≥ 1.5x the average of the prior ten bars |
| Stop Loss | Above the second peak's high |
| Initial Profit Target | Confirmation line minus (higher of the two peaks minus confirmation line); scale a third to half at the 0.618x extension |
| Trade Management | Trail below the confirmation line once cleared by a meaningful margin, then below subsequent lower highs |
| Invalidation Criteria | Price closes back above the confirmation line after an initial break; second peak exceeds the first peak by more than roughly 1.5-2% |
The Setup Specification: Double Bottom (Bullish)
- Component
- Market Conditions Required
- Rule
- A real prior downtrend into the first trough; second trough within roughly 0.5-1.5% of the first trough's price
- Component
- Time of Day
- Rule
- Same 20-30 minute minimum separation; strongest confirmations complete before 2:00 PM ET
- Component
- Stock Selection Criteria
- Rule
- Liquid enough for a clean, well-defined peak between the two troughs; volume surge on the second trough preferred
- Component
- Entry Trigger
- Rule
- Candle closes above the confirmation line (the peak between the two troughs), on volume ≥ 1.5x the prior ten-bar average
- Component
- Stop Loss
- Rule
- Below the second trough's low
- Component
- Initial Profit Target
- Rule
- Confirmation line plus (confirmation line minus lower of the two troughs); scale a third to half at the 0.618x extension
- Component
- Trade Management
- Rule
- Trail above the confirmation line once cleared, then below rising swing lows
- Component
- Invalidation Criteria
- Rule
- Price closes back below the confirmation line after breakout; second trough undercuts the first by more than roughly 1.5-2%
| Component | Rule |
|---|---|
| Market Conditions Required | A real prior downtrend into the first trough; second trough within roughly 0.5-1.5% of the first trough's price |
| Time of Day | Same 20-30 minute minimum separation; strongest confirmations complete before 2:00 PM ET |
| Stock Selection Criteria | Liquid enough for a clean, well-defined peak between the two troughs; volume surge on the second trough preferred |
| Entry Trigger | Candle closes above the confirmation line (the peak between the two troughs), on volume ≥ 1.5x the prior ten-bar average |
| Stop Loss | Below the second trough's low |
| Initial Profit Target | Confirmation line plus (confirmation line minus lower of the two troughs); scale a third to half at the 0.618x extension |
| Trade Management | Trail above the confirmation line once cleared, then below rising swing lows |
| Invalidation Criteria | Price closes back below the confirmation line after breakout; second trough undercuts the first by more than roughly 1.5-2% |
The width of the pattern, the time between the two peaks or troughs, has a real effect on reliability. A double top with two peaks separated by only a handful of candles, and a shallow trough between them, is a fundamentally weaker version than one with a deeper, more time-separated trough that shows genuine two-way trading between the tests.
A Walk-Through: A Double Bottom From First Test to Confirmation
Consider a regional bank stock, ticker XYZ, declining through the morning on sector-wide weakness following a peer's disappointing guidance. XYZ falls from $46.80 to a first low of $43.20 at 10:12 AM ET on RVOL of 2.6x. That's the first trough.
XYZ bounces to $44.90 by 10:34 AM, a recovery of roughly $1.70, before selling resumes. It declines back toward the prior low, printing a second trough of $43.35 at 11:08 AM, just fifteen cents above the first trough and comfortably within a valid double-bottom range, this time on RVOL of 3.4x, noticeably heavier than the first decline, a signature consistent with capitulation-style selling finally being absorbed.
The $44.90 peak between the two troughs is the confirmation line. At 11:41 AM, a 5-minute candle closes at $45.10, above that confirmation line, on volume 2.1x the prior ten-bar average. A trader entering at $45.10 sets a stop below the second trough's $43.35 low, a $1.75 risk per share, and calculates the target: $44.90 plus ($44.90 minus $43.20, or $1.70), projecting toward roughly $46.60.
XYZ trades to $46.10 by 1:15 PM, past the 0.618x extension, where a trader scales out part of the position and trails the stop up toward the confirmation line. The stock stalls into the afternoon, closing near $46.30, short of the full $46.60 projection but a solid, well-managed execution of the setup.
Managing the Trade From Confirmation to Target
A pullback to the confirmation line after the initial break is common and shouldn't be treated as failure on its own. As with the head and shoulders pattern, a retest of the confirmation line from the other side, without actually closing back through it, is a normal part of this pattern's behavior in the broader research on longer-timeframe versions of it. Reacting to that retest by exiting early is one of the more common ways traders leave money on the table with this setup.
The stop above the second peak (or below the second trough) is non-negotiable, not a suggestion to tighten prematurely. Because the entire pattern's validity depends on the second peak or trough roughly matching the first, a stop placed any tighter than that level risks getting shaken out by completely normal intraday noise that doesn't actually invalidate the pattern's underlying structure.
Scaling at the 0.618x extension protects against the meaningful share of confirmed patterns that stall before reaching the full measured-move target, covered in more detail in the next section. This isn't a special quirk of this particular pattern; it's the same discipline this hub applies to every measured-move setup, and it matters here as much as anywhere else.
Where the Double Top and Double Bottom Pattern Fails
The most important honest number in this entire guide is the difference between a confirmed and an unconfirmed pattern. Independent statistical research into the double top, based on Thomas Bulkowski's large-sample study of confirmed patterns on daily charts, found that once a double top actually confirms with a close below the trough, its failure rate drops to roughly a quarter of trades. Unconfirmed double tops, meaning two peaks that never see a confirmed break of the trough between them, failed at a rate that was more than double that. The double bottom's version of this same finding is arguably even starker: research on unconfirmed double bottoms found close to a coin-flip's chance that price simply continues lower instead of reversing. This data comes from daily-chart, multi-week research, not the compressed intraday version this guide covers, but the core lesson translates directly: trading the shape before confirmation is a fundamentally weaker bet than waiting for the confirmation line to actually break.
A second failure mode is a second peak or trough that overshoots the first by too wide a margin. A "double top" where the second peak is 4% or 5% above the first isn't really a double top anymore; it's a stock making a new high with a brief pause in between, which is bullish continuation behavior being misread as a bearish reversal signal.
A third failure mode, and one specific to intraday trading, is treating every retest of an intraday level as a double top or double bottom. Stocks test the same support or resistance level repeatedly during a single session for all kinds of reasons that have nothing to do with genuine exhaustion, including simple order-book mechanics around a round number. Requiring the broader trend context described earlier in this guide, a real prior move into the first peak or trough, filters out a large share of these false positives.

Variations Worth Knowing
The triple top and triple bottom extend the same logic to three tests of a level instead of two, generally regarded as a stronger signal once confirmed, since it reflects an even more sustained failure to break through. These take longer to form and are less common intraday simply because of the extra time required for a third test.
The rounded double top, where the second peak is slightly lower than the first rather than matching it exactly, is sometimes read as a subtly weaker version showing fading momentum even on the second attempt. A slightly higher second peak, by contrast, that still fails to hold, can actually be read as a stronger reversal signal, since buyers pushed to a marginal new high and still couldn't sustain it.
The failed double bottom, where price breaks the confirmation line and then reverses back below the second trough, often triggers a fast continuation of the original downtrend as trapped buyers exit. This connects to this hub's failed breakout, bull trap, and bear trap guide for the mechanics of trading that kind of reversal-of-a-reversal.
Tools for Spotting and Confirming the Pattern
Watching for a second test of a recent high or low, across a full watchlist, in real time, is a task well suited to a scanner rather than manual chart-flipping. Trade Ideas can be configured to alert on a stock revisiting a recent intraday high or low on specific volume conditions, giving a trader advance notice that a potential double top or bottom is forming before the confirmation line break happens.
A charting platform that makes it easy to mark the confirmation line precisely, and to measure the pattern's height for the target calculation, removes a source of manual error from a setup where the entry and target both depend on accurate level-drawing. For a broader comparison of scanning and charting tools, see the tools and reviews section.
How This Setup Fits a Complete Trading Plan
The double top and double bottom are best used as confirmation tools within a broader reversal-hunting approach, not as a lone trigger a trader waits on in isolation. Pairing this pattern with the psychology hub's guide to cognitive biases in trading is particularly relevant here, since confirmation bias, seeing a double top the moment a trader wants a reversal to happen, is one of the easiest ways to misapply this specific pattern.
Because the stop sits at a clearly defined structural level, above the second peak or below the second trough, position sizing should be calculated directly from that distance using the standard risk-per-trade formula, rather than sizing based on a gut feeling about how "obvious" the pattern looks on the chart.
Frequently Asked Questions
How close do the two peaks (or troughs) need to be to count as a valid double top or bottom?
Peaks or troughs that differ by more than about 2% start to look less like a genuine retest of the same level and more like two separate, unrelated price extremes that happen to be in the same general area.
Key Takeaway: Require the second peak or trough to sit within a tight percentage band of the first before treating the shape as a valid double top or bottom candidate.
Why is an unconfirmed double top or bottom so much less reliable than a confirmed one?
Research on unconfirmed patterns has found failure rates dramatically higher than confirmed ones, which is exactly why this guide's Setup Specification treats the confirmation line break as the actual entry trigger, not the second peak or trough itself.
Key Takeaway: Never trade the shape before confirmation; the confirmation line break is where this pattern's real edge lives.
What's the difference between a double top and a stock simply testing resistance?
A stock testing resistance without that fuller structure is a more generic setup covered by this hub's range-trading and resistance-fade content.
Key Takeaway: Confirm the full double-top structure, trend context, spacing, and confirmation line, before applying this pattern's specific measured-move math to a simple resistance test.
Does volume need to be lower on the second peak of a double top?
A second peak on lower volume than the first suggests fading buying conviction even as price revisits the same level, which supports the reversal thesis. A second peak on volume equal to or higher than the first doesn't automatically invalidate the pattern, but it does mean a trader should weight the confirmation line break itself more heavily, since the volume signature isn't providing extra confidence.
Key Takeaway: Treat declining volume on the second peak as a bonus confirmation signal, and lean more heavily on the actual confirmation line break when that volume signature isn't present.
How wide should the pattern be, meaning how much time between the two peaks or troughs?
Patterns with two peaks or troughs separated by only a handful of candles often represent a single test with a brief pause, not two genuinely independent attempts at the level.
Key Takeaway: Require meaningful time separation between the two tests before treating a shape as a real double top or bottom rather than one continuous price move.
What happens if price gaps through the confirmation line instead of closing through it gradually?
The main risk with a gap-based confirmation is a wider entry price relative to the stop level, which changes the trade's risk-to-reward math and should be accounted for in position sizing.
Key Takeaway: Treat a gap through the confirmation line as valid confirmation, but recalculate position size for the wider effective risk it usually creates.
Can a double top form at a new all-time high, or does it need a prior reference level?
A double top at a brand-new high relies more heavily on its own internal structure, the two peaks and the confirmation line, since there's no additional layer of historical resistance reinforcing it.
Key Takeaway: A double top at a new high is valid but should be weighted slightly less than one forming at an already well-known resistance level with more market participants watching it.
Is the double bottom more reliable than the double top?
That asymmetry is broadly consistent with other reversal patterns covered in this hub, where bullish reversals off capitulation-style lows tend to complete more reliably than bearish reversals off greed-driven highs.
Key Takeaway: Treat the double bottom as the statistically stronger of the two based on longer-timeframe research, while applying the same intraday confirmation discipline to both.
What's the most common mistake traders make with the profit target on this pattern?
Small errors in the height measurement compound directly into the projected target, so it's worth double-checking the actual reference points used.
Key Takeaway: Measure pattern height from the confirmation line to the higher of the two peaks (or lower of the two troughs) specifically, and re-check the math before setting a target order.
Should a trader avoid this pattern in a strongly trending broad market?
A double top forming in a single stock while the broader index is making fresh highs is fighting a stronger current than the same pattern forming alongside broader market weakness. It can still work, particularly on stock-specific news, but the odds are more favorable when the broader tape isn't actively working against the pattern's implied direction.
Key Takeaway: Check the broader market trend before committing full size to a double top or bottom that runs counter to it.
Disclaimer
Article Sources
- StockCharts ChartSchool: Chart Patterns - reference library covering classic reversal pattern structures
- StockCharts ChartSchool: Introduction to Candlesticks - foundational reading on price-bar behavior around key levels
- FINRA: Understanding the New Intraday Margin Requirements - current regulatory framework for day-trading accounts
- FINRA Rule 2270: Day-Trading Risk Disclosure Statement - regulatory baseline for day-trading risk disclosure
- Investor.gov: Margin Rules for Day Trading - investor-facing overview of day-trading account requirements
Was this helpful?
Be the first to weigh in

Written by
Kazi Mezanur RahmanFounder, independent researcher, and editor of DayTradingToolkit. A one-person publication focused on risk-first trading education and documented tool research. He trades his own capital as a retail trader and combines personal market experience with systematic primary-source research.
Keep Reading
Strategies
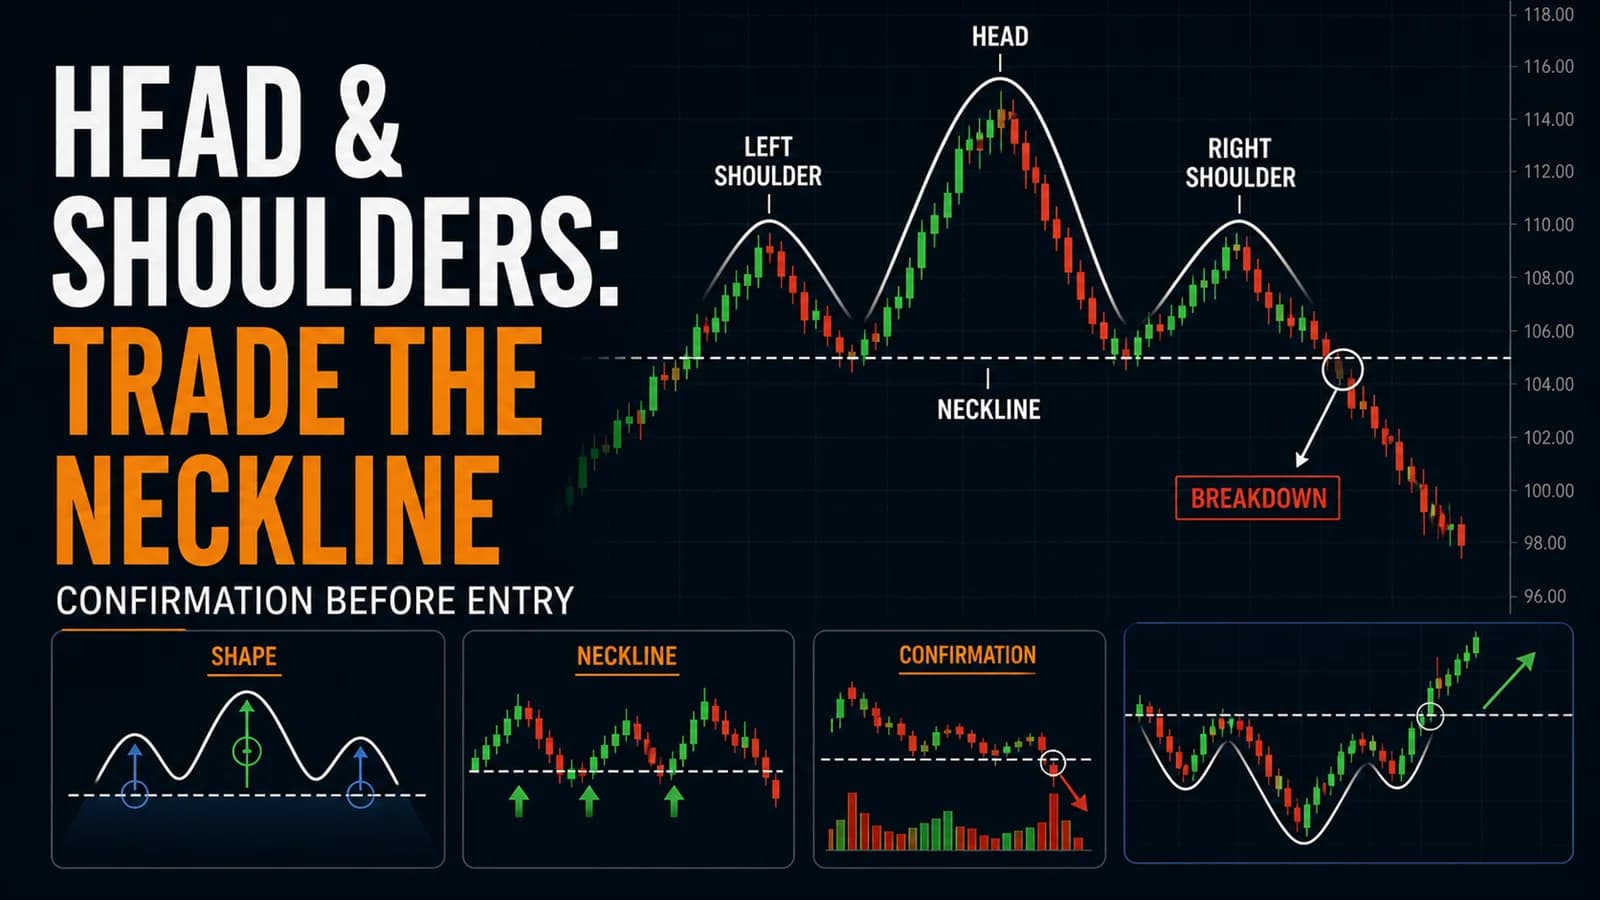
The Head and Shoulders Trading Strategy (And Inverse H&S)
The most famous reversal pattern in trading is also one of the most misdiagnosed. Here's how to actually confirm it before the neckline breaks.

Strategies
Trading Breakouts From Consolidation: The Volatility Contraction Pattern
The VCP isn't just a volatility squeeze. This guide covers the staged contraction sequence, the pivot point, and why context matters as much as the pattern.
Strategies
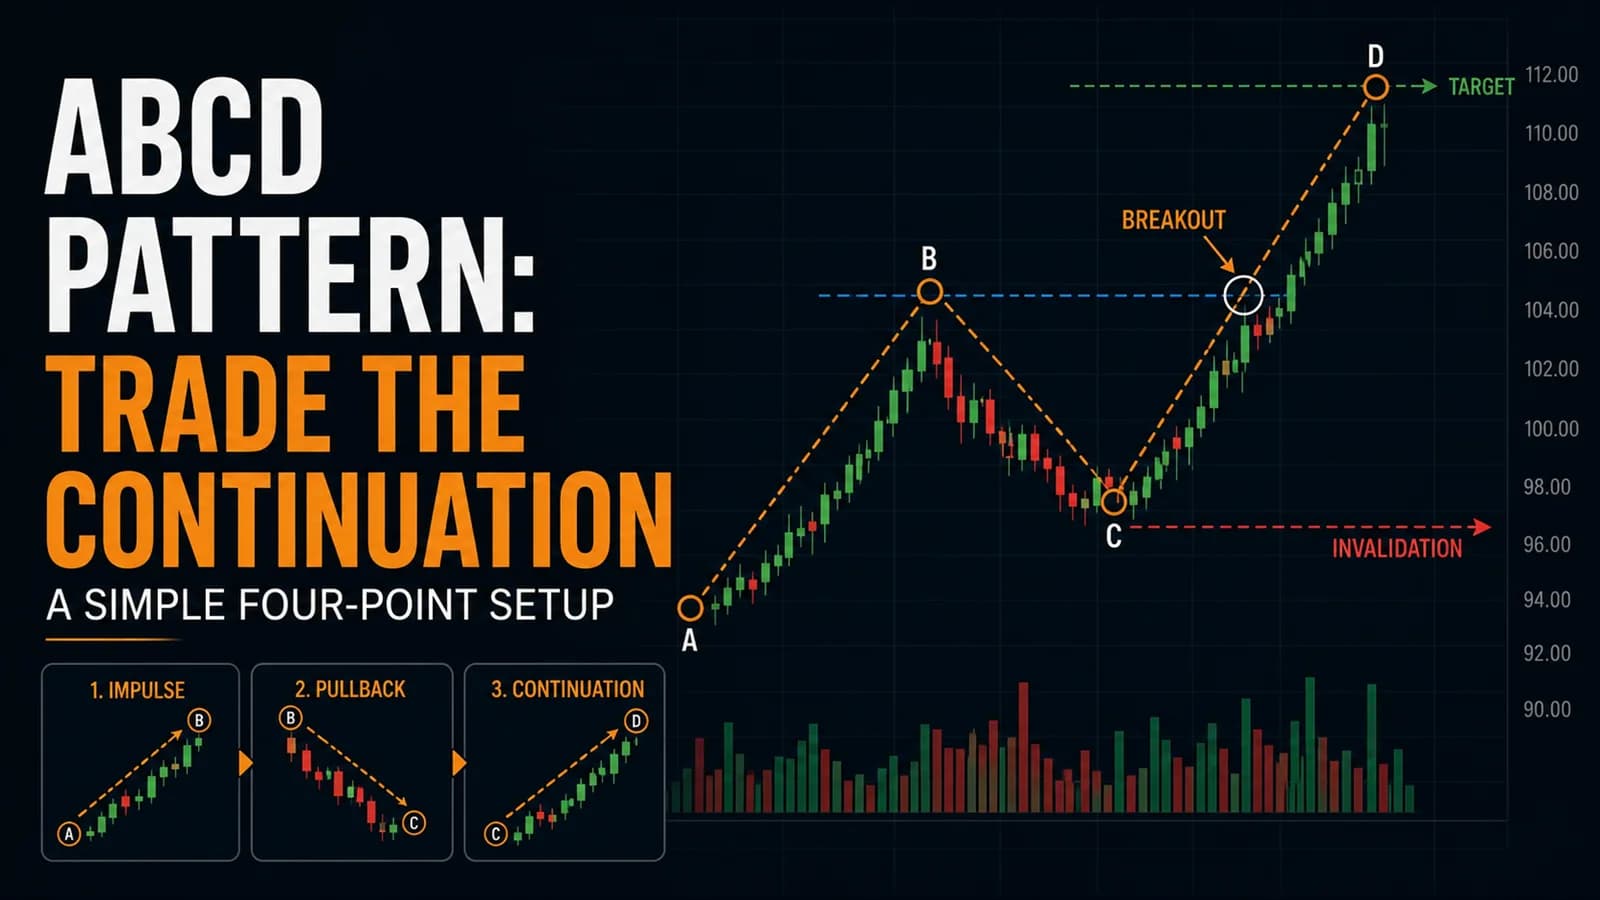
The ABCD Pattern Trading Strategy: A Beginner-Friendly Setup
The ABCD pattern turns a messy pullback into a measured price target. Here's the mechanical version day traders actually use, including where it breaks down.
Strategies
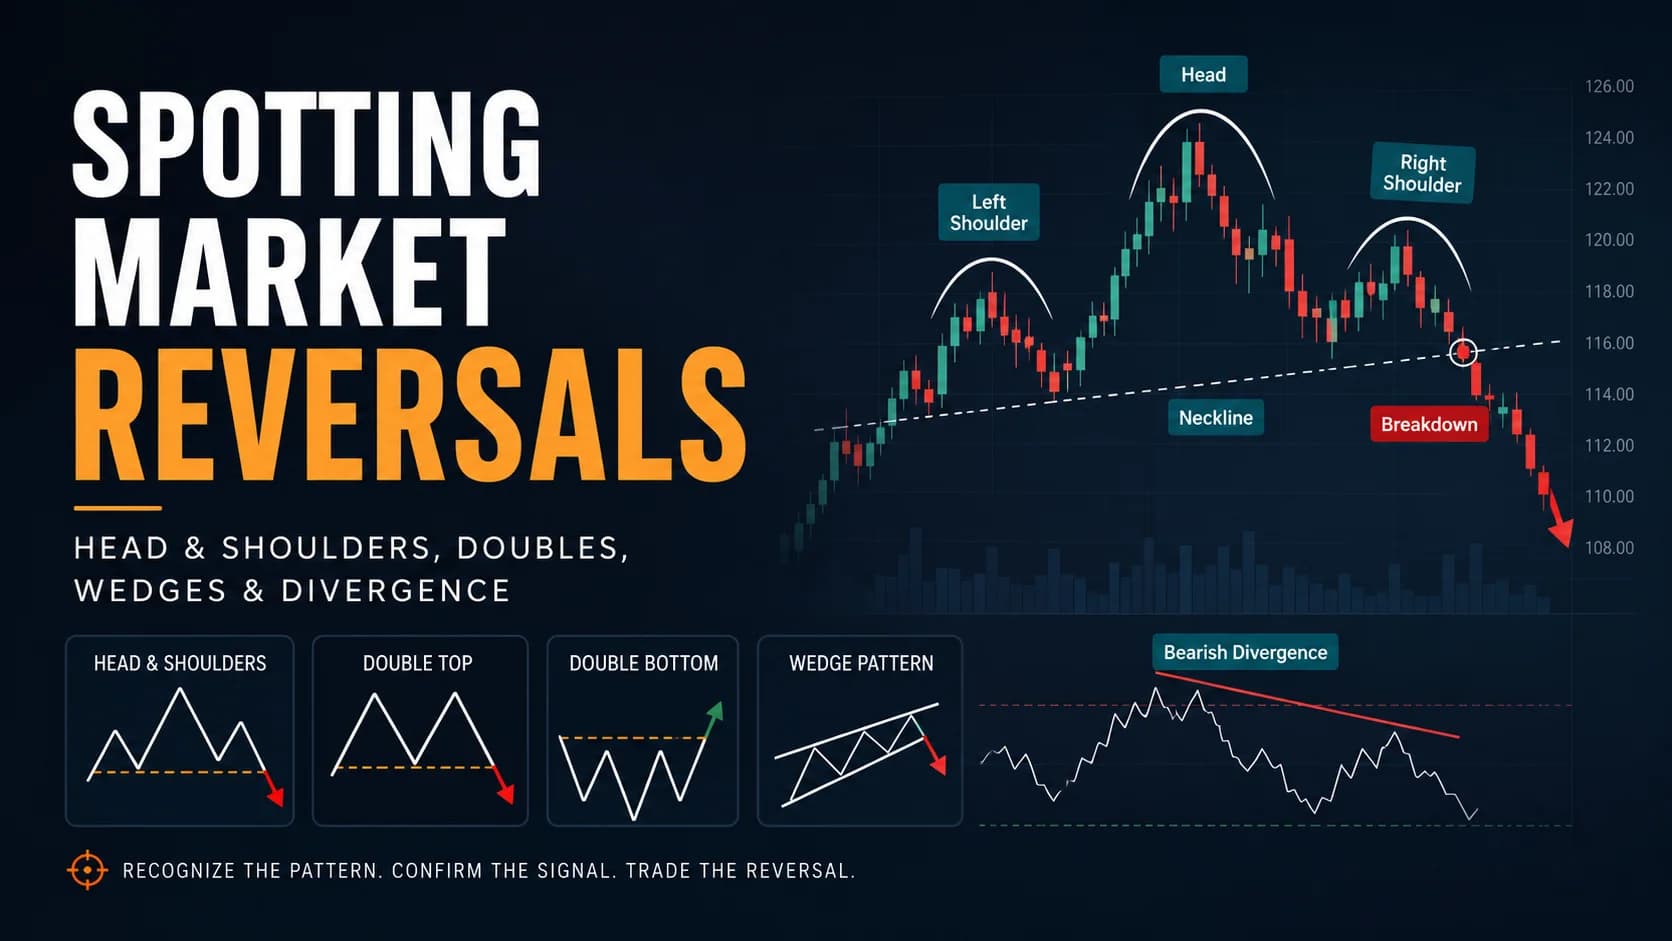
Calling the Turn: Spotting Market Reversals Using Patterns & Divergence
Every reversal pattern tells the same story of failing momentum. This guide covers the anatomy, entry mechanics, and stop placement for each major setup.
Comments
No comments yet. Be the first to share your thoughts.