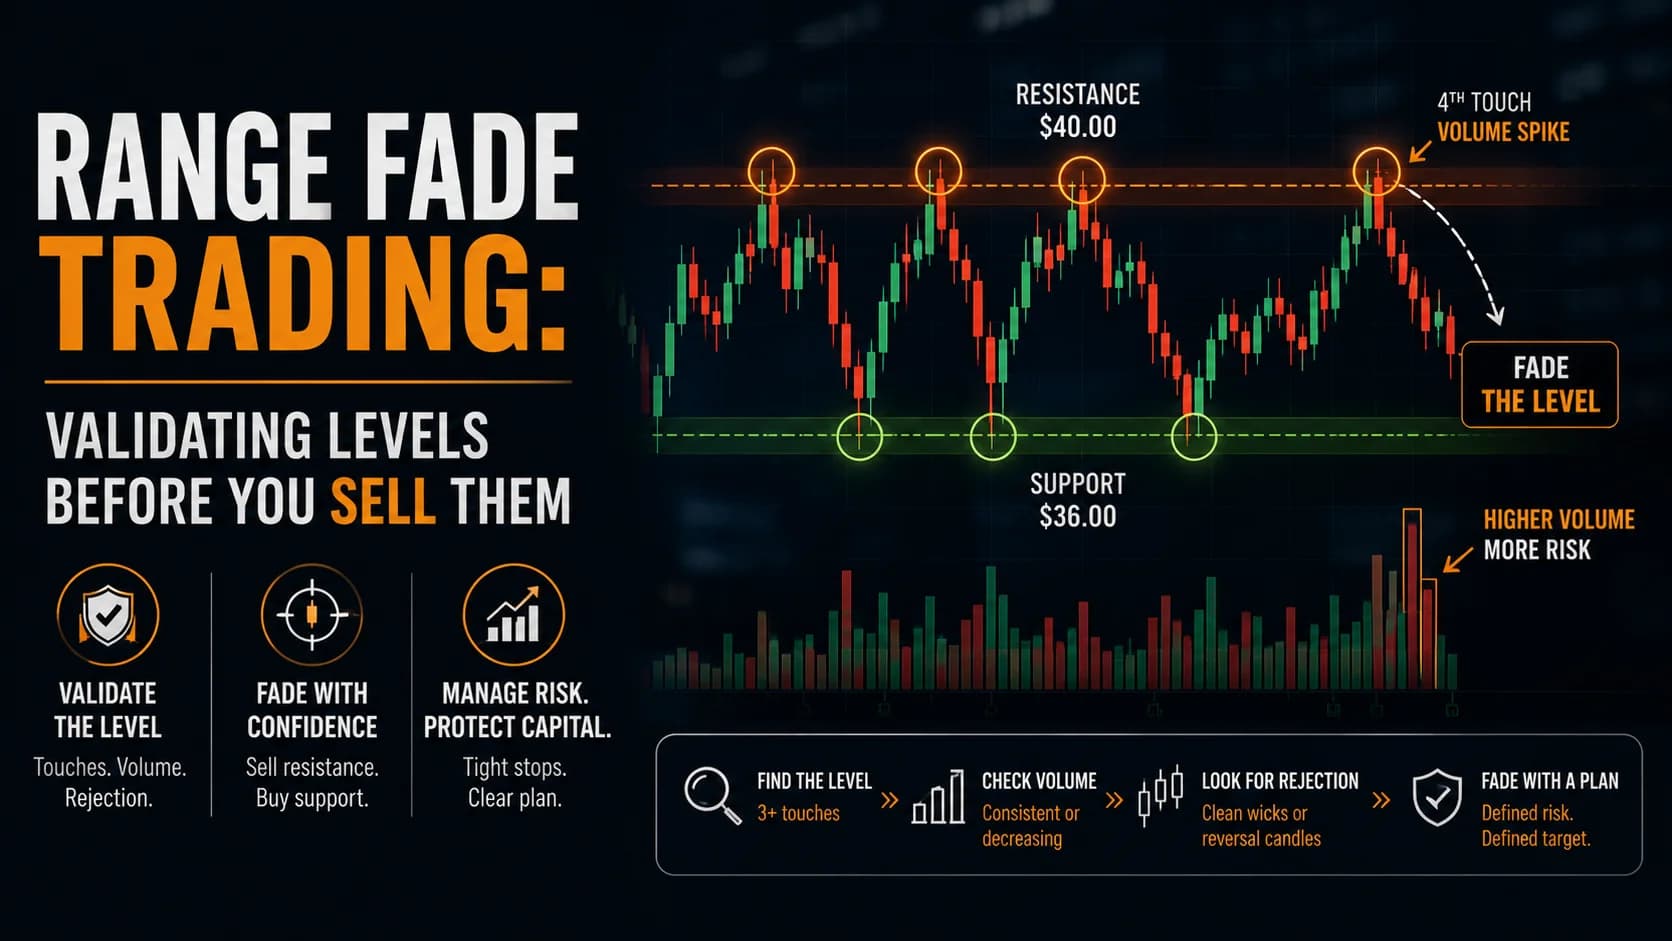
Two traders look at the same chart. Both see a stock that's bounced off $40 three times over the past two weeks. One sells short the moment price touches $40 a fourth time. The other waits, because they've noticed something the first trader didn't: each of those three prior bounces came on progressively lighter VolumeVolume is the total number of shares (or contracts) traded during a given time period — it's the primary confirmation tool for all price action, because a price move accompanied by high volume indicates genuine market participation, while tRead definition →, and the fourth approach is happening on a volume spike.
The line on the chart is identical for both traders. What separates a good RangeA range (or trading range) is a price zone where a stock oscillates between a defined support floor and resistance ceiling without making meaningful new highs or lows — price is consolidating rather than trending, and the dominant trade is Read definition → fade from a bad one isn't drawing the level — that part is easy. It's knowing whether the level, at this specific moment, is still worth trusting.
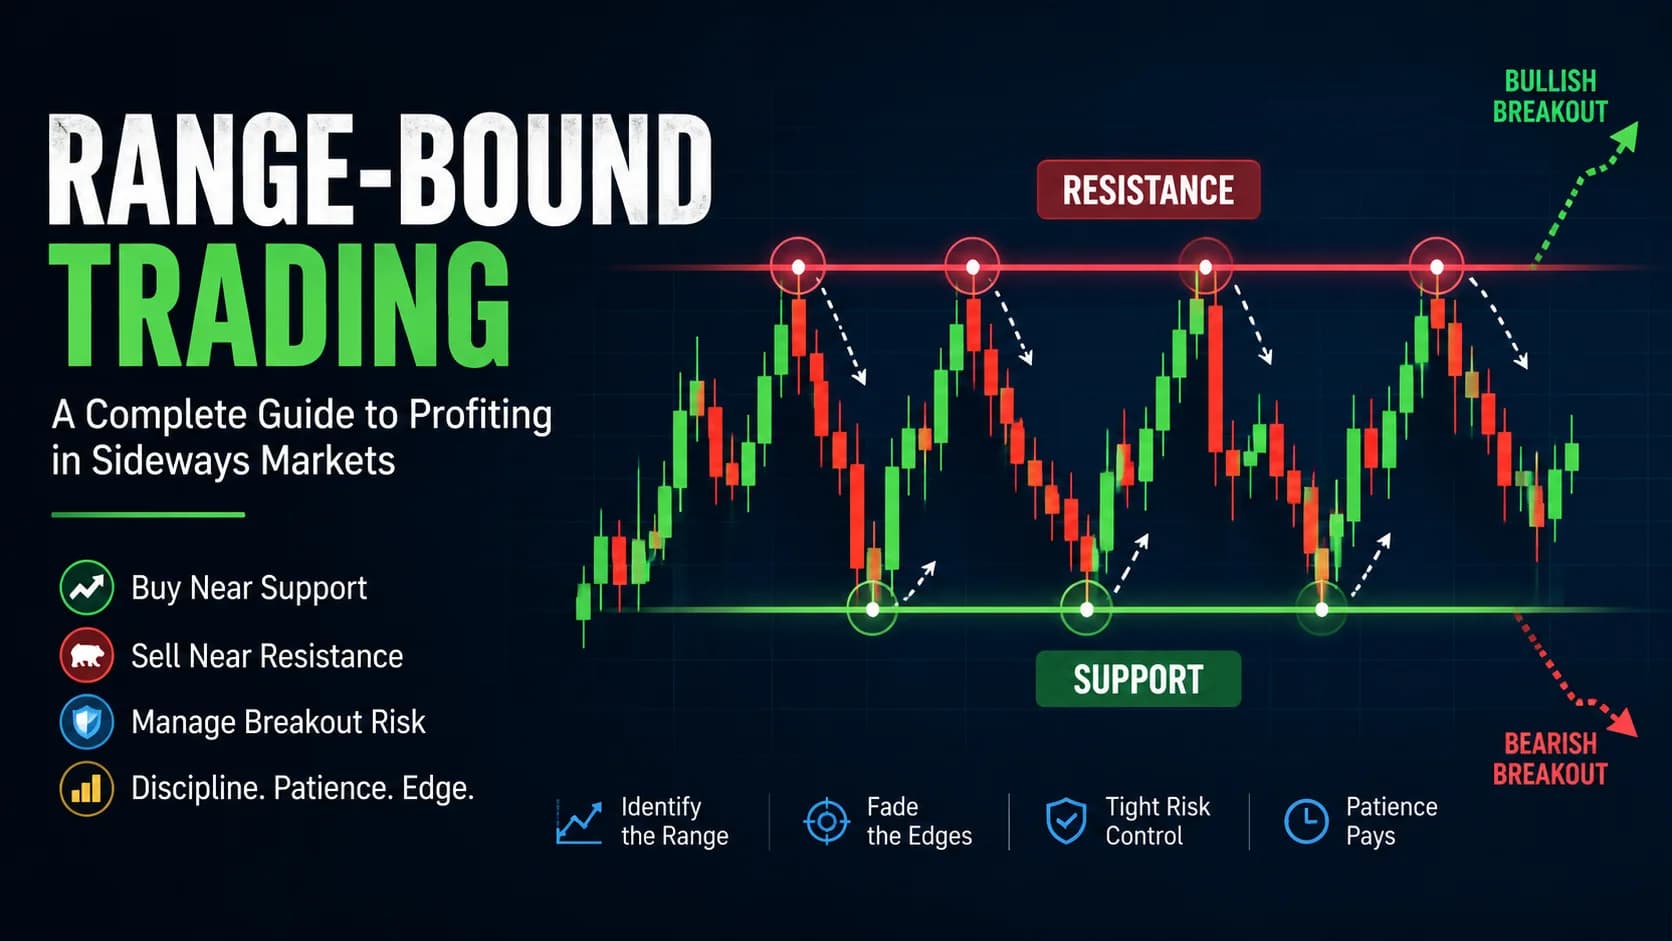
What is range fading? Range fading is the practice of selling near a ResistanceResistance is a price level where selling pressure has historically overcome buying pressure, causing price to stall, reverse, or consolidate — it's the ceiling where supply enters the market and where breakout traders watch for either a coRead definition → level and buying near a SupportSupport is a price level where buying pressure has historically overcome selling pressure, causing price to stop declining and reverse — it's the floor where demand enters the market, and when it holds, it's a potential long entry; when it Read definition → level, on the expectation that price will reject the boundary and move back toward the middle of the range rather than breaking through. The trade only works when the level itself is a genuine one — validated by real, repeated price rejection — rather than an arbitrary line drawn after the fact.
Not Every Line on a Chart Deserves to Be Faded
A level earns the right to be traded by being tested and rejected, not by simply existing. A single touch tells you almost nothing — price could have paused there for any number of reasons unrelated to real supply or demand at that price. Two touches start to suggest something real. Most technical analysis writing treats three or more clean touches, without a decisive break, as the point where a level becomes genuinely tradeable.
That's the baseline. But there's a more useful, less commonly discussed nuance sitting just underneath it: more touches don't automatically mean a safer fade. A level that's been tested four, five, or six times can be in the process of being exhausted rather than confirmed — each touch potentially represents large orders filling into that price, and once those orders are filled, there's nothing left to defend the level on the next test. Traders who treat touch count as a simple "more is always better" scale are missing this risk entirely.
What Actually Validates a Level
Touch count is the starting filter, not the only one. Three factors, checked together, separate a level worth fading from one that's quietly falling apart.
Volume at each touch. A level defended on progressively lighter volume at each successive test is more concerning than one defended on consistent or increasing volume. Declining volume at the boundary can mean the participants defending the level are running out of size, or losing interest, even though price is still technically holding.
Time between touches. A level tested three times within an hour carries different risk than one tested three times across two weeks. Rapid repeated testing can exhaust a level faster than the same number of tests spread across a longer period, since there's less time for genuinely new supply or demand to develop at that price.
Rejection quality. A level that produces a clean rejection wick or reversal candle each time is behaving differently from one where price grinds sideways into the level before eventually turning — the latter is a weaker signal of active defense.
Round numbers deserve a specific mention here, since they come up constantly in this context. Levels at round prices ($40, $50, $100) do tend to attract more attention, partly because retail orders cluster there. That's a real, well-documented tendency — but it's a factor that adds weight to a level that's already showing genuine rejection behavior, not a substitute for that behavior. A round number with no real rejection history isn't a validated level; it's just a round number.
The practical way to use this: when a genuinely validated level — one with real touch history, reasonable volume behavior, and clean rejections — happens to also sit at or near a round number, treat that as added confidence rather than a coincidence to ignore. When a round number shows up with no supporting rejection history at all, it's still just a number on the chart, and trading it as though it carries independent significance skips the actual validation work this setup depends on.
The Validated-Level Fade: A Setup Specification
- Component
- Market Conditions Required
- Rule
- Level tested and rejected at least twice, ideally three times, with no clean break; ADX(14) below 25 on the broader tape, consistent with genuine range conditions rather than a developing trend
- Component
- Time of Day
- Rule
- 10:00 AM–3:30 PM ET only — avoid the first and last 15 minutes, when a touch is more likely to reflect opening or closing order flow than a genuine test of the level
- Component
- Stock Selection Criteria
- Rule
- Liquid large-cap stocks or ETFs; average daily volume above 1 million shares; avoid levels where the most recent touch occurred on volume meaningfully higher than prior touches, without a clear rejection
- Component
- Entry Trigger
- Rule
- A limit order placed slightly inside the level (not exactly at it) combined with a confirming rejection candle on the 5-minute chart at the time of the touch
- Component
- Stop Loss
- Rule
- Placed just beyond the level, sized to the width of the widest prior rejection wick at that boundary — a level with sloppier prior rejections needs a wider stop than a level with clean, tight ones
- Component
- Initial Profit Target
- Rule
- The range midpoint for the first scale-out; the opposite boundary for the remainder, provided that boundary has its own rejection history rather than being an untested guess
- Component
- Trade Management
- Rule
- If the current touch is occurring on volume clearly higher than the prior touches at this level, reduce size or skip the trade entirely, regardless of how clean the chart otherwise looks
- Component
- Invalidation Criteria
- Rule
- A confirmed close beyond the level, especially on rising volume — treat this as evidence the level has been exhausted, not as a temporary overshoot to fade again
| Component | Rule |
|---|---|
| Market Conditions Required | Level tested and rejected at least twice, ideally three times, with no clean break; ADX(14) below 25 on the broader tape, consistent with genuine range conditions rather than a developing trend |
| Time of Day | 10:00 AM–3:30 PM ET only — avoid the first and last 15 minutes, when a touch is more likely to reflect opening or closing order flow than a genuine test of the level |
| Stock Selection Criteria | Liquid large-cap stocks or ETFs; average daily volume above 1 million shares; avoid levels where the most recent touch occurred on volume meaningfully higher than prior touches, without a clear rejection |
| Entry Trigger | A limit order placed slightly inside the level (not exactly at it) combined with a confirming rejection candle on the 5-minute chart at the time of the touch |
| Stop Loss | Placed just beyond the level, sized to the width of the widest prior rejection wick at that boundary — a level with sloppier prior rejections needs a wider stop than a level with clean, tight ones |
| Initial Profit Target | The range midpoint for the first scale-out; the opposite boundary for the remainder, provided that boundary has its own rejection history rather than being an untested guess |
| Trade Management | If the current touch is occurring on volume clearly higher than the prior touches at this level, reduce size or skip the trade entirely, regardless of how clean the chart otherwise looks |
| Invalidation Criteria | A confirmed close beyond the level, especially on rising volume — treat this as evidence the level has been exhausted, not as a temporary overshoot to fade again |
The Trade Management row is the piece most range-fading guides skip entirely. A textbook-clean chart with a fourth touch on unusually heavy volume is not automatically a safer trade than the same setup on the second touch — it may be exactly the setup where the level finally gives way, and the "more confirmations" framing can quietly talk a trader into ignoring the volume signal that mattered most.
A Walk-Through: Validating a Level Before Fading It
Picture a large-cap retail stock — call it XYZ, trading around $72 — that's tested $75 resistance three times over the past nine sessions. The first touch came on 1.2x average volume with a clean rejection wick down to $74.60. The second touch, four days later, came on 0.9x average volume with a similar rejection. The third touch, two days after that, came on 0.8x average volume — progressively lighter each time — with another clean rejection.
That pattern — declining volume, consistent clean rejections, reasonable time spacing — is the profile of a level that's genuinely being defended rather than one that's about to give way. A fourth touch develops the following week. Volume at the approach is running around 0.85x average, consistent with the prior pattern rather than a spike. Price touches $74.85, prints a rejection wick to $74.70, and closes at $74.55.
That's the entry: a Limit OrderA limit order is an instruction to buy or sell a security at a specified price or better — a buy limit will only execute at your price or lower, a sell limit will only execute at your price or higher, guaranteeing the price but not the fillRead definition → filled at $74.80 inside the level, confirmed by the rejection candle, with volume behavior consistent with the level's established pattern rather than a red flag. The stop goes at $75.35, sized to the widest prior rejection wick at this level. The first target is the range midpoint near $73.00; the second target is the established support around $71.50, which has its own two-touch rejection history.
Now picture an alternate version of that fourth touch: volume comes in at 2.1x average as price approaches $75 — a clear break from the declining pattern of the first three touches. Even with an identical-looking rejection wick, the Trade Management rule calls for reduced size or standing aside entirely, since the volume pattern suggests this test is fundamentally different from the prior three, not simply a repeat of the same setup.
Order Execution: Why the Fade Entry Itself Matters
Placing a market order at the exact moment price touches a level is one of the more common execution mistakes in range fading. A limit order set slightly inside the level — a few cents better than the boundary itself — improves the fill price and, more importantly, avoids entering directly into the split second of maximum uncertainty about whether the level will actually hold.
Scaling in also deserves consideration on a level with a longer, more established rejection history. Rather than committing full size on the first sign of a touch, entering a partial position on the initial approach and adding on confirmation of the rejection candle reduces exposure to the moments when a level that looked good on the first three touches finally breaks on the fourth.
This matters most precisely at the touch count where confidence tends to be highest. A trader who has watched a level hold three clean times develops a natural, understandable confidence heading into the fourth test — which is exactly the psychological moment where full-size entries on the first sign of a touch become most tempting, and exactly the moment where the volume-pattern check described earlier matters most. Scaling in forces a pause between the initial touch and full commitment, which is often enough time for a volume anomaly to become visible before the position is fully sized.
Where the Validated-Level Fade Breaks Down
The clearest failure mode is exactly the one described throughout this guide: treating touch count alone as validation, without checking whether volume at each successive touch is holding steady, declining, or spiking. A level tested five times that finally breaks on the sixth attempt isn't a failure of the concept — it's what happens when a trader ignores the volume pattern that was already warning them the level was thinning out.
It also fails when a level is fundamentally an artifact of a round number rather than genuine rejection behavior. A stock pausing briefly at $50 with no clean rejection candles and no volume signature isn't a validated level just because $50 is a psychologically notable price — round numbers add weight to a level with real rejection history, but they don't create one on their own.
And it fails in a genuinely trending market, the same way most range and fade setups do. Academic research on published support and resistance levels — including a Federal Reserve Bank of New York study testing intraday currency levels against thousands of randomly chosen comparison levels — found that real support and resistance levels do have predictive value for short-term price reversals, but that value varies meaningfully across instruments and conditions. A level that worked reliably in a range-bound stretch shouldn't be assumed to carry the same reliability once the broader tape shifts into a genuine trend.
Where Range Fading Fits a Complete Trading Plan
Validating a level properly is the prerequisite skill underneath several other setups in this library — the entry timing covered in the Range Trading Strategy Playbook assumes a level worth trading has already been identified using something like the checklist above. The distinction from mean reversion is worth keeping in mind too: mean reversion fades distance from a moving average, which can be sloped, while this setup specifically fades a horizontal boundary that's been tested and rejected.
For anyone who needs the foundational concepts of support and resistance refreshed before applying the volume and touch-count filters in this guide, Support and Resistance Basics covers that ground. The broader question of when a range holds versus when it's actually chop is worth reviewing as well, since a level that repeatedly fails to hold is often a symptom of a choppier underlying condition than a clean range. For the rest of the market-condition playbooks this setup complements, the Strategies Hub organizes the full library by regime.
Frequently Asked Questions About Range Fading
Does a level really get safer to fade with every additional touch?
The common assumption that more touches always mean a stronger level ignores that each test can represent large orders filling into that price. Once those orders are exhausted, the next test can break straight through, regardless of how many times the level held previously.
Key Takeaway: Check volume trend across touches, not just the raw touch count, before assuming a level is getting safer.
How many touches are actually needed before a level is worth trading?
A single touch carries very little information, since price could have paused there for reasons unrelated to real supply or demand. Three touches with consistent rejection behavior represent a meaningfully stronger case, though the volume pattern across those touches still matters more than the count alone.
Key Takeaway: Treat three clean touches as a reasonable starting threshold, then check the volume pattern before trading it.
Why does declining volume across touches actually favor the fade rather than concern the trader?
A sudden spike in volume at a touch — breaking that established, declining pattern — is the more concerning signal, since it suggests a different, larger group of participants is now testing the level for the first time. A steady, declining volume pattern across multiple clean rejections is closer to the profile of a level that continues to hold.
Key Takeaway: A volume spike that breaks an established declining pattern is a bigger warning sign than declining volume itself.
Are round-number levels ($50, $100) more reliable than other price levels?
Treating a round number as inherently significant, without confirming actual price rejection at that level, skips the validation process this guide is built around. The round-number effect is a real but secondary factor, not a substitute for touch count, volume behavior, and rejection quality.
Key Takeaway: Use round numbers as a supporting factor for an already-validated level, not as validation by themselves.
Why does a limit order placed slightly inside the level work better than a market order at the exact boundary?
Entering exactly at the boundary with a market order means committing to the trade before there's any confirmation the level is actually rejecting price this time. A limit order placed slightly inside, combined with waiting for the rejection candle to actually form, reduces the number of trades taken on levels that break through immediately.
Key Takeaway: Enter slightly inside the level with a limit order and wait for rejection confirmation rather than chasing the exact boundary price.
How should the stop-loss distance change between a level with clean prior rejections and one with sloppy ones?
Sizing the stop to the widest prior rejection wick at that specific level, rather than using a fixed distance across every setup, accounts for the fact that different levels have genuinely different amounts of normal "noise" around them.
Key Takeaway: Size the stop to the specific level's own rejection history rather than applying a fixed distance to every fade.
What does academic research actually say about whether support and resistance levels work?
That research supports the general concept that genuine, well-identified levels carry real information — it doesn't suggest every level drawn on a chart behaves the same way, and the study itself found meaningful variation in how reliable different levels were.
Key Takeaway: The research supports validated levels as a real phenomenon, not a guarantee that any specific line on a chart will hold.
Why does time between touches matter if the touch count and volume both look fine?
Three touches within an hour are testing the same pool of orders repeatedly in quick succession. Three touches spread across two weeks allow more opportunity for the level's defenders to be replenished by new participants, which is part of why spacing is worth checking alongside the raw touch count.
Key Takeaway: Rapid, closely-spaced touches deplete a level faster than the same number of touches spread over more time.
How does this setup differ from the entry timing covered in the Range Trading Strategy Playbook?
The two are meant to work together rather than compete — checking touch count, volume pattern, and rejection quality here identifies which levels deserve attention, while the entry-timing mechanics elsewhere handle the specific moment to act once a level has passed that check.
Key Takeaway: Validate the level first using the checks in this guide, then apply entry-timing mechanics from a companion setup once a level qualifies.
When should a level be abandoned entirely rather than faded again after a near-miss?
Continuing to fade a level after it has actually broken, on the assumption that the break was a false one, ignores the same volume signal that should have raised concern before the break happened. Once a confirmed close occurs beyond the level with supporting volume, the level's rejection history no longer applies.
Key Takeaway: Treat a volume-confirmed break as the end of that level's usefulness, not an invitation to fade the "overshoot."
Disclaimer
Article Sources
- Support for Resistance: Technical Analysis and Intraday Exchange Rates — Carol Osler, Federal Reserve Bank of New York - an empirical study testing published currency support and resistance levels against thousands of randomly chosen comparison levels.newyorkfed.org
- Support and Resistance — Wikipedia - summarizes the technical analysis literature on horizontal level identification, including academic studies on empirical testing of support and resistance levels in US stock markets.en.wikipedia.org
- Support and Resistance: Fully Explained — Analyzing Alpha - discusses the counterintuitive risk that repeated touches can exhaust, rather than strengthen, a level, referenced in this guide's core validation framework.analyzingalpha.com