
The Head and Shoulders Trading Strategy (And Inverse H&S)

In this article11 sections
Three peaks. The middle one taller than the other two, which sit at roughly equal height. It's the most recognized reversal shape in all of technical analysis, and it's also one of the most frequently misdiagnosed, because a trader who's already decided a stock is topping will find three peaks on almost any chart if they look hard enough.
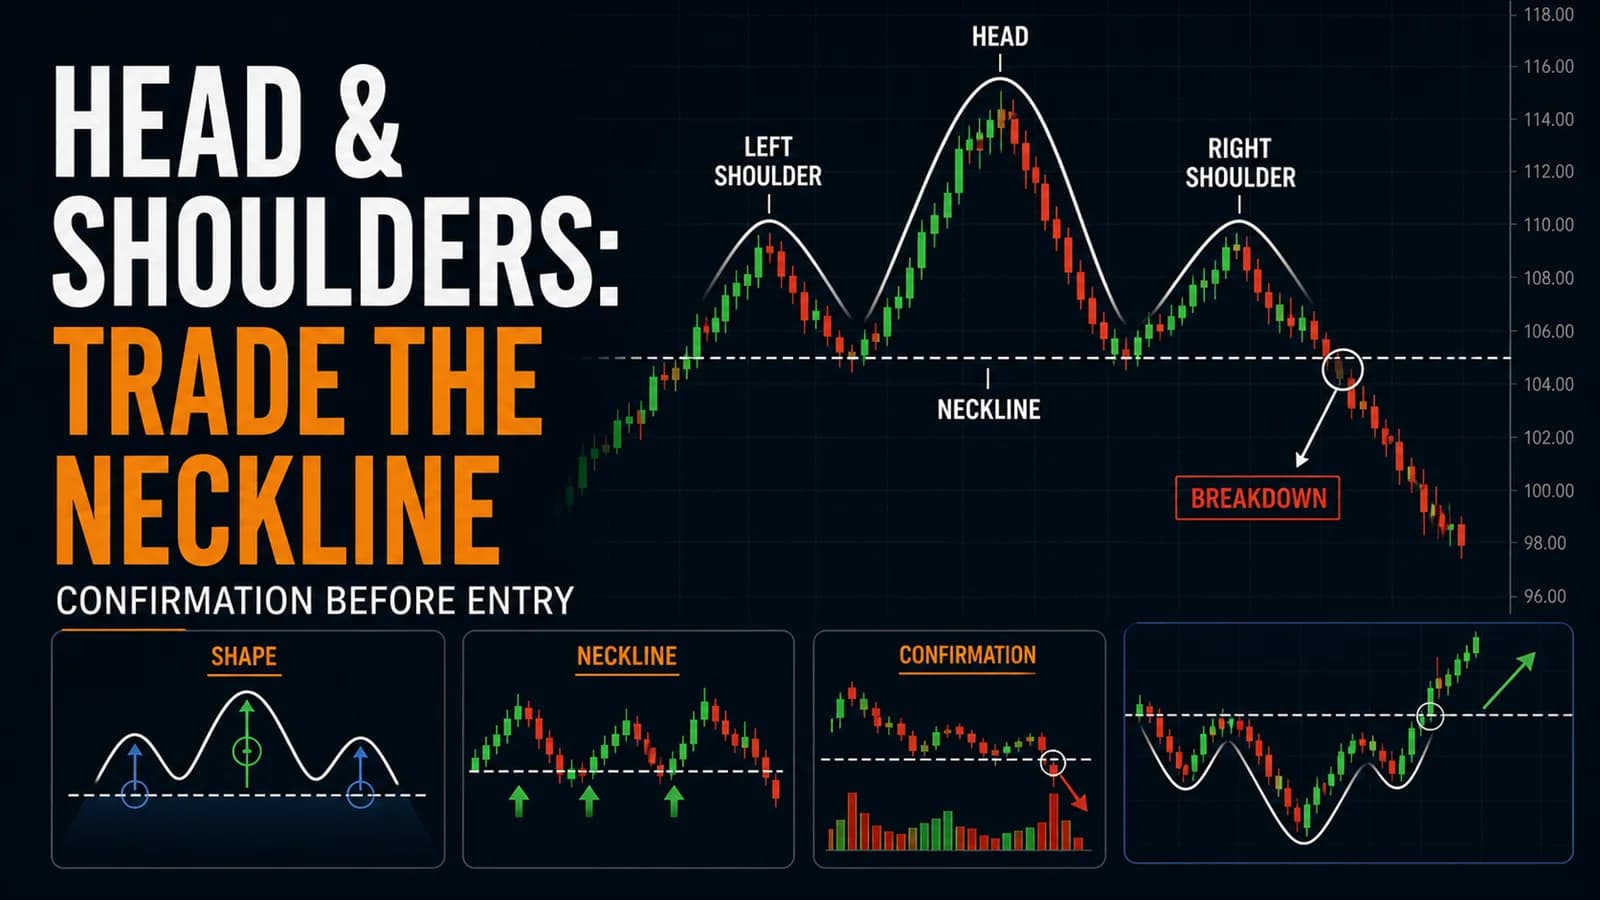
The head and shoulders pattern only earns its reputation when it's read correctly: as a neckline break, not a shape. The shape is just the setup. The neckline is the trade.
What is the head and shoulders pattern? The head and shoulders is a bearish reversal pattern made of three peaks: a left shoulder, a taller head, and a right shoulder that roughly matches the left shoulder's height, connected by a neckline drawn across the two troughs between them. The pattern confirms when price closes below the neckline, projecting a decline roughly equal to the distance from the head to the neckline. The inverse head and shoulders is its bullish mirror image, forming at the bottom of a decline instead of the top of a rally.
Why the Shape Alone Is Not the Signal
Plenty of stocks produce three peaks over the course of a session without ever forming a genuine head and shoulders. What separates a real pattern from three random local highs is the relationship between them: the head needs to be a clear, higher high than both shoulders, not just marginally higher, and the two shoulders need to sit at roughly comparable heights, not one dramatically higher than the other.
Just as important is what the pattern is a reversal of. A head and shoulders that forms after a genuine, sustained uptrend is a meaningfully different signal than the same three-peak shape appearing in a stock that's been chopping sideways all session with no real trend to reverse. This hub's guide to spotting market reversals through patterns and divergence covers the broader context a trader needs before treating any reversal shape, this one included, as tradeable.
The other common confusion is with a simple double top. A double top has two comparable peaks with a single trough between them. A head and shoulders needs three peaks and two troughs, with the middle peak standing clearly above the other two. This hub covers the double top and double bottom pattern separately, and the two patterns, while related in spirit, use different neckline geometry and different measured-move math.
The Conditions That Produce a Genuine Head and Shoulders Intraday
Best conditions: A stock (or index) that's had a real, sustained move before the pattern starts forming, not a flat, directionless session. The head and shoulders is fundamentally a story about exhaustion; without a real prior trend, there's nothing to exhaust.
Best time of day: The full pattern, left shoulder through right shoulder, typically needs at least ninety minutes to two hours to develop intraday with real structural integrity. Patterns that start forming in the pre-market session's momentum should complete no earlier than mid-morning; a pattern trying to form and confirm entirely within the last thirty minutes of the day rarely has the structural legitimacy of one that developed over a longer stretch.
Stock or index type: Works on individual stocks and on index products alike. Broad index products like SPY or QQQ tend to produce cleaner, more textbook versions during trend-exhaustion days, because the pattern reflects genuine aggregate sentiment shifting rather than one stock's idiosyncratic news flow.
Volume signature: A textbook head and shoulders top typically shows volume declining from the left shoulder to the head to the right shoulder, meaning each successive peak is made with less conviction than the last, even as price makes new intraday highs on the head. That declining-volume signature, more than the shape itself, is often the clearest early tell that a genuine reversal is building rather than a stock simply continuing to trend higher with a normal pullback in between.
The Setup Specification: Head and Shoulders Top (Bearish)
- Component
- Market Conditions Required
- Rule
- A real, sustained uptrend preceding the pattern; declining volume across the three successive peaks
- Component
- Time of Day
- Rule
- Full pattern development over at least 90 minutes to 2 hours; avoid treating a pattern that only started forming after 2:30 PM ET as fully confirmable same-day
- Component
- Stock Selection Criteria
- Rule
- Liquid enough to produce a clean neckline (not a jagged, gapping one); head clearly exceeds both shoulders by a meaningful margin, not a marginal one
- Component
- Entry Trigger
- Rule
- 1-minute or 5-minute candle closes below the neckline (drawn across the two troughs), on volume ≥ 1.5x the average of the prior ten bars
- Component
- Stop Loss
- Rule
- Above the right shoulder's high
- Component
- Initial Profit Target
- Rule
- Neckline minus (head high minus neckline), the standard measured-move projection; scale a third to half of the position at the 0.618x extension
- Component
- Trade Management
- Rule
- Trail the stop below the neckline level itself once price has cleared it by a meaningful margin, then below subsequent lower highs
- Component
- Invalidation Criteria
- Rule
- Price closes back above the neckline after an initial breakdown (a common "neckline pullback" that then fails to resume lower is a different signal, covered below); right shoulder exceeds the head's high
| Component | Rule |
|---|---|
| Market Conditions Required | A real, sustained uptrend preceding the pattern; declining volume across the three successive peaks |
| Time of Day | Full pattern development over at least 90 minutes to 2 hours; avoid treating a pattern that only started forming after 2:30 PM ET as fully confirmable same-day |
| Stock Selection Criteria | Liquid enough to produce a clean neckline (not a jagged, gapping one); head clearly exceeds both shoulders by a meaningful margin, not a marginal one |
| Entry Trigger | 1-minute or 5-minute candle closes below the neckline (drawn across the two troughs), on volume ≥ 1.5x the average of the prior ten bars |
| Stop Loss | Above the right shoulder's high |
| Initial Profit Target | Neckline minus (head high minus neckline), the standard measured-move projection; scale a third to half of the position at the 0.618x extension |
| Trade Management | Trail the stop below the neckline level itself once price has cleared it by a meaningful margin, then below subsequent lower highs |
| Invalidation Criteria | Price closes back above the neckline after an initial breakdown (a common "neckline pullback" that then fails to resume lower is a different signal, covered below); right shoulder exceeds the head's high |
The Setup Specification: Inverse Head and Shoulders (Bullish)
- Component
- Market Conditions Required
- Rule
- A real, sustained downtrend preceding the pattern; declining volume across the three successive troughs, often with a volume surge on the right shoulder's recovery
- Component
- Time of Day
- Rule
- Same 90-minute to 2-hour minimum formation window; strongest versions complete before 2:00 PM ET
- Component
- Stock Selection Criteria
- Rule
- Liquid enough for a clean neckline; head is a clearly lower low than both shoulders
- Component
- Entry Trigger
- Rule
- Candle closes above the neckline (drawn across the two peaks between the troughs), on volume ≥ 1.5x the prior ten-bar average
- Component
- Stop Loss
- Rule
- Below the right shoulder's low
- Component
- Initial Profit Target
- Rule
- Neckline plus (neckline minus head low); scale a third to half at the 0.618x extension
- Component
- Trade Management
- Rule
- Trail below the neckline once cleared, then below rising swing lows
- Component
- Invalidation Criteria
- Rule
- Price closes back below the neckline after breakout; right shoulder undercuts the head's low
| Component | Rule |
|---|---|
| Market Conditions Required | A real, sustained downtrend preceding the pattern; declining volume across the three successive troughs, often with a volume surge on the right shoulder's recovery |
| Time of Day | Same 90-minute to 2-hour minimum formation window; strongest versions complete before 2:00 PM ET |
| Stock Selection Criteria | Liquid enough for a clean neckline; head is a clearly lower low than both shoulders |
| Entry Trigger | Candle closes above the neckline (drawn across the two peaks between the troughs), on volume ≥ 1.5x the prior ten-bar average |
| Stop Loss | Below the right shoulder's low |
| Initial Profit Target | Neckline plus (neckline minus head low); scale a third to half at the 0.618x extension |
| Trade Management | Trail below the neckline once cleared, then below rising swing lows |
| Invalidation Criteria | Price closes back below the neckline after breakout; right shoulder undercuts the head's low |
The single most common technical mistake in trading either version is drawing the neckline as a perfectly horizontal line by default. Necklines are frequently sloped, angled up or down depending on whether the two troughs (top pattern) or two peaks (bottom pattern) sit at different price levels. A sloped neckline is still valid; the breakout trigger is a close beyond wherever that sloped line sits at the time of the candle in question, not beyond some flattened approximation of it.
A Walk-Through: A Head and Shoulders Top From Peak to Confirmation
Consider a heavily-traded semiconductor stock, ticker XYZ, that's rallied hard in the pre-market and continues higher after the open, running from $118.00 to a first peak of $124.60 by 10:05 AM ET on RVOL of 3.1x. That's the left shoulder. It pulls back to $121.80 by 10:22 AM, a trough that will define the left side of the neckline.
Buyers push back in, and XYZ makes a new high of $126.90 at 10:51 AM, this time on RVOL of only 2.2x, noticeably lighter than the left shoulder's push despite the higher price. That's the head. It pulls back again, this time to $121.50 by 11:15 AM, a trough that sits almost exactly level with the first one, defining a roughly horizontal neckline around $121.60 to $121.80.
XYZ attempts one more push higher, reaching $123.90 by 11:48 AM, clearly below the head's $126.90 and only modestly above the left shoulder's $124.60, on RVOL that's fallen further to 1.4x. That's the right shoulder, and the declining volume across all three peaks is the pattern's clearest tell that buying conviction has been fading with every attempt.
At 12:31 PM, a 5-minute candle closes at $121.15, below the neckline's roughly $121.70 level, on volume 1.8x the prior ten-bar average. A trader entering the short at $121.15 sets a stop above the right shoulder's $123.90 high, a $2.75 risk per share, and calculates the target: neckline ($121.70) minus the head-to-neckline distance ($126.90 minus $121.70, or $5.20), projecting toward roughly $116.50.
XYZ initially drops to $119.40 by 1:05 PM, a solid move past the 0.618x extension, where a trader following the plan scales out a portion of the position and moves the stop down to just above the neckline. The stock consolidates through the early afternoon before a broader market wobble accelerates the decline, and XYZ reaches $117.30 by the close, short of the full projection but a well-managed execution of the pattern nonetheless.
Managing the Trade After the Neckline Breaks
The neckline pullback is normal, not a failure signal, provided it doesn't close back above the line. A very common sequence, occurring roughly two-thirds of the time in the broader statistical research on this pattern, is price breaking the neckline, then drifting back up to retest it from underneath before resuming the decline. A trader who panics and covers on the first bounce toward the neckline is often exiting a still-valid trade prematurely; the actual invalidation condition is a close back above the neckline, not a wick or an intraday touch of it.
Volume on the breakdown candle matters more than the size of the first move. A neckline break on light volume is meaningfully less trustworthy than one on a clear volume expansion, even if the initial price move looks similar. This is consistent with the broader theme across this hub's breakout coverage: price without volume is a weaker signal than price with volume, and a three-peak pattern is no exception to that rule.
Trailing the stop at the neckline itself, once price has cleared it by a reasonable margin, is the cleanest way to lock in the trade's core thesis. Since the neckline pullback is such a common event, moving the stop to just above (short) or below (long) the neckline, rather than to the exact entry price, gives the trade room to survive that normal retest while still protecting against the pattern fully failing.
Where the Head and Shoulders Pattern Fails
Independent statistical research into this pattern, based on Thomas Bulkowski's large-sample study of confirmed formations on daily charts, found the head and shoulders top reaches its measured-move price target only about half the time, despite a relatively low break-even failure rate, meaning a meaningful share of confirmed breakdowns stall out well short of the full projected decline. The inverse head and shoulders bottom performed notably better in that same research, both in break-even failure rate and in the share of patterns reaching their full target. Both figures come from multi-week daily-chart research, not the compressed intraday version this guide covers, so treat them as evidence the underlying structural logic works, not as an exact intraday probability.
The most common real-world failure is misreading an ordinary pullback-and-continuation sequence in a strong trend as a head and shoulders top. A stock in a genuinely powerful uptrend can produce three peaks with a shallow dip between the second and third simply because trends don't move in a straight line; treating every such wiggle as a reversal pattern leads to shorting into strength repeatedly, a costly and avoidable mistake. The declining-volume signature described earlier in this guide is the best available filter against this specific failure, since a genuine continuation typically doesn't show the same fading conviction across all three peaks that a real reversal does.
A second failure mode is an asymmetric pattern being forced into the head and shoulders label. If the right shoulder is dramatically smaller or larger than the left shoulder, or if the two troughs sit at wildly different levels, the pattern lacks the structural symmetry that makes the measured-move projection meaningful in the first place. A trader tempted to draw a neckline through two very different-looking troughs just to complete a pattern they've already decided is there should treat that temptation as a warning sign, not a green light.
A third failure mode, specific to the intraday version, is a right shoulder that never fully forms because the session simply runs out of time. A head and shoulders that has a clear left shoulder and head by early afternoon, but whose right shoulder is still forming into the final hour of trading, is a pattern still in progress, not a confirmed setup, regardless of how compelling the first two-thirds of the shape already look.

Variations Worth Knowing
The complex head and shoulders has two left shoulders and two right shoulders instead of one each, essentially a five- or seven-peak version of the same underlying exhaustion story. These take longer to form and are less common intraday, but the same neckline-break logic applies once the full structure is visible.
The sloped-neckline version is more common than the textbook horizontal neckline and simply requires drawing the line through the actual troughs (or peaks, for the inverse) rather than forcing a flat line onto an unequal structure. A rising neckline on a top pattern is actually a stronger bearish signal when broken, since it means sellers overcame not just a static level but a rising one.
The failed head and shoulders, where price breaks the neckline, reverses, and pushes back above the right shoulder's high, is itself a tradeable signal in the opposite direction, similar in spirit to this hub's failed breakout, bull trap, and bear trap guide. A head and shoulders that fails this dramatically often triggers a fast short squeeze as trapped short sellers cover.
Tools for Confirming the Pattern in Real Time
Manually tracking peak heights, trough levels, and the volume signature across three separate swings, in real time, across a watchlist, is genuinely difficult without help. A scanner capable of flagging declining relative volume across successive price highs, such as Trade Ideas, can surface candidates showing the fading-conviction signature this pattern depends on well before the third peak and neckline break are visible to the naked eye.
A charting platform with a reliable trendline and measured-move tool is essential here too, since an inaccurately drawn neckline throws off both the entry trigger and the price target. For a broader look at charting platforms suited to pattern work like this, see the tools and reviews section.
How This Pattern Fits a Complete Trading Plan
The head and shoulders is a reversal-hunting tool, and it belongs in a trading plan alongside other reversal confirmation methods rather than as a lone signal to act on. Pairing it with this hub's reversal trading playbook for the broader context of what makes any reversal attempt credible, and with trendline and channel reading for the underlying skill of drawing an accurate neckline, gives the pattern more support than trading the shape in isolation.
Because the stop sits at a specific structural level, above the right shoulder for the top pattern, below it for the inverse, position sizing should be calculated directly from that distance using standard risk-per-trade math rather than a flat share count applied regardless of how wide or tight that particular pattern's shoulder-to-neckline distance happens to be.
Frequently Asked Questions
How much taller does the head need to be than the shoulders to count?
There's no single hard percentage, but the difference should be visually unambiguous on the chart, not something that requires squinting to confirm. A head that's only fractionally higher than the shoulders is a weak version of the pattern and behaves more like a rounded, choppy top than a genuine three-peak exhaustion signal.
Key Takeaway: Require a clearly, not marginally, higher head before treating the setup as a real head and shoulders rather than an ordinary choppy top.
What's the difference between a head and shoulders top and a simple lower-high, lower-low reversal?
The head and shoulders is a more specific, stricter subset of reversal behavior, with its own measured-move math tied directly to the head's height above the neckline, which a generic lower-high sequence doesn't provide.
Key Takeaway: Treat the head and shoulders as a precise, measurable version of a broader reversal concept, not as interchangeable with any lower-high, lower-low sequence.
Why does the pattern's volume need to decline across the three peaks?
That fading conviction is the actual underlying story the pattern is trying to capture; the three-peak shape is just the visual result of that conviction running out in stages.
Key Takeaway: Use the volume signature as the real diagnostic tool, and treat the three-peak shape as its visual byproduct rather than the primary evidence.
Is the neckline pullback after a breakdown a sign the trade is failing?
Covering a short position on that retest alone often means exiting a still-intact trade too early.
Key Takeaway: Only treat a close back above the neckline, not a mere touch or wick toward it, as the actual invalidation signal.
Can this pattern be traded on a 1-minute chart, or does it need a longer timeframe?
A 5-minute chart is generally the better balance for this specific pattern, giving enough resolution to catch the setup within a single session while filtering out some of the 1-minute chart's noise.
Key Takeaway: Default to the 5-minute chart for head and shoulders patterns unless a specific, fast-moving low-float stock genuinely requires the 1-minute view.
How does the inverse head and shoulders differ in reliability from the standard top pattern?
That asymmetry is consistent with a broader pattern in market behavior: bullish reversals off of fear-driven lows often complete more reliably than bearish reversals off of greed-driven highs.
Key Takeaway: Treat the inverse head and shoulders as the statistically stronger of the two versions based on longer-timeframe research, while still applying the same intraday confirmation discipline to both.
What happens if the right shoulder breaks above the head's high before the neckline even breaks?
A right shoulder that exceeds the head's high means the stock made a genuine new high instead, which is a continuation signal, not a reversal one, and the setup should be abandoned rather than relabeled.
Key Takeaway: A right shoulder that breaks the head's high is a hard invalidation, not a reason to redraw the pattern with a new, higher head.
Should a trader wait for the neckline break, or can the right shoulder's rejection be traded directly?
Some experienced traders do take an earlier, smaller position on a clear right-shoulder rejection, but that's a higher-risk variation on the base setup, not the base setup itself, since no neckline level has been established yet as the invalidation point.
Key Takeaway: Treat the neckline break as the actual entry trigger, and any earlier right-shoulder entry as an aggressive variation that carries meaningfully more risk.
How does this pattern interact with the broader market trend?
Checking index-level context before committing to either version of this pattern is a meaningful part of confirming it.
Key Takeaway: Weight this pattern's conviction by whether the broader market trend supports or fights the direction it's signaling.
What's the biggest mechanical mistake traders make measuring the price target?
The measured-move formula specifically uses the distance from the head to the neckline, not from either shoulder, and using the wrong reference point produces a meaningfully different, usually smaller, target than the pattern actually projects.
Key Takeaway: Always measure the projected move from the head to the neckline specifically, not from either shoulder.
Disclaimer
Article Sources
- StockCharts ChartSchool: Chart Patterns - reference library covering classic reversal pattern structures
- StockCharts ChartSchool: Introduction to Candlesticks - foundational reading on reading price bars within a larger reversal structure
- FINRA: Understanding the New Intraday Margin Requirements - current regulatory framework for day-trading accounts
- FINRA Rule 2270: Day-Trading Risk Disclosure Statement - regulatory baseline for day-trading risk disclosure
- CME Group: Futures — Looking Beyond Technical Analysis - exchange-level perspective on the limits of pattern-based analysis
Was this helpful?
Be the first to weigh in

Written by
Kazi Mezanur RahmanFounder, independent researcher, and editor of DayTradingToolkit. A one-person publication focused on risk-first trading education and documented tool research. He trades his own capital as a retail trader and combines personal market experience with systematic primary-source research.
Keep Reading
Strategies
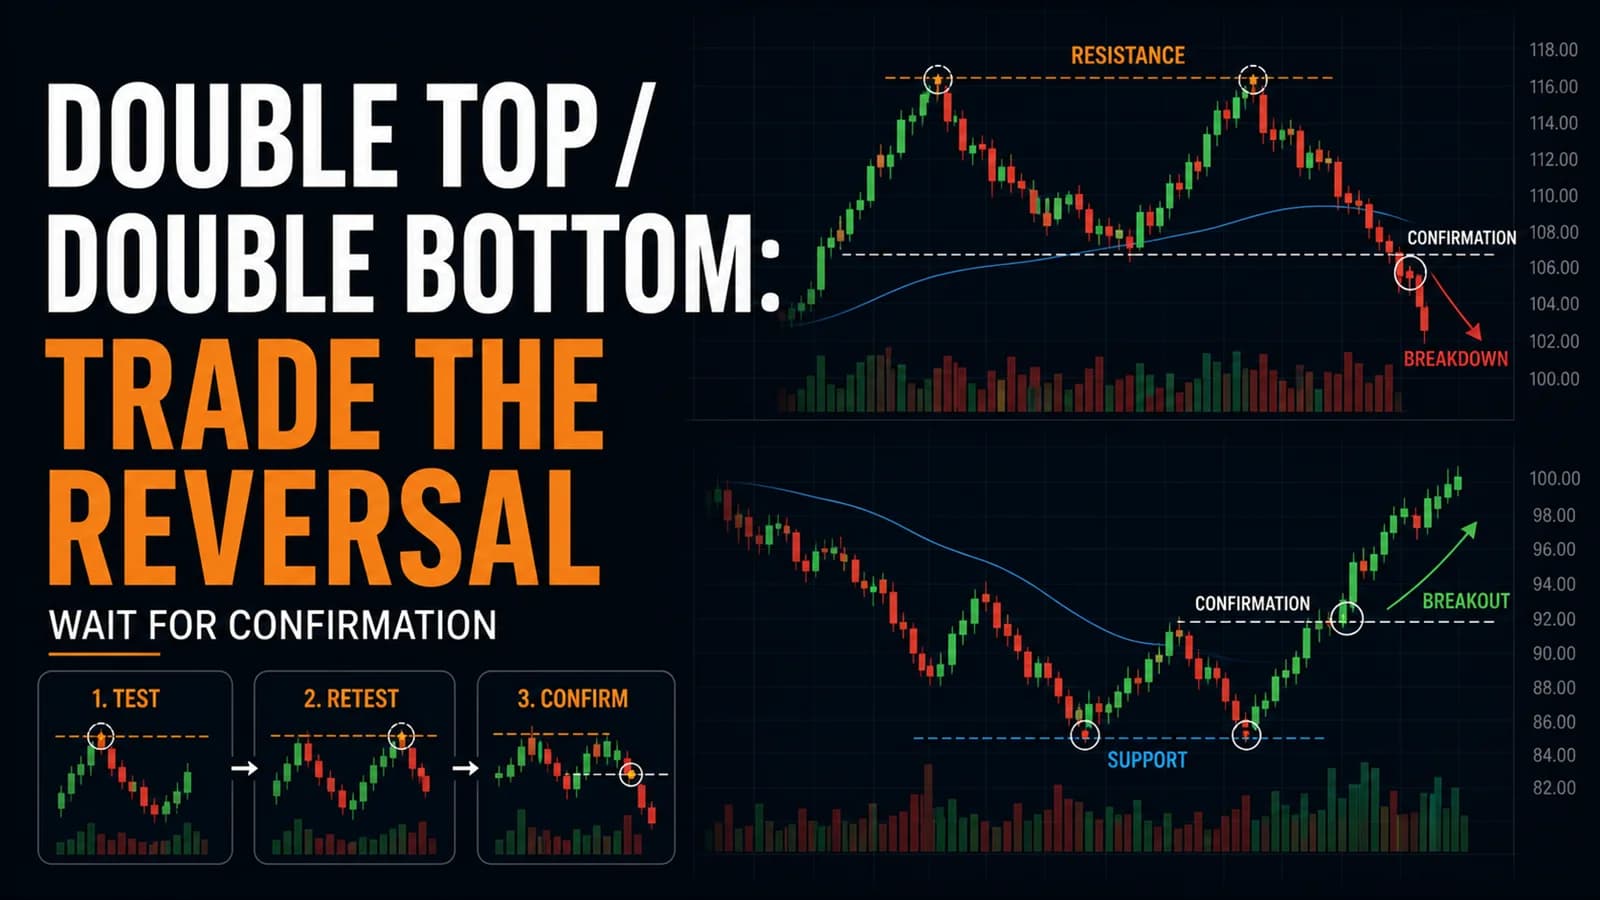
The Double Top / Double Bottom Trading Strategy
Most double tops never confirm. Here's the confirmation line that separates a real reversal from two random peaks, plus the honest failure rate behind each.
Strategies
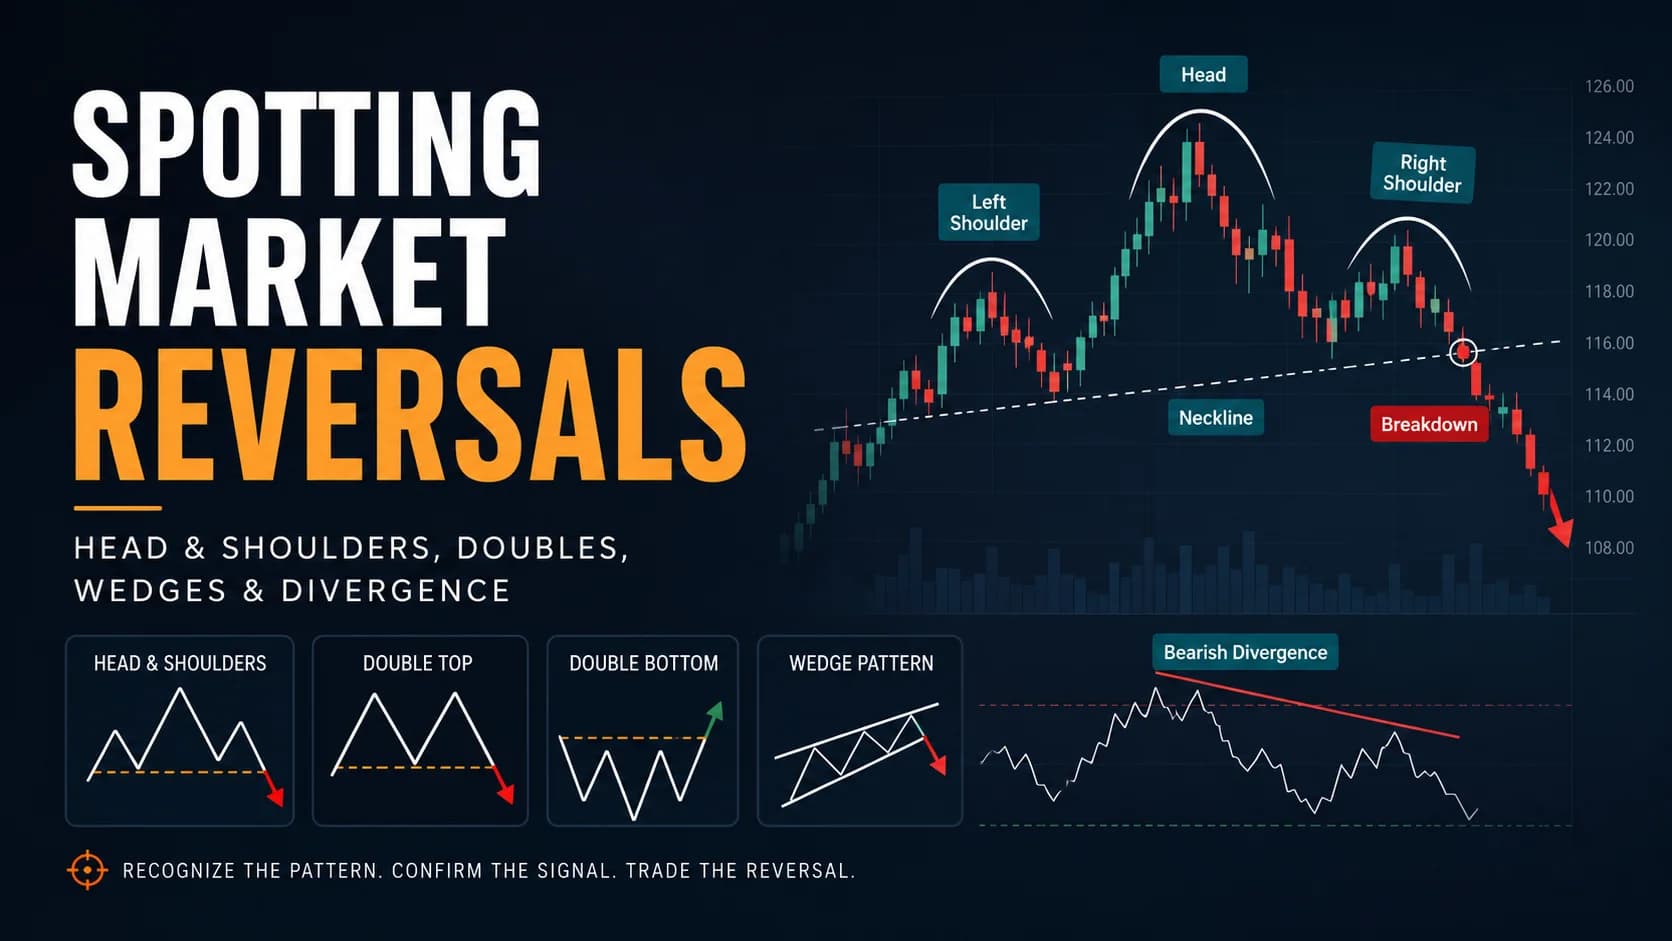
Calling the Turn: Spotting Market Reversals Using Patterns & Divergence
Every reversal pattern tells the same story of failing momentum. This guide covers the anatomy, entry mechanics, and stop placement for each major setup.
Strategies
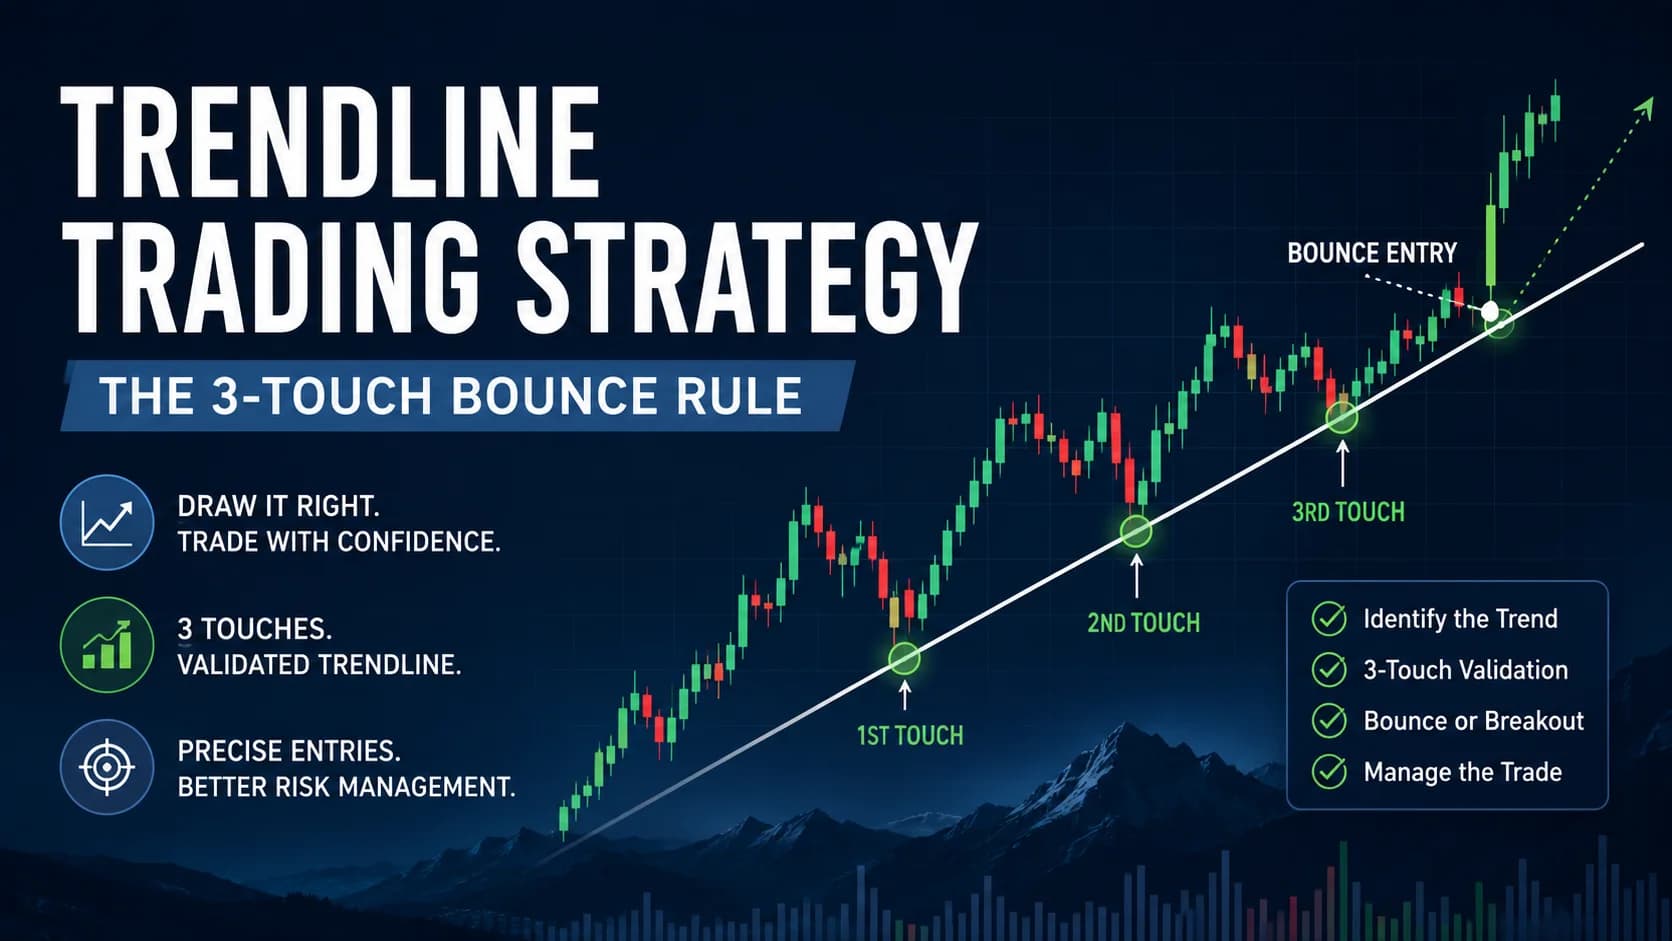
Drawing the Lines: Using Trendlines & Channels Like a Pro
A mechanical trendline trading strategy: how to draw a valid line, the 3-touch rule, bounce entries, breakout retests, and price channels — with exact entry, stop, and target rules.
Strategies
The Reversal Trading Playbook: How to Call a Market Turn
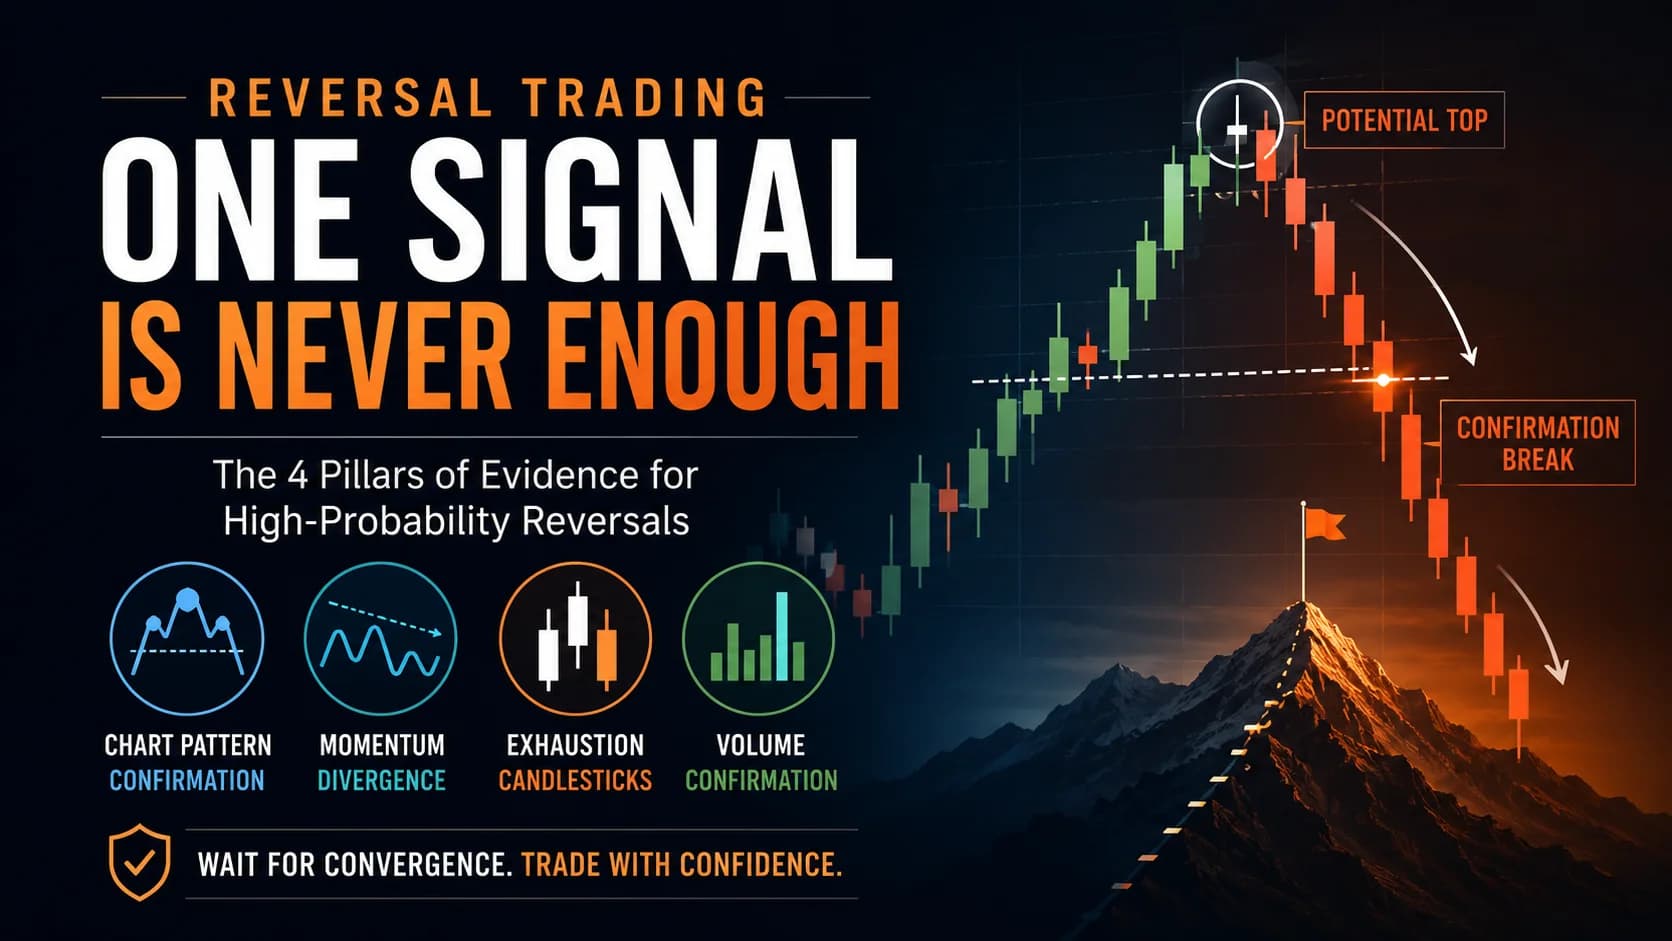
No single indicator calls a top or bottom. This guide covers the four pillars of reversal evidence and how many need to align before a trade is justified.
Comments
No comments yet. Be the first to share your thoughts.