
The Flat Top Breakout Strategy (a.k.a. Ascending Triangle Day Play)

In this article11 sections
A stock tests $14.00 three times in an hour, each pullback shallower than the last. Most day traders call that a flat top and wait for the break. Few of them check whether it actually qualifies as the pattern they think it is, and fewer still know that the same setup performs very differently depending on which way it eventually breaks. One direction has real, documented edge behind it. The other doesn't, and treating them as mirror images of each other is a mistake the data specifically warns against.
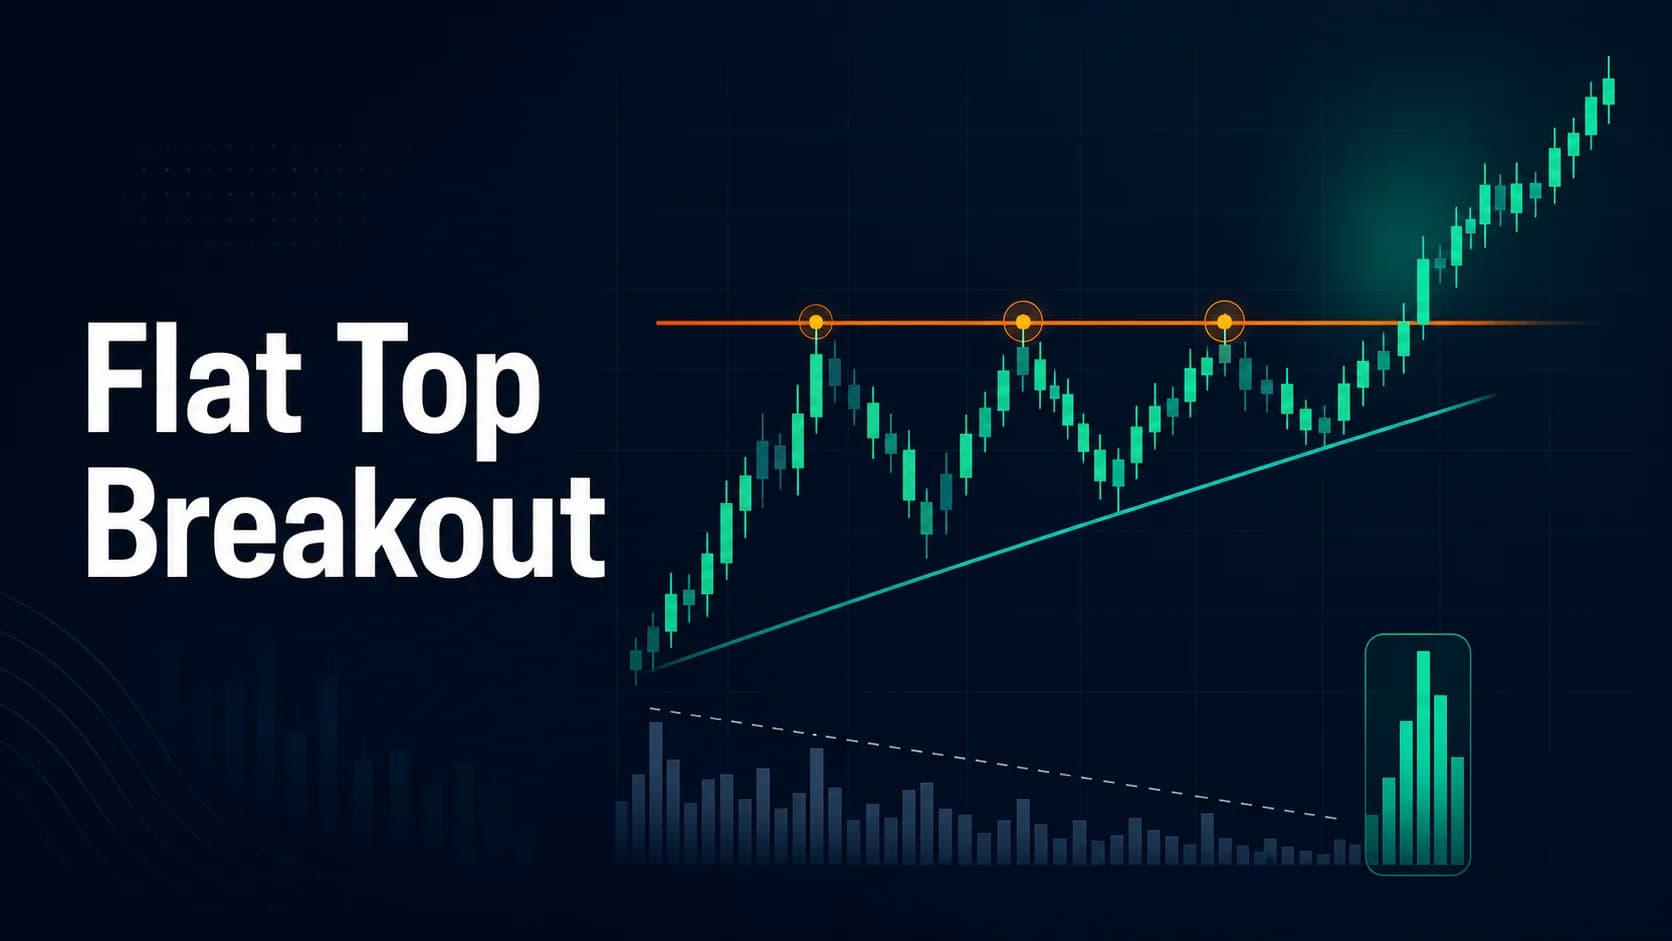
What is a flat top breakout? A flat top breakout, formally known as an ascending triangle, is a chart pattern where price repeatedly tests a flat horizontal resistance level while forming a series of rising lows underneath it, before eventually breaking through that resistance. It reflects buyers growing more aggressive with each test while sellers defend a fixed price.
Not Every Flat Top Is a Real Pattern: The Touch Requirement
Most traders draw a flat top off two touches of resistance and a couple of rising lows and call it done. Thomas Bulkowski's formal identification criteria set a higher bar, and it's worth using the real standard rather than the loose version. Price needs to touch the horizontal resistance line at least three times and the rising support line at least twice, forming genuinely distinct peaks and valleys, not just two isolated touches connected by a straight line drawn optimistically.
Price also needs to actually cross back and forth through the pattern, filling it with real price movement rather than leaving large empty gaps inside the triangle's boundaries. A pattern with wide, empty white space inside it is a weaker, less reliable version than one where price genuinely oscillates between the two boundaries.
Volume is part of the identification here too. Bulkowski's data found volume trends downward during the pattern's formation at least 78% of the time, an even higher rate than the flag patterns covered elsewhere on this hub. A flat top forming on expanding or erratic volume between touches is showing a different, less reliable dynamic than one forming on genuinely fading interest.
The Psychology: Why Buyers Keep Getting More Aggressive Into Resistance
The flat resistance level represents a specific group of sellers defending a fixed price, whether that's the prior day's high, a round number, or a level where earlier buyers are simply willing to sell to break even. Each time price approaches that level and gets turned away, it should, in theory, keep falling back to roughly the same place. Instead, the lows keep rising.
That rising-low pattern reflects buyers becoming more willing to pay up rather than waiting for a full retracement. A trader who initially wanted to buy at $12.80 and watched the stock reverse without getting back there is a different, more urgent buyer the second time, willing to step in at $13.40 instead. Each higher low is evidence of shrinking patience among buyers and unchanged resolve among the sellers defending resistance, a genuine tug of war rather than a random consolidation, and it's exactly the dynamic that eventually overwhelms the sellers defending the flat top.
The Real Numbers: A Decent Long Setup, a Weak Short One
Here's the detail that makes this pattern genuinely different from the flags covered elsewhere on this hub: it isn't symmetric. Bulkowski's own summary of the ascending triangle is blunt about it: a decent performer after an upward breakout, but one that suffers after a downward breakout.
The numbers back that up clearly. For upward breakouts, the break-even failure rate is 17%, the average rise is 43%, and the pattern ranks 16th out of 39 bullish patterns in Bulkowski's broader database, a genuinely respectable showing. For downward breakouts, the break-even failure rate jumps to 38%, more than double, the average decline is a modest 13%, and the pattern ranks 30th out of 36 bearish patterns, close to the bottom of the list.
That asymmetry has a direct practical consequence. Treating an ascending triangle's downward breakout as a mirror-image short trade of the upward breakout's long trade isn't supported by the data. The pattern's real, documented edge lives almost entirely on the long side.
When the Breakout Fails: Busted Triangles and the Apex Timing Detail
The downward breakout's weak numbers connect to something covered elsewhere on this hub. Bulkowski's research found that 46% of ascending triangles with downward breakouts eventually bust, reversing and breaking back out the top of the pattern instead, averaging a 36% rise once that happens. This is the same busted-pattern phenomenon covered in this hub's guide to bull traps and bear traps, applied specifically to this pattern: a downward break of an ascending triangle is close to a coin flip on whether it's a real breakdown or the setup for a bullish reversal, which is a meaningfully different situation than the reasonably reliable upward break.
One more timing detail is worth knowing before setting up the entry. Bulkowski's data found breakouts tend to occur when price has moved about 64% of the way toward the triangle's eventual apex, the point where the two trendlines would fully converge. Waiting for price to reach the actual apex before expecting a resolution misreads how these patterns typically behave; the breakout usually happens well before the lines fully meet, not at the point of maximum compression.
The Flat Top Breakout Setup Specification
Every component below focuses on the upward breakout, where the pattern's documented edge actually lives.
- Component
- Market Conditions Required
- Rule
- A genuine flat resistance level tested at least three times, with at least two clearly rising lows underneath it; broad market not fighting the direction of the move.
- Component
- Time of Day
- Rule
- Most reliable during the 9:45 AM to 3:30 PM ET window; a flat top that forms in the first 15 minutes off the open carries less information.
- Component
- Stock Selection Criteria
- Rule
- Price genuinely crossing back and forth inside the pattern rather than leaving large gaps of empty space; volume fading between touches rather than expanding.
- Component
- Entry Trigger
- Rule
- A close above the flat resistance level on volume clearly above the fading pace seen during the pattern's formation, not a break on the same thin volume.
- Component
- Stop Loss
- Rule
- Below the most recent rising low inside the pattern, or below the lowest valley in the pattern for a wider, more conservative version.
- Component
- Initial Profit Target
- Rule
- The pattern's height (resistance level minus the lowest valley), multiplied by the roughly 70% historical target-hit rate, added to the breakout price.
- Component
- Trade Management
- Rule
- Scale a portion at the measured target, trail the remainder if volume stays elevated and price continues making higher lows.
- Component
- Invalidation Criteria
- Rule
- Price closes back below the most recent rising low, volume on the breakout runs no higher than the fading volume seen during the pattern's formation, or a new peak forms at a lower high than the prior one (a multi-peak warning sign covered below).
| Component | Rule |
|---|---|
| Market Conditions Required | A genuine flat resistance level tested at least three times, with at least two clearly rising lows underneath it; broad market not fighting the direction of the move. |
| Time of Day | Most reliable during the 9:45 AM to 3:30 PM ET window; a flat top that forms in the first 15 minutes off the open carries less information. |
| Stock Selection Criteria | Price genuinely crossing back and forth inside the pattern rather than leaving large gaps of empty space; volume fading between touches rather than expanding. |
| Entry Trigger | A close above the flat resistance level on volume clearly above the fading pace seen during the pattern's formation, not a break on the same thin volume. |
| Stop Loss | Below the most recent rising low inside the pattern, or below the lowest valley in the pattern for a wider, more conservative version. |
| Initial Profit Target | The pattern's height (resistance level minus the lowest valley), multiplied by the roughly 70% historical target-hit rate, added to the breakout price. |
| Trade Management | Scale a portion at the measured target, trail the remainder if volume stays elevated and price continues making higher lows. |
| Invalidation Criteria | Price closes back below the most recent rising low, volume on the breakout runs no higher than the fading volume seen during the pattern's formation, or a new peak forms at a lower high than the prior one (a multi-peak warning sign covered below). |
The measured target here uses a different calculation than the flag patterns covered elsewhere on this hub. Bulkowski's measure rule for triangles multiplies the pattern's full height by the percentage of patterns that historically met their target, rather than projecting the full height outright, which produces a more conservative, historically-grounded number than a simple one-to-one height projection would.
A Walkthrough: Trading a Flat Top Breakout on a Hypothetical Intraday Chart
Consider a hypothetical stock, ticker DNH, to show the mechanics. None of the prices or times below describe an actual company.
DNH tests resistance at $14.00 three separate times over the first ninety minutes of the session. The first pullback finds support at $12.80, the second at $13.10, the third at $13.40, each higher than the last, while volume on each approach to resistance runs progressively lighter than the one before it. That's a genuine ascending triangle: three touches on the flat top, three rising lows, real price movement filling the pattern rather than empty gaps.
At 11:15 AM ET, DNH closes above $14.00 on volume running roughly three times the pace seen during the quiet approach to resistance. That close is the entry trigger. A stop goes in just below $13.40, the most recent rising low.
The pattern's height is $1.20 ($14.00 minus the $12.80 low). Using the roughly 70% target-hit rate, the measured target projects to about $14.84 ($14.00 plus 70% of $1.20). DNH reaches $14.70 by 11:50 AM, where a portion of the position is scaled off, with the remainder trailing behind the developing higher lows. DNH continues to $15.10 by 12:20 PM before volume tapers off, and the remaining position closes near $14.95, beyond the conservative measured target and capturing a meaningful share of the broader move that followed genuine, volume-confirmed continuation.
Managing the Trade Once Price Clears Resistance
The measured target from the pattern's height is a conservative reference point, not a hard ceiling. Genuine continuation, consistent with this pattern's documented edge on the long side, often runs well past that initial target when volume stays elevated and price keeps printing higher lows, which is why scaling a portion at the target while trailing the rest is more consistent with the data than treating the target as a full exit.
The clearer signal to tighten up is volume fading back toward the pattern's quiet, pre-breakout pace without fresh highs forming. A breakout that runs for a few minutes and then goes quiet on thinning volume is behaving like a move that's already spent the participation that drove it, regardless of how far short of the measured target price has gotten.

Where This Strategy Fails: Multi-Peaks and Two-Touch Impostors
The most common failure is trading a pattern that doesn't actually meet the touch requirement, two isolated tests of resistance connected by an optimistic trendline, rather than the genuine three-touch, two-touch structure the data is actually based on. A pattern that technically has a flat top and an upward-sloping line underneath it isn't automatically the same setup Bulkowski's statistics describe.
A second failure is a multi-peak pattern, where resistance gets tested more than the minimum three times at a series of peaks that don't clearly rise or that show weakening momentum on each approach. Bulkowski's research flags multi-peak patterns as a bearish tell specifically; a bullish pattern can still break out upward in this situation, but the rise afterward often fails to travel far, undermining the setup's usual edge.
A third failure is trading the downward breakout as though it carried the same reliability as the upward one. As covered above, the downward break's numbers are meaningfully worse, and treating it as a clean mirror-image short ignores both the weaker standalone statistics and the high rate at which downward breaks reverse into bullish busts instead.
A fourth is breaking out on the same fading volume that defined the pattern's formation. A close above resistance with no accompanying pickup in participation is a weak, unconfirmed signal, closer to a drift through a level than genuine buying pressure finally overwhelming the sellers who had been defending it.
Scanning for Triangles Forming in Real Time
Manually tracking which stocks are building a genuine multi-touch flat top, as opposed to a random sideways drift that happens to bounce near a similar level twice, is difficult to do across a watchlist without a dedicated tool.
Trade Ideas works as a comprehensive scanning and research platform for this job, with built-in charting that makes it straightforward to review whether a stock's recent price action actually shows the rising-low structure this pattern requires, alongside real-time volume to confirm the breakout when it happens. The scan surfaces candidates worth a closer look; confirming the genuine touch count, the volume-fade signature, and the entry trigger above still governs whether a position gets taken.
Fitting the Flat Top Breakout Into a Complete Trading Plan
It's worth being direct about how this setup relates to a simpler one covered elsewhere on this hub. Trading the prior-day high or low requires no pattern shape at all, just a single reference level from the prior session. A flat top breakout is a meaningfully stricter setup: the resistance level needs multiple genuine touches and a series of rising lows underneath it, not just a single level being approached once. A stock can offer a prior-day-high breakout without ever forming a genuine flat top, and the two setups shouldn't be treated as interchangeable just because both involve breaking a horizontal level.
This setup also assumes the general breakout confirmation checklist covered elsewhere on this hub, applied specifically to the flat resistance line as the level being broken, along with chart pattern basics and reading volume, since so much of what separates a genuine pattern from an impostor depends on volume and touch count rather than a rough visual impression.
The psychological trap specific to this setup is calling a pattern "done" after just two touches and jumping in early, rather than waiting for the third touch and the rising-low structure the data actually describes. This guide's coverage of FOMO in trading applies directly: an incomplete pattern hasn't earned the statistics this guide cites, and entering on a two-touch version trades a hope for the actual, better-supported setup. This strategy belongs on the Strategies Hub as this module's clearest example of a pattern with a genuinely asymmetric edge, useful precisely because it rewards trading the direction the data actually supports rather than assuming both breakout directions are equally valid.
Common Questions About Trading Flat Top Breakouts
Is a flat top breakout the same thing as an ascending triangle?
The formal name matters mainly for finding the underlying research; Bulkowski's statistics and identification criteria are published under "ascending triangle," and this guide's setup specification is built directly from that data.
Key Takeaway: Both names describe the same pattern; the statistics behind it are published under the formal name.
Why does this pattern perform so differently depending on which way it breaks?
The pattern's underlying psychology, buyers growing more aggressive against a fixed resistance level, is fundamentally a bullish dynamic, which likely explains why the edge concentrates so heavily on the upward breakout side.
Key Takeaway: Don't treat the downward breakout as a mirror-image trade of the upward one; the data doesn't support that symmetry.
What's a "busted" downward breakout, and why does it matter here?
That high bust rate is part of why the downward breakout's standalone statistics are weak; a meaningful share of apparent breakdowns aren't genuine continuations at all.
Key Takeaway: A downward break of this pattern is closer to a coin flip between a real breakdown and a bullish reversal setup.
How many times does price actually need to touch the trendlines for this to count as a real pattern?
A pattern that falls short of this touch count is a weaker, less-defined version than the one Bulkowski's statistics actually describe, and trading it on the same confidence level overstates what the research supports.
Key Takeaway: Count the actual touches before treating a rough flat top as a confirmed pattern.
How is the price target calculated for this pattern?
This is a more conservative calculation than a simple full-height projection, and it's grounded specifically in how often this pattern has historically reached that measured level, not an assumed one-to-one move.
Key Takeaway: The 70% multiplier makes this a historically-calibrated target, not the full pattern height projected outright.
What is a multi-peak pattern, and why is it a warning sign?
An upward breakout can still occur from a multi-peak version, but the rise afterward often fails to travel far, undermining the reliability this pattern normally offers.
Key Takeaway: More touches aren't automatically better; watch whether each peak is genuinely weaker or stronger than the last.
How is this different from just trading a breakout of the prior day's high?
A stock can offer a prior-day-high breakout without ever forming a real ascending triangle, and the two setups carry different statistical backing as a result.
Key Takeaway: Every flat top breakout could coincide with a prior-day-high level, but not every prior-day-high breakout is a flat top pattern.
Should the apex of the triangle be used as a timing signal for the breakout?
Waiting for price to reach the true apex before expecting a move misreads how this pattern typically resolves; by that point, the breakout has usually already happened.
Key Takeaway: Expect resolution before the lines fully converge, not at the point of maximum compression.
What tool or filter would help find a genuine flat top forming in real time?
Trade Ideas, covered earlier in this guide, handles this job well, surfacing candidates worth a closer look and providing the charting needed to confirm the pattern's structure before the breakout happens.
Key Takeaway: A scanner narrows the field; confirming the actual touch count and structure still requires looking at the chart directly.
Disclaimer
Article Sources
- Ascending Triangles, ThePatternSite.com - the primary source for identification criteria and the asymmetric performance statistics between upward and downward breakouts covered throughout this guide
Was this helpful?
Be the first to weigh in

Written by
Kazi Mezanur RahmanFounder, independent researcher, and editor of DayTradingToolkit. A one-person publication focused on risk-first trading education and documented tool research. He trades his own capital as a retail trader and combines personal market experience with systematic primary-source research.
Keep Reading

Strategies
Trading the Breakout of Prior-Day High/Low Levels
PDH and PDL need no formula, just yesterday's range. This guide covers the breakout, the liquidity-sweep fade, and why stops cluster right at these levels.

Strategies
Trading Breakouts From Consolidation: The Volatility Contraction Pattern
The VCP isn't just a volatility squeeze. This guide covers the staged contraction sequence, the pivot point, and why context matters as much as the pattern.

Strategies
The 52-Week High Breakout Strategy: Trading Stocks at New Highs
Investors anchor on the 52-week high, and that bias is exactly why breaking it carries real weight. This guide covers the research and trading the breakout.
Strategies
The Retest Strategy: How to Trade the Pullback After a Breakout
Retests offer a better entry price, but the data shows breakouts that never look back tend to perform better. This guide covers trading the retest honestly.
Comments
No comments yet. Be the first to share your thoughts.