Every actively traded stock eventually pulls back. The question a TrendA trend is a sustained directional movement in price over time — an uptrend is characterized by a sequence of higher highs and higher lows, a downtrend by lower highs and lower lows — and correctly identifying the current trend direction isRead definition → trader actually needs answered isn't whether a PullbackA pullback is a temporary counter-trend price movement within an established trend — in an uptrend, a pullback is a short-term decline that offers a lower-risk entry point before the trend resumes, as opposed to a reversal which signals theRead definition → is coming, it's where the pullback is likely to stop. The 20 EMA has earned its place as one of the most watched answers to that question, not because of anything magical about the number twenty, but because it consistently sits at the depth where a healthy pullback in an established trend tends to find buyers without giving up too much of the move already banked.
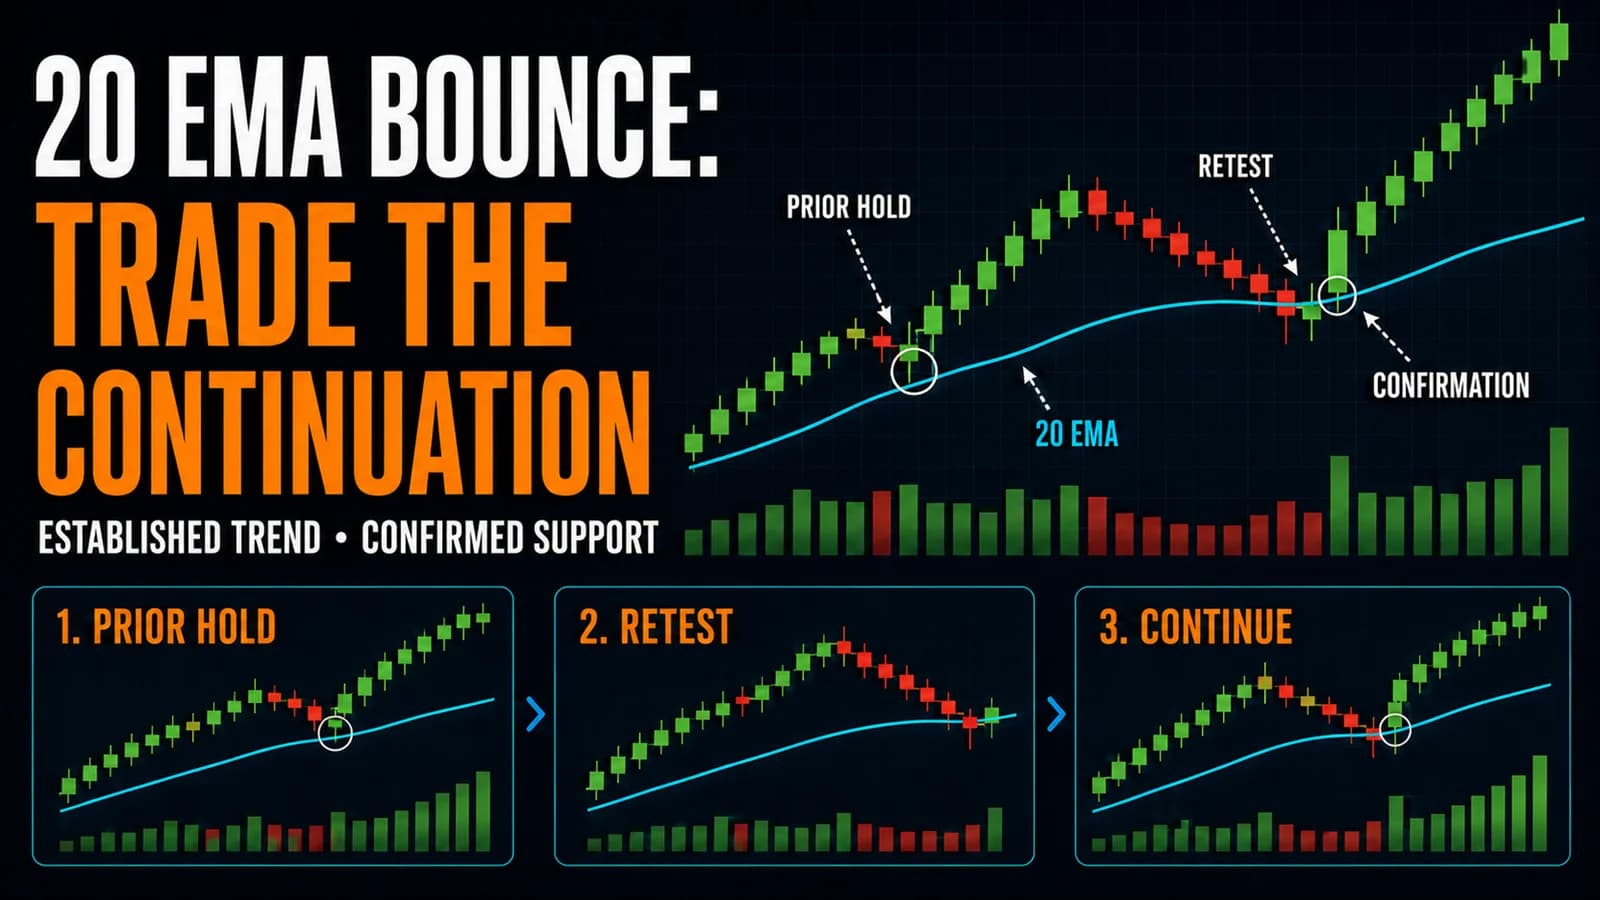
What is the 20 EMA bounce strategy? The 20 EMA bounce is a trend continuation setup where a trader enters a position when price retraces to the 20-period Exponential Moving AverageAn exponential moving average (EMA) is a moving average that weights recent price data more heavily than older data — making it faster to react to new price movement than a simple moving average of the same length.Read definition → during an established trend and shows signs of holding, treating the average as a moderate-depth SupportSupport is a price level where buying pressure has historically overcome selling pressure, causing price to stop declining and reverse — it's the floor where demand enters the market, and when it holds, it's a potential long entry; when it Read definition → or ResistanceResistance is a price level where selling pressure has historically overcome buying pressure, causing price to stall, reverse, or consolidate — it's the ceiling where supply enters the market and where breakout traders watch for either a coRead definition → zone that's calmer and more established than a faster average like the 9 EMA.
A Slower, More Established Signal Than the 9 EMA
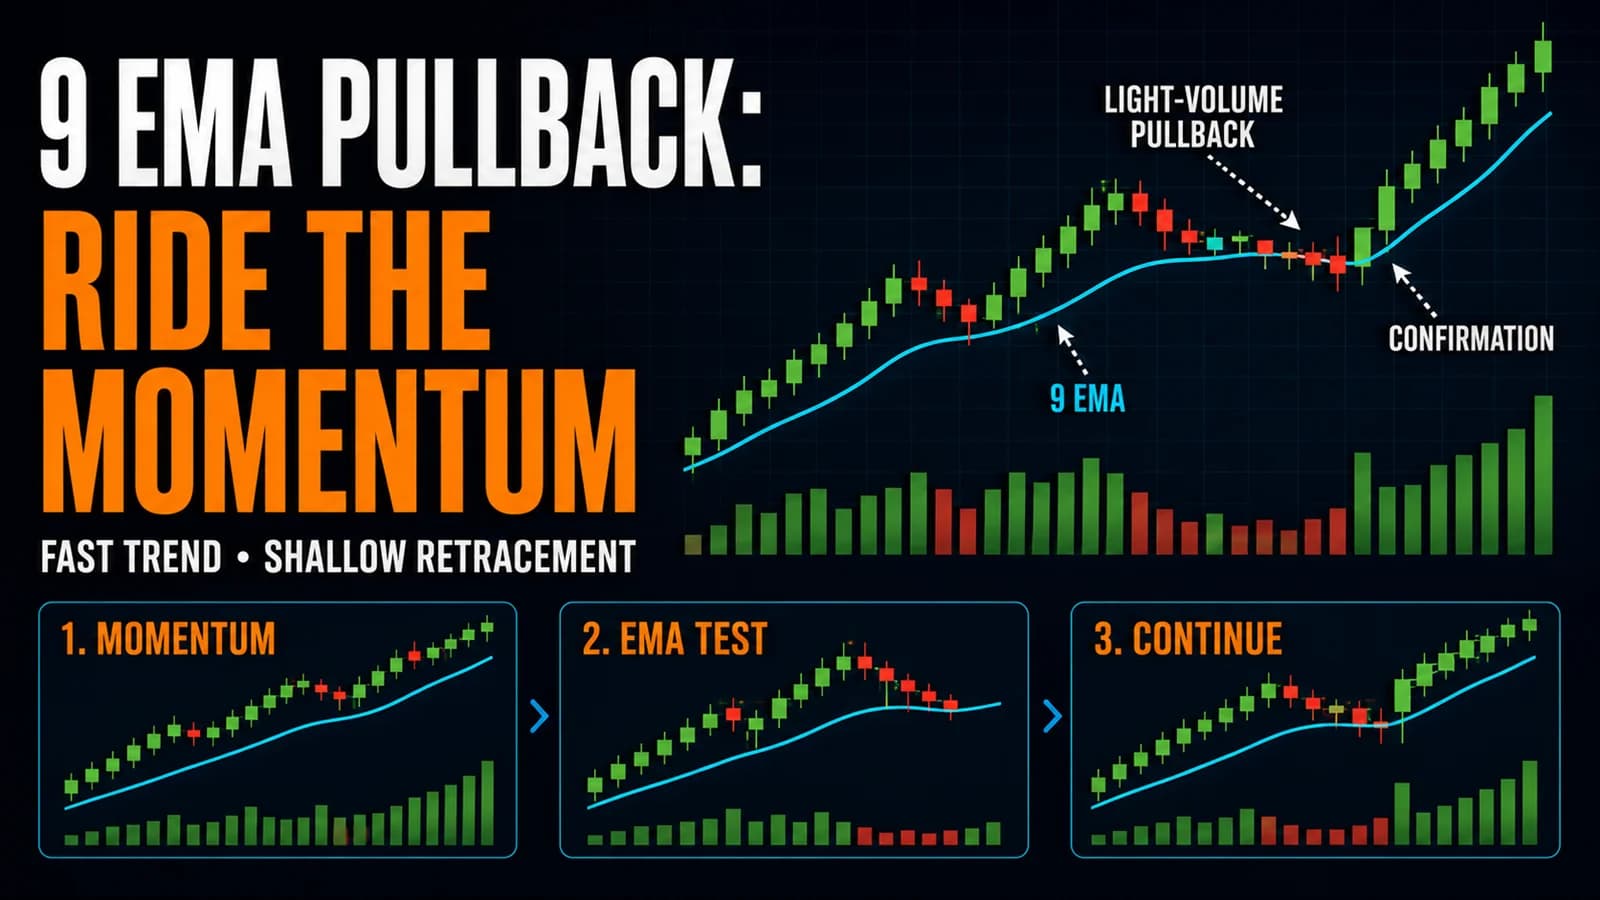
The 20 EMA occupies a specific niche between the fast, twitchy 9 EMA and slower averages like the 50 or 200 period lines. It reacts to price changes with enough lag to filter out minor noise, but responds quickly enough to remain genuinely useful within a single trading session. This makes it particularly well suited to a stock in a more measured, sustained trend rather than the sharpest, most explosive momentum runs, where the 9 EMA pullback is often the more appropriate tool.
Traders sometimes describe the difference this way: the 9 EMA suits a stock sprinting, while the 20 EMA suits a stock jogging a marathon. A trend that's been building steadily for hours, with orderly pullbacks and a clear rhythm, tends to respect the 20 EMA more reliably than a stock that's up 30% in twenty minutes on a single news catalyst, where price is moving too fast for a 20-period average to keep pace in any meaningful way.
Recognizing a Trend Mature Enough to Trade This Setup
This setup needs an established trend with some track record already in place, ideally a stock that has respected the 20 EMA on at least one or two prior pullbacks within the same session or over the preceding several sessions on a daily chart. A brand-new breakout that hasn't yet pulled back doesn't offer a 20 EMA bounce opportunity simply because there's no track record yet to confirm the average is actually being respected.
Volume behavior during the pullback matters in the same way it does for faster setups. A pullback to the 20 EMA on light, orderly volume that then reverses on a volume pickup suggests genuine buyers stepping in at a level they've defended before. A pullback that comes on heavy, accelerating volume is more concerning, since it can indicate the trend is losing steam rather than simply digesting gains.
Setup Specification
- Component
- Market Conditions Required
- Rule
- An established trend that has already respected the 20 EMA at least once previously, either intraday or on the daily chart, without closing meaningfully below it
- Component
- Time of Day
- Rule
- Works throughout the session but is most reliable outside the volatile first 15 minutes; frequently used on both 5 minute intraday charts and daily swing charts
- Component
- Stock Selection Criteria
- Rule
- Liquid names with average daily volume above 500,000 shares; works across a wide range of price points since the setup is about trend structure rather than volatility profile
- Component
- Entry Trigger
- Rule
- Price touches or slightly undercuts the 20 EMA and closes back above it (for longs) on a candle with volume exceeding the immediately preceding pullback candles
- Component
- Stop Loss
- Rule
- Below the 20 EMA by a buffer sized to the stock's average true range, or below the most recent swing low if that sits closer
- Component
- Initial Profit Target
- Rule
- The prior swing high, with a secondary target at a measured move projected from the most recent leg of the trend
- Component
- Trade Management
- Rule
- Trail beneath each new higher low as the trend continues; a decisive close back below the 20 EMA is the standard signal to tighten or exit
- Component
- Invalidation Criteria
- Rule
- A full-bodied candle closing meaningfully below the 20 EMA on volume higher than the prior average, particularly if it also breaks the last confirmed higher low
| Component | Rule |
|---|---|
| Market Conditions Required | An established trend that has already respected the 20 EMA at least once previously, either intraday or on the daily chart, without closing meaningfully below it |
| Time of Day | Works throughout the session but is most reliable outside the volatile first 15 minutes; frequently used on both 5 minute intraday charts and daily swing charts |
| Stock Selection Criteria | Liquid names with average daily volume above 500,000 shares; works across a wide range of price points since the setup is about trend structure rather than volatility profile |
| Entry Trigger | Price touches or slightly undercuts the 20 EMA and closes back above it (for longs) on a candle with volume exceeding the immediately preceding pullback candles |
| Stop Loss | Below the 20 EMA by a buffer sized to the stock's average true range, or below the most recent swing low if that sits closer |
| Initial Profit Target | The prior swing high, with a secondary target at a measured move projected from the most recent leg of the trend |
| Trade Management | Trail beneath each new higher low as the trend continues; a decisive close back below the 20 EMA is the standard signal to tighten or exit |
| Invalidation Criteria | A full-bodied candle closing meaningfully below the 20 EMA on volume higher than the prior average, particularly if it also breaks the last confirmed higher low |
A Narrated Walk-Through
Consider a mid-cap healthcare stock, call it XYZ, that has been trending steadily higher over the prior three sessions, moving from $34.00 to $39.50 with two prior pullbacks that both found support near the 20 EMA on the daily chart. On the fourth session, XYZ opens at $39.80 and drifts down through the morning to $38.60 by 11:15 AM ET, where the 20 EMA on the daily chart sits at $38.50.
At 11:30 AM, XYZ touches $38.45, briefly undercutting the average, then closes the next 5 minute candle at $38.90, back above the level, with volume roughly 1.5x the average of the pullback candles that preceded it. A trader enters at $38.90 with a stop at $38.20, below both the 20 EMA and the pullback's low. The first target sits at $39.50, the prior swing high, offering close to 1:1 reward to risk. If XYZ clears that level with continued buying, the position trails beneath each new higher low, with a secondary target near $40.70 based on a measured move from the most recent leg of the uptrend. This walk-through describes a hypothetical archetype rather than a real ticker at current prices.
Trend Continuation Management After the Bounce Confirms
Because the 20 EMA bounce is built for a more established, patient trend, position management tends to be less frantic than a fast momentum setup. Traders commonly hold through minor intraday noise as long as the 20 EMA itself keeps rising and price stays above it, only tightening the stop meaningfully once a clear warning sign appears, such as a lower high forming or the average flattening out after a long uptrend.
Scaling remains a reasonable approach here as well. Taking partial profits at the first target while trailing the remainder gives a trader exposure to a potentially longer, multi-day continuation without risking the entire position on a single measured move.
Why the 20 EMA Bounce Fails, and When to Sit It Out
The most frequent failure occurs when a trader mistakes an early, unproven trend for an established one. A stock that has only just started trending, with no prior pullback to the 20 EMA on record, hasn't demonstrated that the average is actually acting as support yet. Trading the first touch as if it were a confirmed bounce level, rather than waiting for at least one prior successful test, is a common and avoidable mistake.
A second failure mode appears when the broader trend is genuinely rolling over rather than pausing. A 20 EMA that has flattened after a long slope, combined with a pullback candle showing unusually heavy volume, often signals distribution rather than a healthy pause. Traders sometimes force a bounce trade on this kind of setup simply because it resembles prior successful patterns, without noticing that the character of the trend has changed.
A third failure mode is sector or market-wide weakness overwhelming an otherwise valid individual setup. A stock testing its 20 EMA at the same moment its entire sector is selling off sharply carries meaningfully higher risk of a deeper break than the identical pattern occurring in a calm or supportive sector backdrop.
Adapting the Setup Across Timeframes
This setup transfers cleanly between intraday and swing timeframes, unlike faster averages that lose most of their meaning outside a single session. On a daily chart, the 20 EMA bounce becomes a multi-day swing setup, often held for several sessions as the trend develops. On a 5 minute intraday chart, it functions as a same-day trend continuation tool, closer in spirit to the 9 EMA pullback but with a somewhat calmer, more established trend as the backdrop.
The short side works identically in reverse: a stock in a confirmed downtrend that has previously respected the 20 EMA as resistance offers a short entry when price rallies back up to touch it and rolls back over, with the stop placed above the pullback high.
Screening for Trends Worth Watching
Identifying stocks with an established, multi-touch relationship to their 20 EMA across a large watchlist benefits from a scanner rather than manual chart-by-chart review. A tool capable of filtering for stocks trending above a rising 20 EMA, with a defined number of prior successful tests, narrows down candidates efficiently. Trade Ideas offers customizable real-time and end-of-day scans that can be built around moving average relationships like this one, alongside its Holly AI signals that some traders use to surface trend-following candidates before manual confirmation.
Where This Setup Belongs in a Broader Plan
The 20 EMA bounce is a natural fit within a broader trend following approach, functioning as the specific, repeatable entry mechanism once a trend has already proven itself worth trading. It rewards patience over speed, and traders who resist the urge to force the setup on a fresh, unproven trend tend to see meaningfully better results than those chasing the very first pullback they see.
FAQ
How is the 20 EMA bounce different from a standard trend-line bounce?
Trend lines can be subjective, since two traders drawing lines on the same chart may connect different points and arrive at different support levels. The 20 EMA removes that subjectivity, since its value is calculated the same way every time regardless of who's looking at the chart. Many traders use both together, treating a confluence of a trend line and the 20 EMA at a similar price as a stronger signal than either alone.
Key Takeaway: The 20 EMA offers an objective, automatically calculated reference point, while trend lines depend on the trader's manual point selection.
Does the 20 EMA bounce work better on the daily chart or an intraday chart?
A daily 20 EMA carries the weight of nearly a month of trading activity, giving it a stronger institutional following and more predictive power than an intraday version built from a single session's data. Intraday 20 EMA bounces can still work well, particularly on stocks already in a strong multi-day uptrend, but traders generally treat the daily version as the higher-conviction signal.
Key Takeaway: The daily chart 20 EMA generally carries more weight than its intraday counterpart, though both can be tradeable.
What's a reasonable stop distance below the 20 EMA?
Using a volatility-based buffer accounts for the fact that a highly volatile stock needs more room below the 20 EMA to avoid getting stopped out on normal noise, while a calmer stock can use a tighter buffer without sacrificing much protection. A fixed dollar stop applied uniformly across different stocks tends to be too tight for volatile names and unnecessarily loose for calmer ones.
Key Takeaway: Size the stop as a fraction of the stock's average true range rather than using a fixed dollar amount across every trade.
How many prior touches of the 20 EMA are needed before trusting a new bounce?
A single successful test establishes that the level has been respected at least once, which is a meaningful improvement over trading a completely unproven average. Each additional successful touch adds to the case that institutional or algorithmic flow is genuinely using the level as a reference point, though very frequent touches within a short window can also signal the trend is losing strength.
Key Takeaway: Look for at least one confirmed prior touch before trusting a new 20 EMA bounce, with additional touches adding further confidence.
Can the 20 EMA bounce be combined with a 50-period average for extra confirmation?
When a faster average like the 20 EMA stays consistently above a slower one like the 50-period line, and both are sloping upward, the trend structure is generally considered more robust than a single average alone would suggest. A 50/200 crossover operates on a much longer timeframe but reflects the same underlying logic of using multiple averages together for confirmation.
Key Takeaway: Confirming the 20 EMA bounce against a slower, rising average adds another layer of trend confirmation.
Why does the 20 EMA sometimes get pierced by a large wick without the trend actually breaking?
Because the 20 EMA is a widely watched level, a cluster of stop orders can sit just below it, and a brief spike down to trigger those stops before reversing is a common market dynamic. This is part of why waiting for the candle close, rather than reacting to an intraday wick, is generally the safer approach to confirming whether a bounce has actually held.
Key Takeaway: A wick through the 20 EMA that closes back above it is often a stop run rather than a genuine trend break; wait for the close to confirm.
Is the 20 EMA bounce a good fit for swing trading rather than pure day trading?
While this hub focuses on day trading applications, the 20 EMA bounce translates directly to a swing timeframe without needing significant modification, since the underlying logic of buying an established trend's pullback to a respected average doesn't change based on how long the position is held. Traders comfortable holding overnight risk often use this exact setup as a core swing entry method.
Key Takeaway: This setup adapts well to swing trading on the daily chart without needing structural changes.
Is the 20 EMA bounce appropriate for someone new to trend trading?
The main skill this setup demands is patience: recognizing that a trend needs to prove itself with at least one successful test before a pullback qualifies as tradeable. A newer trader who has internalized that patience requirement, rather than jumping on the very first pullback they see, can reasonably start building experience with this setup earlier than with faster, more volatile momentum strategies.
Key Takeaway: This is one of the more beginner-accessible setups in the hub, provided the trader has the patience to wait for a proven trend.
Disclaimer
Article Sources
- StockCharts ChartSchool: Moving Averages, Simple and Exponential - Explains the underlying moving average calculation this setup depends on.chartschool.stockcharts.com
- StockCharts ChartSchool: Arthur Hill on Moving Average Crossovers - Context on how multiple moving averages are used together for trend confirmation.chartschool.stockcharts.com
- CFA Institute: Technical Analysis for Investment Professionals - Professional context on the use of moving averages within broader technical frameworks.cfainstitute.org
- SEC Investor.gov: Day Trading - Regulatory background on the risks associated with active, short-term trading strategies.investor.gov