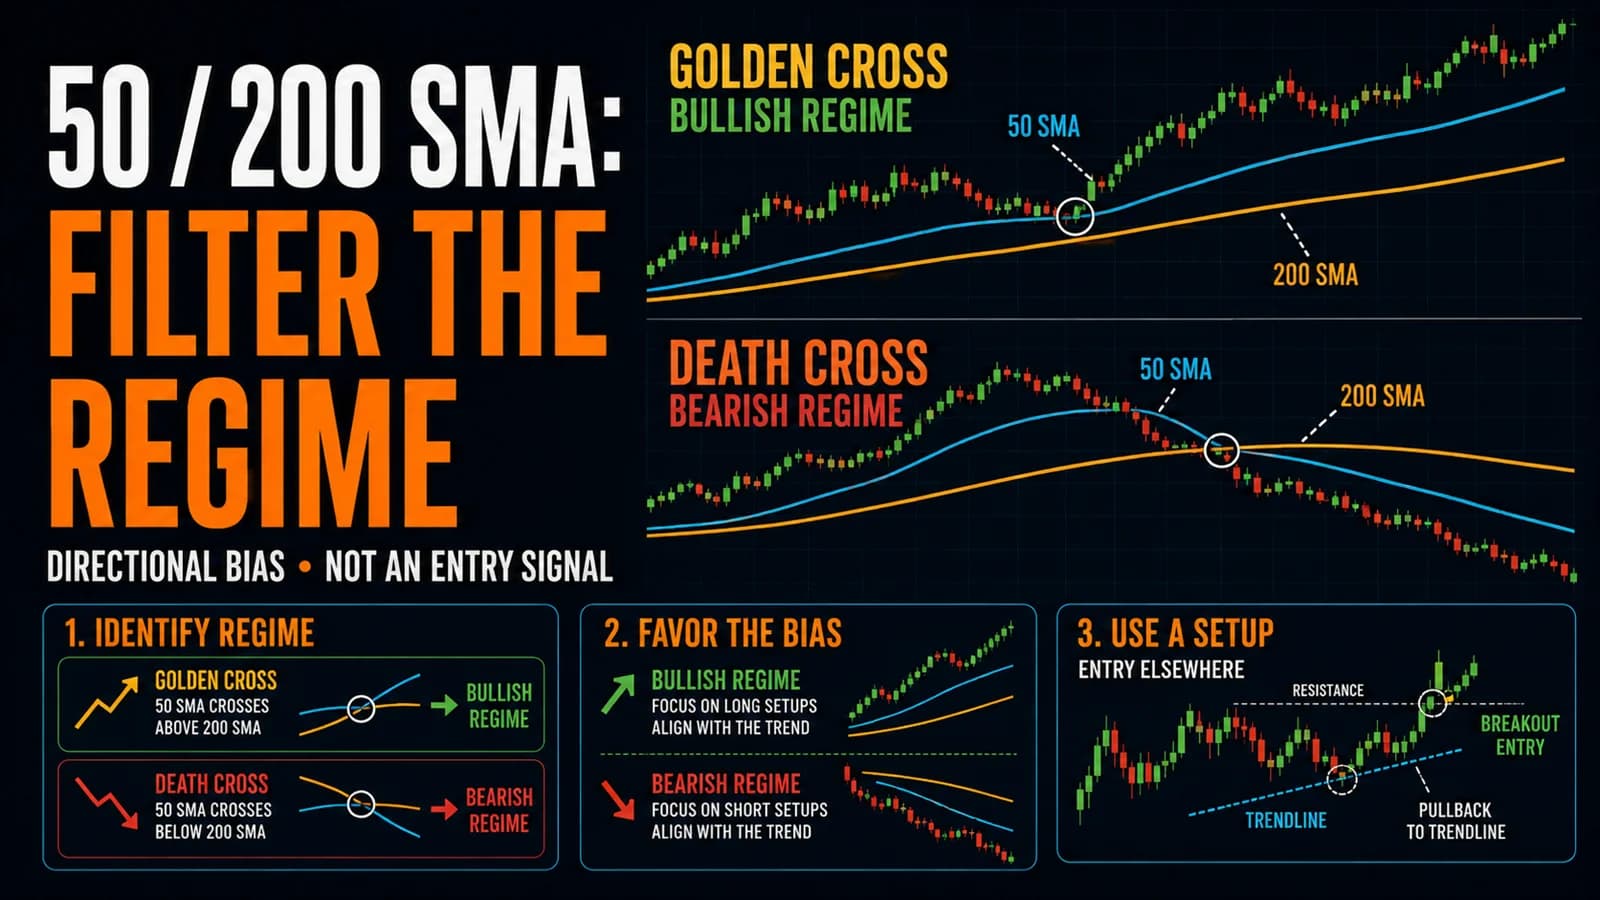
The Golden CrossA golden cross is a bullish technical signal that occurs when a shorter-term moving average (typically the 50-day SMA) crosses above a longer-term moving average (typically the 200-day SMA) — it signals a potential shift from bearish to bulRead definition → and Death CrossA bearish technical signal that occurs when a shorter-term moving average crosses below a longer-term moving average — most commonly when the 50-day moving average crosses below the 200-day moving average. It signals that intermediate-term Read definition → get more mainstream financial media coverage than almost any other technical signal, which is exactly why day traders need to understand what these crossovers actually mean, and more importantly, what they don't mean for someone holding a position for minutes or hours rather than months.
What is the 50/200 SMA crossover strategy? The 50/200 SMA crossover tracks when the 50-day simple Moving AverageA moving average smooths out price data by calculating the average closing price over a set number of periods — it filters out noise and identifies the trend direction, with the stock above the MA interpreted as bullish and below as bearishRead definition → crosses above the 200-day simple moving average (a golden cross, bullish) or below it (a death cross, bearish), using this longer-term TrendA trend is a sustained directional movement in price over time — an uptrend is characterized by a sequence of higher highs and higher lows, a downtrend by lower highs and lower lows — and correctly identifying the current trend direction isRead definition → signal as a backdrop filter for day trading decisions rather than a standalone intraday entry trigger.
Why a Signal Built for Investors Still Matters to Day Traders
The 50/200 crossover was never designed as a precision entry tool. It's a lagging, longer-term trend confirmation signal that institutional and retail investors alike have watched for decades, which means it carries genuine psychological weight across the market even for participants who never trade based on it directly. When a golden cross occurs, headlines spread, sentiment shifts, and a wave of institutional and algorithmic capital that specifically screens for this signal can flow into a stock or index, creating real, tradeable follow-through even though the cross itself already happened using stale price data.
For a day trader, the 50/200 crossover's real value isn't as an entry trigger. It's as a regime filter: a stock or index in a confirmed golden cross state has a statistically different character than one in a death cross state, and adjusting intraday tactics based on which regime is active tends to improve results more than ignoring the signal entirely. A day trader who only takes long setups on stocks above both the 50 and 200 day averages, and shorts on stocks below both, is using this crossover indirectly even without trading the cross event itself.
Reading the Crossover as a Market Regime, Not a Trade Signal
A useful mental model treats the relationship between the 50 and 200 day SMAs as a three-state system. When the 50 sits comfortably above a rising 200, the broader trend backdrop favors long setups and disfavors aggressive shorting, since buying dips generally works better than fading strength in this regime. When the 50 sits below a falling 200, the opposite applies, and short setups on rallies tend to outperform attempts to buy dips. The messiest and least useful state is when the two averages sit close together and flat, often right around the crossover point itself, where neither a bullish nor bearish regime has clearly established itself yet.
This is why chasing the crossover event itself, buying the moment a golden cross prints, tends to produce mixed results. By the time a 50/200 crossover confirms, the underlying trend has often already been in place for weeks, and the specific crossing candle is simply the moment the math finally caught up.
Setup Specification
- Component
- Market Conditions Required
- Rule
- Used primarily as a regime filter; a golden cross state favors long intraday setups, a death cross state favors short setups, with reduced conviction near the crossover point itself
- Component
- Time of Day
- Rule
- Applies throughout the session as a background filter rather than a specific intraday timing trigger
- Component
- Stock Selection Criteria
- Rule
- Works on individual liquid stocks and index/sector ETFs alike; most meaningful on names with enough trading history for both averages to be well established
- Component
- Entry Trigger
- Rule
- Not a standalone entry; used to confirm or veto intraday setups (favor long pullback entries in a golden cross regime, short setups in a death cross regime)
- Component
- Stop Loss
- Rule
- Determined by whichever intraday setup is actually being traded (a pullback, breakout, or reversal), not by the crossover itself
- Component
- Initial Profit Target
- Rule
- Determined by the specific intraday setup in play; the crossover informs directional bias rather than exit levels
- Component
- Trade Management
- Rule
- Reassess the regime periodically, particularly if the 50 and 200 day averages begin converging again after a period of separation
- Component
- Invalidation Criteria
- Rule
- The averages converging and flattening, signaling the prior regime may be weakening even before an actual re-crossover occurs
| Component | Rule |
|---|---|
| Market Conditions Required | Used primarily as a regime filter; a golden cross state favors long intraday setups, a death cross state favors short setups, with reduced conviction near the crossover point itself |
| Time of Day | Applies throughout the session as a background filter rather than a specific intraday timing trigger |
| Stock Selection Criteria | Works on individual liquid stocks and index/sector ETFs alike; most meaningful on names with enough trading history for both averages to be well established |
| Entry Trigger | Not a standalone entry; used to confirm or veto intraday setups (favor long pullback entries in a golden cross regime, short setups in a death cross regime) |
| Stop Loss | Determined by whichever intraday setup is actually being traded (a pullback, breakout, or reversal), not by the crossover itself |
| Initial Profit Target | Determined by the specific intraday setup in play; the crossover informs directional bias rather than exit levels |
| Trade Management | Reassess the regime periodically, particularly if the 50 and 200 day averages begin converging again after a period of separation |
| Invalidation Criteria | The averages converging and flattening, signaling the prior regime may be weakening even before an actual re-crossover occurs |
A Narrated Walk-Through
Consider a large-cap industrial stock, call it XYZ, where the 50-day SMA crossed above the 200-day SMA seven weeks ago, and the GapA gap is a price discontinuity on a chart where a stock opens significantly higher or lower than the previous session's close, leaving a visible empty space — gap-ups are driven by overnight buying pressure or positive news; gap-downs by seRead definition → between the two averages has been steadily widening since, with the 50-day now at $142 and the 200-day at $128. This regime tells a day trader that XYZ is in a confirmed golden cross state, favoring long setups over short ones on any given session.
On a specific trading day, XYZ pulls back intraday from $151 to $147.50 on declining volume, touching its 20 EMA on the 5 minute chart. Because the broader 50/200 regime is bullish, this pullback is treated as a higher-conviction long opportunity than the identical pattern would be on a stock currently in a death cross state. The trader enters the 20 EMA bounce at $148.10 with a stop at $147.20, using the crossover regime as background confirmation rather than the entry trigger itself. This scenario describes a hypothetical archetype rather than a real ticker at current prices.
Using the Regime to Filter, Not to Time, Individual Trades
The practical discipline this setup demands is resisting the urge to trade the crossover event directly with intraday timing precision. A far more productive use is building a simple daily checklist: before taking any long setup, confirm the stock or relevant index sits in a golden cross regime; before taking any short setup, confirm a death cross regime. This filter doesn't replace the actual intraday entry method, whether that's a pullback, a breakout, or a reversal setup, but it does meaningfully improve the odds of any of those setups working by aligning them with the dominant longer-term trend.
Some traders extend this by tracking the crossover state of a broad index like SPY or QQQ alongside the individual stock's own crossover state, only taking the highest-conviction long setups when both the stock and the broader market share the same bullish regime.
Where This Signal Misleads Traders
The most common mistake is treating the crossover event itself as an actionable, time-sensitive signal, buying aggressively the moment a golden cross prints under the assumption that a major move is about to start. Because both averages are already lagging by design, much of the preceding trend has typically already happened by the time the cross confirms, and traders who buy purely on the headline event without other confirmation often enter later in the move than they realize.
A second failure mode occurs in genuinely range-bound or choppy markets where the 50 and 200 day averages repeatedly cross back and forth over an extended period without ever establishing a clear regime. In this environment, the crossover signal essentially becomes noise, flipping direction every few weeks without any of the sustained trend behavior that makes the signal useful in the first place.
A third failure mode involves applying this regime filter too rigidly on a single stock while ignoring sector or sudden company-specific news. A stock in a technical golden cross state can still drop sharply on a surprise earnings miss or a regulatory announcement, and no long-term moving average relationship protects against that kind of event-driven move.
Adapting the Filter for Different Markets
While the classic golden cross and death cross use daily 50 and 200 period averages, some traders apply the same crossover logic on shorter timeframes for a faster-reacting regime filter, such as a 50/100 period relationship on a 4 hour chart for markets that trade around the clock, like futures or crypto. The tradeoff is a noisier, less historically validated signal in exchange for faster regime updates.
This filter also applies cleanly to sector and index ETFs, letting a trader gauge the broader regime for an entire group of stocks at once rather than checking each individual name separately, which can be a faster way to build a top-down sector rotation view before drilling into specific stocks.
Tools for Tracking Crossover Regimes Across a Watchlist
Manually checking the 50/200 relationship across dozens of individual stocks and sector ETFs is tedious without a scanner built for it. A tool that can flag which stocks in a watchlist currently sit in a golden cross versus a death cross state, and highlight names where the averages are converging and a potential regime change may be approaching, saves considerable manual chart-checking. Trade Ideas supports custom scans built around moving average relationships like this, letting traders maintain an updated regime view across a broad list without checking each chart individually.
Where This Fits a Complete Trading Plan
The 50/200 crossover works best as one layer within a broader market regime identification framework, sitting alongside other tools that help a trader decide which style of setup to favor on any given day. It's not a replacement for a real intraday entry method, but a filter that improves the odds of whichever entry method a trader ultimately chooses.
FAQ
How is the golden cross different from a death cross in practical trading terms?
Both signals reflect the same underlying mechanic, simply in opposite directions. A golden cross suggests recent price action has been strong enough to lift the shorter average above the longer one, while a death cross reflects sustained weakness pulling the shorter average below. Day traders typically use whichever cross is currently active as a directional bias filter for intraday setups rather than trading the cross event itself.
Key Takeaway: A golden cross favors a bullish intraday bias, a death cross favors a bearish one, and both function as filters rather than standalone triggers.
Is the 50/200 crossover too slow to matter for day trading?
The crossover itself confirms a trend that's typically already been developing for weeks, which makes it a poor tool for timing a specific day's entry. Its value for day traders comes from using the broader regime it represents (bullish or bearish) to decide which style of intraday setup, long or short, deserves more weight on any given session.
Key Takeaway: The crossover is too slow for entry timing but useful as a directional filter for intraday decision-making.
What happens when the 50 and 200 day averages sit very close together?
When the two averages sit close together with little separation, neither a clean golden cross nor death cross regime has firmly taken hold, and the market may be in transition. During this period, other tools such as shorter-term trend structure or sector strength tend to carry more weight than the 50/200 relationship itself.
Key Takeaway: Treat a flat, converging 50/200 relationship as low-conviction and lean on other signals until a clearer regime emerges.
Does the golden cross work the same way on individual stocks as it does on major indices?
An individual stock can experience a golden cross driven by a single strong earnings quarter, only to reverse a few months later on a subsequent disappointment, producing more crossover noise than a broad index typically shows. Traders generally place somewhat more weight on index-level crossovers as a market-wide regime signal, while treating individual stock crossovers as one input among several.
Key Takeaway: Index-level golden crosses tend to be more statistically reliable than individual stock crossovers, which can whipsaw more easily.
Can the 50/200 crossover be used to decide position sizing, not just direction?
A well-established regime, where the gap between the 50 and 200 day averages has been widening steadily for weeks, generally reflects more conviction than a crossover that just occurred within the past few sessions. Adjusting size based on how mature and confirmed the regime appears is a reasonable extension of using the crossover as a filter rather than a binary signal.
Key Takeaway: A more mature, widening crossover can justify larger size than a fresh or uncertain one.
How often do golden crosses and death crosses actually occur?
Because both averages are relatively slow-moving, it takes a sustained shift in trend for one to cross the other, which is part of why the signal is treated as significant when it does occur on a broad index. Individual, more volatile stocks can experience these crossovers with greater frequency, which is part of why index-level crossovers generally carry more weight than single-stock versions.
Key Takeaway: Crossovers on major indices are relatively rare events, while individual stocks can cross more frequently due to higher volatility.
Should a day trader ignore the 50/200 crossover entirely if they only hold positions for minutes?
A scalping-focused trader isn't going to check the 50/200 relationship before every single trade, but maintaining general awareness of whether the stocks on a watchlist are currently in bullish or bearish long-term regimes still shapes which setups deserve more attention on any given day. Ignoring the regime entirely means missing a genuinely useful piece of context, even for very short holding periods.
Key Takeaway: Even scalpers benefit from tracking the broader crossover regime, even though it doesn't directly time individual entries.
Is this strategy beginner-friendly?
Because this signal functions as a background filter rather than requiring split-second intraday judgment, it's genuinely approachable for newer traders who are still building comfort with faster, more reactive setups. Understanding the crossover concept early helps frame a trader's broader market view even before they've developed the skill to trade faster intraday patterns.
Key Takeaway: This is one of the more accessible concepts in the hub, useful for building broader market context early in a trader's development.
Disclaimer
Article Sources
- StockCharts ChartSchool: Moving Averages, Simple and Exponential - Explains the calculation methodology behind simple moving averages used in this crossover.chartschool.stockcharts.com
- StockCharts ChartSchool: Arthur Hill on Moving Average Crossovers - Background on how crossover signals are traditionally interpreted.chartschool.stockcharts.com
- CFA Institute: Technical Analysis for Investment Professionals - Professional context on long-term trend confirmation tools within technical analysis.cfainstitute.org
- SEC Investor.gov: Day Trading - Regulatory background on the risks of active trading strategies.investor.gov