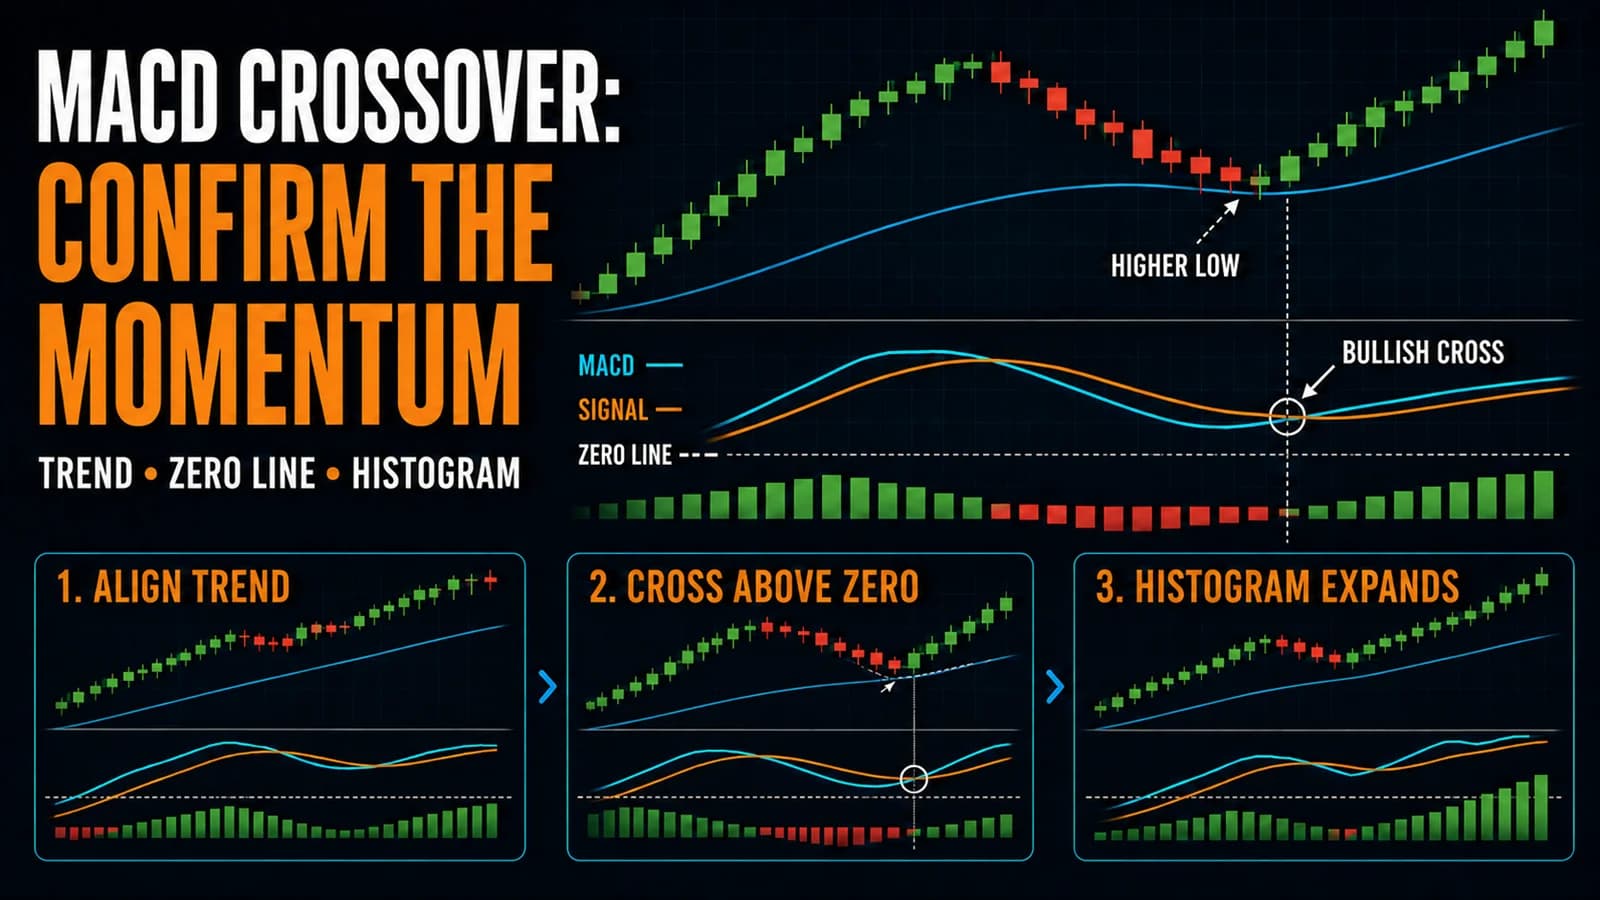
Few indicators generate as much day-to-day chart commentary as the MACDMACD (Moving Average Convergence Divergence) is a momentum and trend-following indicator that measures the relationship between two exponential moving averages — typically the 12 and 26 EMA — and plots the difference (MACD line) alongside aRead definition →, and few are as frequently misused. Most of that misuse comes from treating every line cross as a trade signal, when the indicator's actual value lies in what those crosses reveal about shifting momentum, not in blindly buying or selling the instant two lines touch.
What is the MACD crossover strategy? The MACD crossover strategy uses the Moving AverageA moving average smooths out price data by calculating the average closing price over a set number of periods — it filters out noise and identifies the trend direction, with the stock above the MA interpreted as bullish and below as bearishRead definition → Convergence Divergence indicator's signal line cross, when the MACD line crosses above its signal line (bullish) or below it (bearish), to time entries that align with a shift in short-term momentum, generally in the direction of an already-established broader TrendA trend is a sustained directional movement in price over time — an uptrend is characterized by a sequence of higher highs and higher lows, a downtrend by lower highs and lower lows — and correctly identifying the current trend direction isRead definition →.
What MACD Actually Measures
MACD is built from two exponential moving averages, typically a 12-period and a 26-period EMA, with the difference between them plotted as the MACD line. A third EMA, usually 9-period, smooths that line into the signal line. Developed by Gerald Appel, MACD is fundamentally a momentum oscillator built on the relationship between two moving averages of different speeds, which means a MACD crossover is really just a moving average crossover happening one derivative removed from the price chart itself.
This matters because it explains both the indicator's usefulness and its limitations. When the faster 12-period EMA gains momentum relative to the slower 26-period EMA, the MACD line rises, and a cross above the signal line reflects that momentum accelerating in a measurable way. But because it's built from lagging moving averages, MACD crosses inherently confirm a shift that price action has often already begun to show directly, which is why day traders typically use MACD crossovers as confirmation for a setup rather than as the sole trigger.
Reading the Histogram Alongside the Crossover
The MACD histogram, the bar chart showing the distance between the MACD line and the signal line, often provides earlier and more useful information than the crossover itself. A shrinking histogram on the bullish side, even before an actual bearish crossover occurs, can warn that upward momentum is fading well ahead of the lagging crossover signal catching up. Traders who watch the histogram's slope, not just whether the lines have crossed, frequently spot momentum shifts a candle or two earlier than a crossover-only approach would.
The position of the crossover relative to the zero line also carries meaning. A bullish crossover that occurs above the zero line, where the MACD line is already positive, suggests the move is happening within an existing uptrend and tends to be a higher-quality signal than the same crossover occurring well below zero, which can simply reflect a bounce within an ongoing downtrend rather than a genuine reversal.
Setup Specification
- Component
- Market Conditions Required
- Rule
- Works best when aligned with a broader trend already visible on a higher timeframe; crossovers taken against the dominant trend carry meaningfully more risk
- Component
- Time of Day
- Rule
- Applies throughout the session; on a 5 minute chart, most reliable after the first 15 to 20 minutes once initial volatility settles
- Component
- Stock Selection Criteria
- Rule
- Liquid stocks with average daily volume above 500,000 shares; MACD settings (12, 26, 9) are standard, though faster settings are sometimes used on lower timeframes
- Component
- Entry Trigger
- Rule
- MACD line crosses above the signal line (for longs), ideally above the zero line, with price also showing a corresponding higher low on the chart
- Component
- Stop Loss
- Rule
- Below the most recent swing low that formed alongside the bullish crossover
- Component
- Initial Profit Target
- Rule
- The prior swing high, or a measured move based on the size of the most recent trend leg
- Component
- Trade Management
- Rule
- Exit or tighten when the histogram begins visibly shrinking even before an actual bearish crossover confirms
- Component
- Invalidation Criteria
- Rule
- A bearish crossover occurring shortly after entry, or a crossover happening well below the zero line, suggesting weak underlying momentum
| Component | Rule |
|---|---|
| Market Conditions Required | Works best when aligned with a broader trend already visible on a higher timeframe; crossovers taken against the dominant trend carry meaningfully more risk |
| Time of Day | Applies throughout the session; on a 5 minute chart, most reliable after the first 15 to 20 minutes once initial volatility settles |
| Stock Selection Criteria | Liquid stocks with average daily volume above 500,000 shares; MACD settings (12, 26, 9) are standard, though faster settings are sometimes used on lower timeframes |
| Entry Trigger | MACD line crosses above the signal line (for longs), ideally above the zero line, with price also showing a corresponding higher low on the chart |
| Stop Loss | Below the most recent swing low that formed alongside the bullish crossover |
| Initial Profit Target | The prior swing high, or a measured move based on the size of the most recent trend leg |
| Trade Management | Exit or tighten when the histogram begins visibly shrinking even before an actual bearish crossover confirms |
| Invalidation Criteria | A bearish crossover occurring shortly after entry, or a crossover happening well below the zero line, suggesting weak underlying momentum |
A Narrated Walk-Through
Consider a mid-cap consumer stock, call it XYZ, in a steady uptrend on the 5 minute chart, having moved from $28.00 to $31.50 over the prior two hours. Around 11:40 AM ET, XYZ pulls back to $30.20, and the MACD line, which had crossed below its signal line during the PullbackA pullback is a temporary counter-trend price movement within an established trend — in an uptrend, a pullback is a short-term decline that offers a lower-risk entry point before the trend resumes, as opposed to a reversal which signals theRead definition →, begins converging back toward it as the histogram bars shrink toward zero.
At 12:05 PM, the MACD line crosses back above its signal line while still sitting above the zero line, coinciding with price forming a Higher LowA higher low is a swing low that is above the previous swing low — paired with higher highs, it's the second component that confirms an uptrend in market structure, showing that buyers are defending progressively higher price levels and thaRead definition → at $30.35 and pushing to $30.80. A trader enters at $30.80 with a stop at $30.10, just below the pullback low. The first target sits at $31.50, the prior swing high, and the position is managed by watching whether the histogram continues expanding on the bullish side or begins contracting again, which would signal fading momentum well before an actual bearish crossover confirms. This walk-through describes a hypothetical archetype rather than a real ticker at current prices.
Managing a MACD-Confirmed Trade
Because MACD is a lagging confirmation tool layered on top of price action, trade management benefits from watching the histogram's behavior continuously rather than waiting for the next crossover to signal an exit. A position entered on a bullish crossover that sees the histogram peak and then steadily shrink, even while the MACD line technically remains above the signal line, is showing early signs of fading momentum that a trader can act on before the lagging crossover itself flips.
Combining MACD with a visible price structure, such as trailing behind higher lows on the chart itself, tends to produce cleaner exits than relying purely on the indicator in isolation, since price structure often shifts before the indicator confirms it.
Where MACD Crossovers Fail
The most common failure mode is trading MACD crossovers in a genuinely choppy, range-bound market, where the MACD line whipsaws above and below the signal line repeatedly without any of the crosses reflecting a real, sustained momentum shift. This is a well-documented limitation of momentum oscillators generally: they perform best in trending conditions and produce the most false signals in sideways markets.
A second failure mode involves trading crossovers that occur well below the zero line during a downtrend, mistaking them for reversal signals when they more often represent a temporary bounce within a still-intact downtrend. Traders sometimes buy these bearish-zone crossovers expecting a full reversal, only to see the stock resume its decline once the bounce exhausts itself.
A third failure mode is ignoring divergence between MACD and price. If a stock makes a new high while the MACD line fails to make a correspondingly higher high, that divergence often precedes a bearish crossover and can serve as an early warning, but traders focused solely on the crossover event itself frequently miss this signal until well after the reversal has already begun. The dedicated MACD divergence strategy covers this pattern in more depth.
Adjusting MACD Settings for Faster Intraday Use
The standard 12, 26, 9 settings were designed originally for daily charts, and some day traders adjust to faster settings, such as 5, 13, 6, on intraday timeframes to reduce lag, accepting more noise in exchange for quicker signals. There's no universally correct setting; the tradeoff between responsiveness and reliability is a matter of testing what suits a given trader's preferred timeframe and holding period, documented across years of technical analysis literature rather than settled by any single formula.
Some traders also use the MACD histogram alone, watching for the bars to cross the zero line as an even earlier signal than the slower line-versus-signal crossover, accepting a corresponding increase in false signals in exchange for speed.
Screening for Fresh MACD Crossovers
Manually checking MACD status across a large watchlist in real time isn't practical without a scanning tool built for it. A scanner capable of flagging stocks where a bullish MACD crossover has just occurred, layered with additional filters like RVOL and price above key moving averages, narrows a broad universe down to genuinely relevant candidates. Trade Ideas supports custom scans that can incorporate MACD crossover conditions alongside other technical filters, helping traders find fresh signals without manually scrolling through charts.
Where MACD Belongs in a Broader Trading Plan
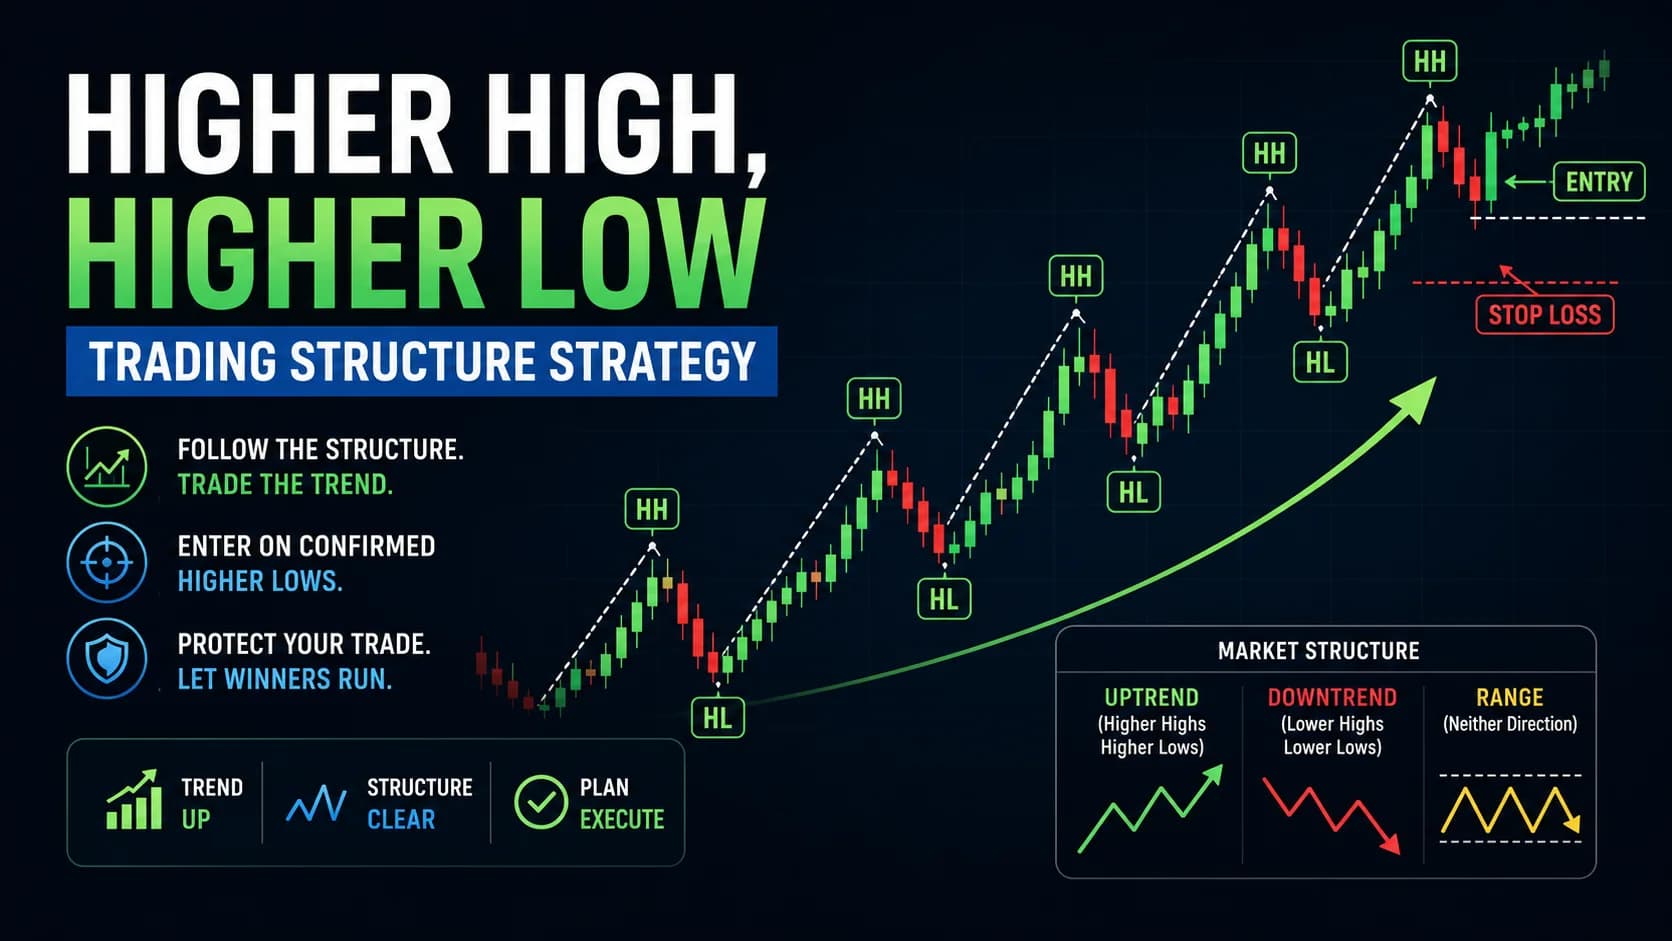
MACD crossovers work best as a confirmation layer within a broader trend-following or pullback strategy rather than as a standalone system traded in isolation. Pairing MACD confirmation with clear price structure, such as the higher high, higher low framework, tends to produce a more robust approach than relying on the indicator alone.
FAQ
How is a MACD crossover different from a moving average crossover on the price chart itself?
MACD adds a layer of calculation on top of standard moving averages, converting the relationship between a fast and slow EMA into its own separate line that then gets smoothed again into a signal line. This extra processing can make MACD crossovers occur at slightly different times than a comparable moving average crossover directly on price, and traders sometimes use both together for additional confirmation.
Key Takeaway: MACD crossovers are a derivative signal built from EMA relationships, distinct from and sometimes complementary to a direct price-based moving average crossover.
What does it mean when MACD crosses above the signal line but stays below the zero line?
The zero line represents the point where the fast and slow EMAs are equal. A crossover happening below zero means the fast EMA is still below the slow EMA overall, even though short-term momentum has just turned up slightly. This context matters, since a below-zero crossover often resolves as a temporary bounce rather than the start of a sustained new uptrend.
Key Takeaway: A below-zero crossover is generally a weaker signal, more consistent with a bounce than a genuine trend reversal.
Why does MACD sometimes fail to catch fast-moving momentum stocks?
Momentum stocks that move rapidly in the first few minutes after a catalyst can outrun MACD's ability to confirm the shift in real time. Traders working these very fast setups often rely more heavily on price action and volume, using MACD as secondary confirmation rather than the primary trigger for the initial entry.
Key Takeaway: MACD's inherent lag makes it a weaker primary tool for the fastest-moving momentum stocks; price and volume typically lead there.
What's the difference between MACD divergence and a MACD crossover?
Divergence occurs when price makes a new high or low that MACD doesn't confirm with a correspondingly extreme reading, often signaling weakening momentum ahead of an eventual crossover. The two concepts work together: divergence can serve as an early warning, while the crossover itself often serves as the later, more mechanical confirmation of the same underlying shift.
Key Takeaway: Divergence often precedes a crossover as an earlier warning sign of the same momentum shift.
Should MACD crossovers be traded against the prevailing trend?
A bullish crossover occurring within a broader downtrend is fighting against the dominant flow of the market, and while it can occasionally mark a genuine reversal, it fails more often than a crossover that simply confirms an existing uptrend's continuation. Most traders reserve counter-trend MACD signals for more advanced reversal-specific setups rather than a default approach.
Key Takeaway: Favor MACD crossovers that align with the existing higher timeframe trend over counter-trend signals.
Can MACD settings be adjusted for day trading, or should the standard 12, 26, 9 always be used?
There's no single correct answer here, since the tradeoff between speed and reliability depends on a trader's specific timeframe and risk tolerance. Traders who adjust settings typically do so gradually and test the change across many sessions before adopting it permanently, rather than switching settings on a whim mid-session.
Key Takeaway: Standard settings are a reasonable default; faster settings can suit intraday trading but should be tested deliberately, not adopted impulsively.
How often does MACD produce false signals in choppy markets?
This is a structural limitation of the indicator rather than a flaw specific to any particular setting. Traders generally reduce reliance on MACD crossovers, or skip trading them altogether, when the broader market or individual stock is clearly range-bound rather than trending.
Key Takeaway: Expect meaningfully more false MACD signals during choppy, range-bound conditions than during genuine trends.
Is the MACD crossover strategy suitable for a beginner?
The core mechanic, watching two lines cross, is visually simple to grasp. The harder skill is learning to filter out low-quality crossovers in choppy markets and to weigh the crossover's position relative to the zero line, which typically takes more screen time to internalize than the basic concept itself.
Key Takeaway: The concept is beginner-accessible, but filtering for high-quality crossovers takes additional practice beyond the basic definition.
Disclaimer
Article Sources
- StockCharts ChartSchool: Introduction to Technical Indicators and Oscillators - Background on momentum oscillators and their general interpretation, including centerline crossovers.chartschool.stockcharts.com
- StockCharts ChartSchool: Technical Indicators & Overlays - Reference index covering MACD alongside related momentum tools.chartschool.stockcharts.com
- CFA Institute: Technical Analysis for Investment Professionals - Professional context on momentum indicators within broader technical analysis frameworks.cfainstitute.org
- FINRA: Day Trading Risk Disclosure - Regulatory guidance on the risks inherent in short-term, indicator-driven trading.finra.org