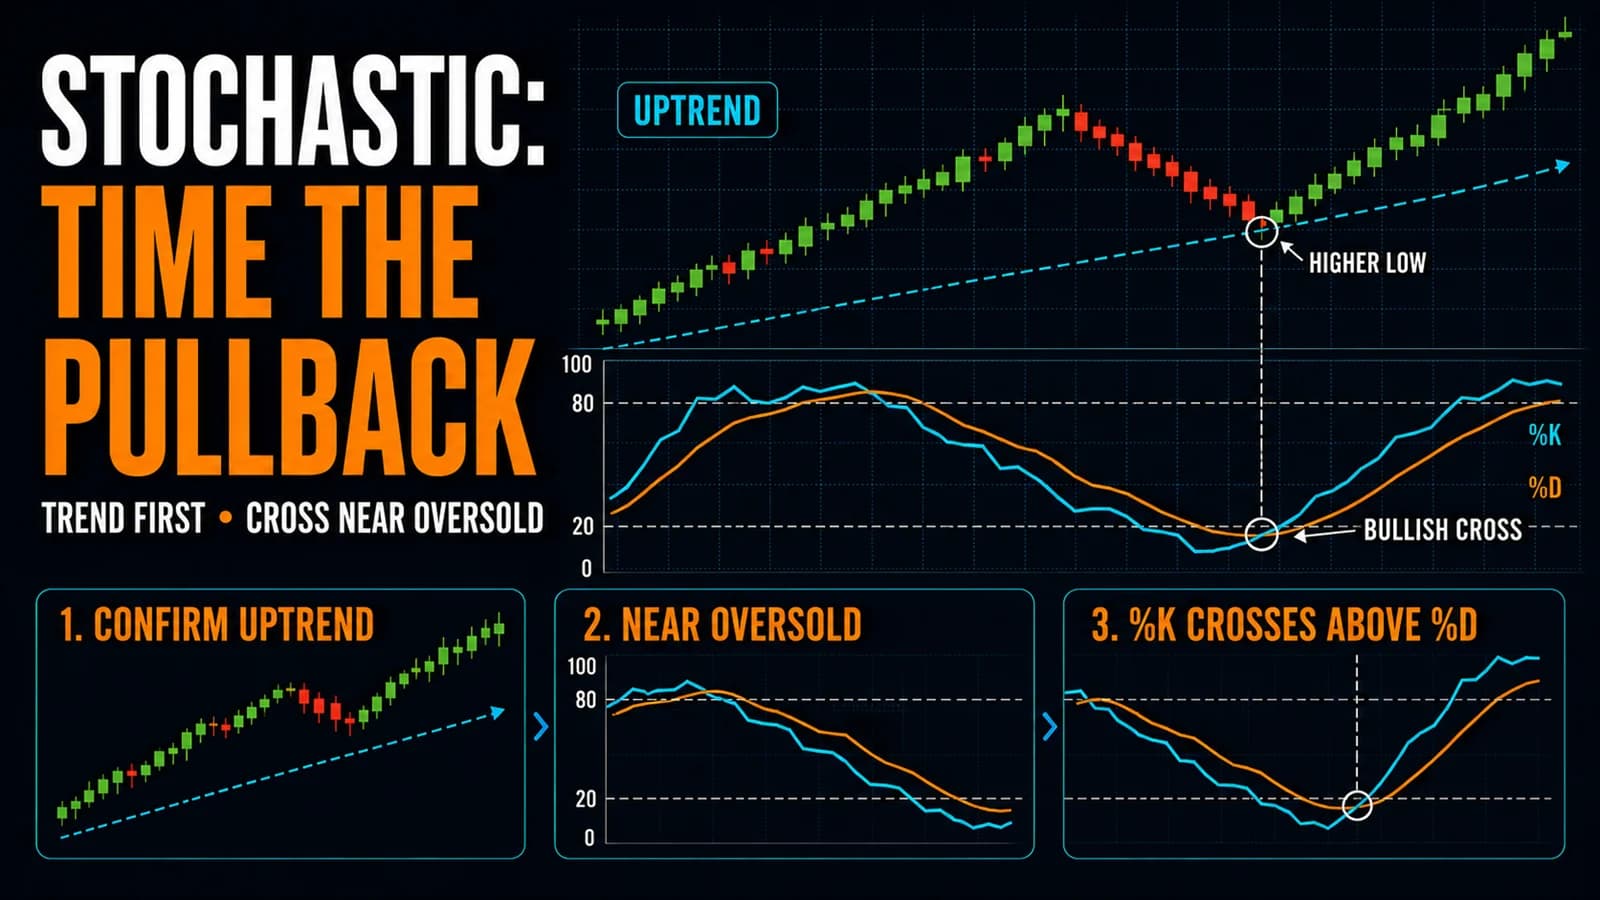
Two lines crossing inside a bounded 0 to 100 RangeA range (or trading range) is a price zone where a stock oscillates between a defined support floor and resistance ceiling without making meaningful new highs or lows — price is consolidating rather than trending, and the dominant trade is Read definition → doesn't look like much on a chart, but the stochastic oscillator packs a genuinely different piece of information than RSI or MACDMACD (Moving Average Convergence Divergence) is a momentum and trend-following indicator that measures the relationship between two exponential moving averages — typically the 12 and 26 EMA — and plots the difference (MACD line) alongside aRead definition →, even though all three get grouped together as momentum tools. Where RSI compares average gains to average losses, stochastics compares the current close to the recent trading range, a subtly different question that produces a faster, more sensitive signal.
What is the stochastic oscillator strategy? The stochastic oscillator strategy uses the %K and %D lines, which measure a stock's closing price relative to its high-low range over a set lookback period, to identify OverboughtA technical condition where an asset has risen so far, so fast that momentum indicators suggest the move may be extended and due for a pullback or consolidation. Most commonly defined as RSI above 70.Read definition → and OversoldA technical condition where an asset has declined so far, so fast that momentum indicators suggest the selling may be exhausted and a bounce or reversal is possible. Most commonly defined as RSI below 30.Read definition → conditions and time entries around %K/%D crossovers, typically within an already-established TrendA trend is a sustained directional movement in price over time — an uptrend is characterized by a sequence of higher highs and higher lows, a downtrend by lower highs and lower lows — and correctly identifying the current trend direction isRead definition → rather than as a standalone counter-trend signal.
What Stochastics Actually Measures
The stochastic oscillator compares where a stock closed relative to its full trading range over a chosen period, commonly 14 periods, expressed on a 0 to 100 scale. A reading near 100 means the stock closed near the top of its recent range, while a reading near 0 means it closed near the bottom. The %K line is the raw calculation, and %D is typically a 3-period simple moving average of %K, smoothing it slightly for a cleaner signal line.
This calculation makes stochastics more sensitive to recent price action than RSI, since it's comparing the close directly to the range rather than smoothing gains and losses over time. That sensitivity is a double-edged trait: it reacts faster to genuine momentum shifts, but it also generates more crossovers and false signals in choppy conditions than a comparatively smoother indicator like RSI.
Fast, Slow, and Full Stochastics
Traders encounter three common variations. Fast stochastics is the raw, most sensitive version, reacting quickly but producing the most noise. Slow stochastics applies an additional smoothing step, trading some responsiveness for fewer false signals. Full stochastics allows a trader to customize the smoothing period directly, offering a middle ground that can be tuned to a specific trading style. Most day traders default to slow or full stochastics for intraday work, since fast stochastics tends to whipsaw too frequently to be practically tradeable on shorter timeframes.
The standard overbought and oversold thresholds sit at 80 and 20, tighter than RSI's 70 and 30, reflecting stochastics' faster, more range-sensitive nature. A reading above 80 suggests the stock is closing consistently near the top of its recent range, and below 20 suggests the opposite.
Setup Specification
- Component
- Market Conditions Required
- Rule
- Works best within an established trend, using pullbacks into oversold territory (in an uptrend) or rallies into overbought territory (in a downtrend) as continuation entries rather than blind reversal signals
- Component
- Time of Day
- Rule
- Applies throughout the session; slow or full stochastics settings are generally preferred over fast stochastics for intraday reliability
- Component
- Stock Selection Criteria
- Rule
- Liquid stocks with a clearly defined trend; works across most price ranges
- Component
- Entry Trigger
- Rule
- %K crosses above %D from below the 20 level (for longs) while the stock remains in an established uptrend, or the mirror image for shorts
- Component
- Stop Loss
- Rule
- Below the most recent swing low that formed alongside the oversold crossover
- Component
- Initial Profit Target
- Rule
- The prior swing high, or a measured move from the most recent trend leg
- Component
- Trade Management
- Rule
- Trail beneath higher lows as the trend continues; treat a subsequent overbought crossover with more caution rather than an automatic exit signal
- Component
- Invalidation Criteria
- Rule
- Price breaking the most recent swing low shortly after entry, or the stock's broader trend structure shifting from trending to range-bound
| Component | Rule |
|---|---|
| Market Conditions Required | Works best within an established trend, using pullbacks into oversold territory (in an uptrend) or rallies into overbought territory (in a downtrend) as continuation entries rather than blind reversal signals |
| Time of Day | Applies throughout the session; slow or full stochastics settings are generally preferred over fast stochastics for intraday reliability |
| Stock Selection Criteria | Liquid stocks with a clearly defined trend; works across most price ranges |
| Entry Trigger | %K crosses above %D from below the 20 level (for longs) while the stock remains in an established uptrend, or the mirror image for shorts |
| Stop Loss | Below the most recent swing low that formed alongside the oversold crossover |
| Initial Profit Target | The prior swing high, or a measured move from the most recent trend leg |
| Trade Management | Trail beneath higher lows as the trend continues; treat a subsequent overbought crossover with more caution rather than an automatic exit signal |
| Invalidation Criteria | Price breaking the most recent swing low shortly after entry, or the stock's broader trend structure shifting from trending to range-bound |
A Narrated Walk-Through
Consider a mid-cap energy stock, call it XYZ, in a steady uptrend on the 5 minute chart, moving from $54 to $58 over the prior ninety minutes. Around 11:20 AM ET, XYZ pulls back to $56.40, and slow stochastics drops to 16, into oversold territory, as %K crosses below %D during the decline.
At 11:35 AM, %K crosses back above %D at a reading of 24, still near the oversold zone, while price simultaneously forms a higher low at $56.30 and begins pushing back toward $57. A trader enters at $57.00 with a stop at $56.10, just below the pullback low. The first target sits at $58.00, the prior swing high, with the position trailing behind subsequent higher lows if the trend continues. This walk-through describes a hypothetical archetype rather than a real ticker at current prices.
Using Stochastics as a Continuation Tool, Not Just a Reversal Signal
The most common mistake with stochastics is treating every overbought or oversold reading as an automatic reversal signal, buying the moment %K dips below 20 regardless of the broader trend context. In a strong uptrend, a stock can dip into oversold territory on stochastics repeatedly during shallow pullbacks without the trend ever actually reversing, and each of those oversold readings functions as a continuation buying opportunity rather than a signal to short.
The more reliable application treats stochastics readings within the context of the dominant trend: oversold crossovers in an uptrend are continuation buy signals, while overbought crossovers in a downtrend are continuation short signals. Fading strength in an uptrend purely because stochastics reads overbought, without other confirmation, tends to fight the trend rather than trade with it.
Where This Setup Fails
The most damaging failure mode is exactly the counter-trend mistake described above: shorting an uptrending stock the moment stochastics reads overbought, without recognizing that a strong trend can sustain an overbought reading for an extended stretch. Stochastics, like RSI, can remain pinned near its extreme for many candles in a row during a genuinely powerful move.
A second failure mode appears in choppy, range-bound markets, where stochastics generates frequent crossovers with little predictive value, since there's no dominant trend for the readings to meaningfully confirm or continue. This is a shared limitation across momentum oscillators generally, and stochastics' faster, more sensitive nature makes it particularly prone to whipsawing in sideways conditions.
A third failure mode involves using fast stochastics on a very short intraday timeframe without adjusting for the added noise, generating far more signals than a trader can realistically act on with any consistency. Switching to slow or full stochastics settings, or working on a slightly higher timeframe, typically resolves this issue.
Combining Stochastics With Other Tools
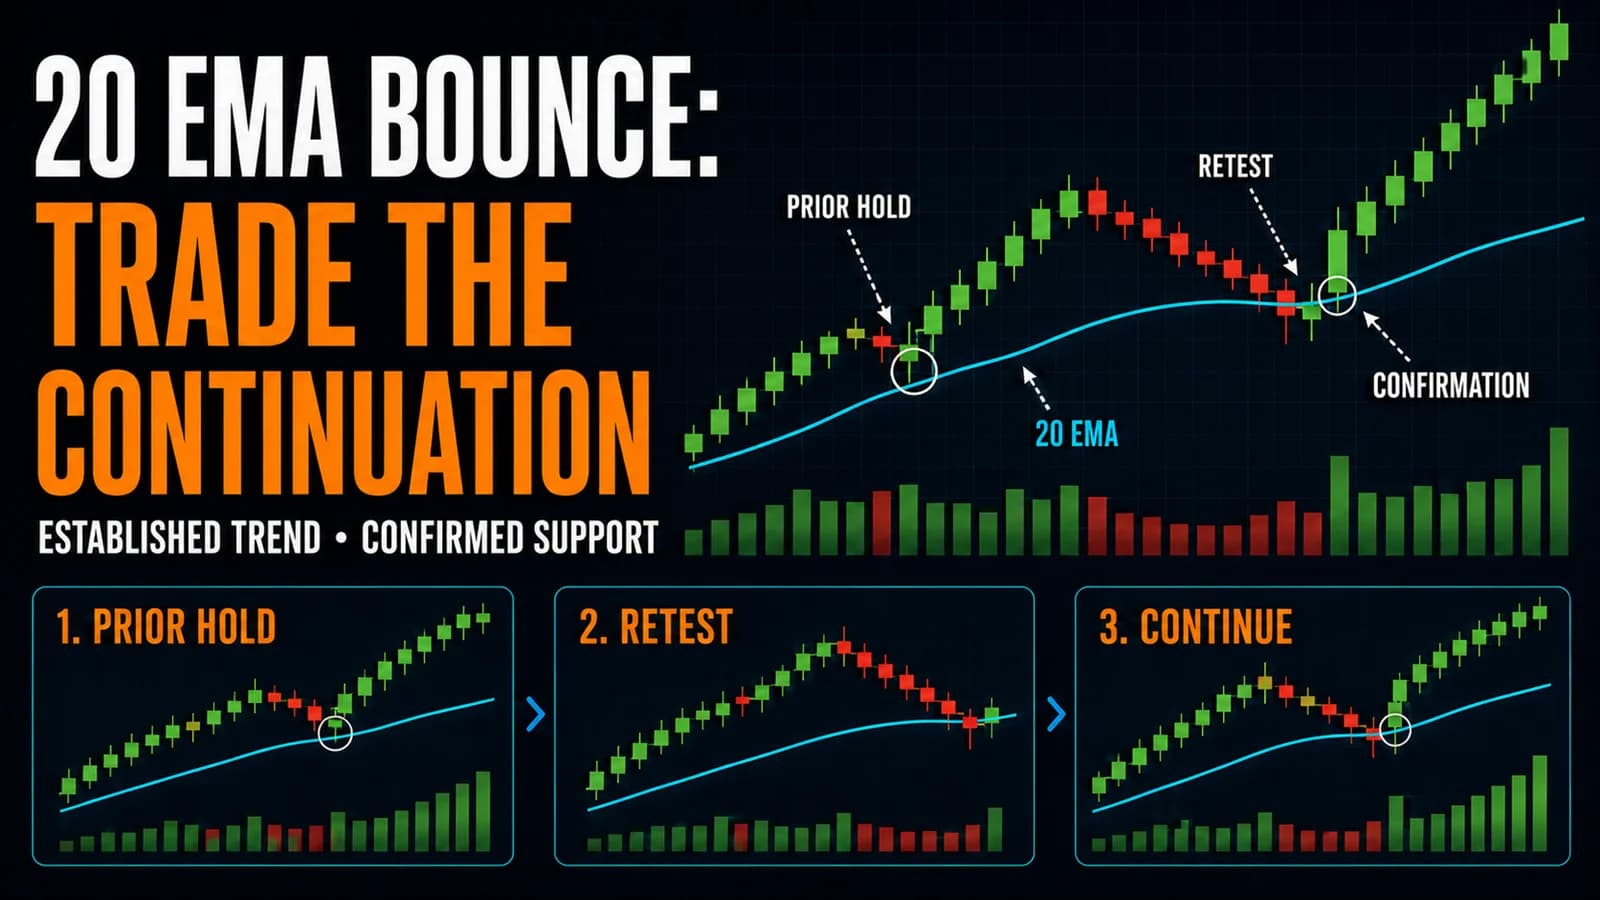
Stochastics pairs naturally with a trend filter, such as confirming a stock sits above a rising 20 EMA before treating an oversold stochastic crossover as a continuation buy signal. Some traders also combine stochastics with StochRSI, a further derivative that applies the stochastic formula to RSI readings rather than raw price, producing an even more sensitive (and noisier) signal that some scalpers prefer for very fast timeframes.
Divergence, comparing stochastics' peaks and troughs to price in the same way traders analyze RSI divergence, can also be applied to stochastics, though the indicator's faster, choppier nature makes divergence patterns somewhat less reliable here than on a smoother oscillator.
Scanning for Stochastic-Based Setups
Building a manual watchlist of stocks currently trending with a fresh stochastic crossover requires checking many charts individually, which isn't practical at scale. A scanner capable of filtering for stocks in a defined trend with stochastics recently crossing out of oversold or overbought territory narrows the search considerably. Trade Ideas supports customizable technical scans that can incorporate stochastic conditions alongside trend and volume filters, helping traders build a focused shortlist rather than manually reviewing charts one at a time.
Where This Fits a Broader Trading Plan
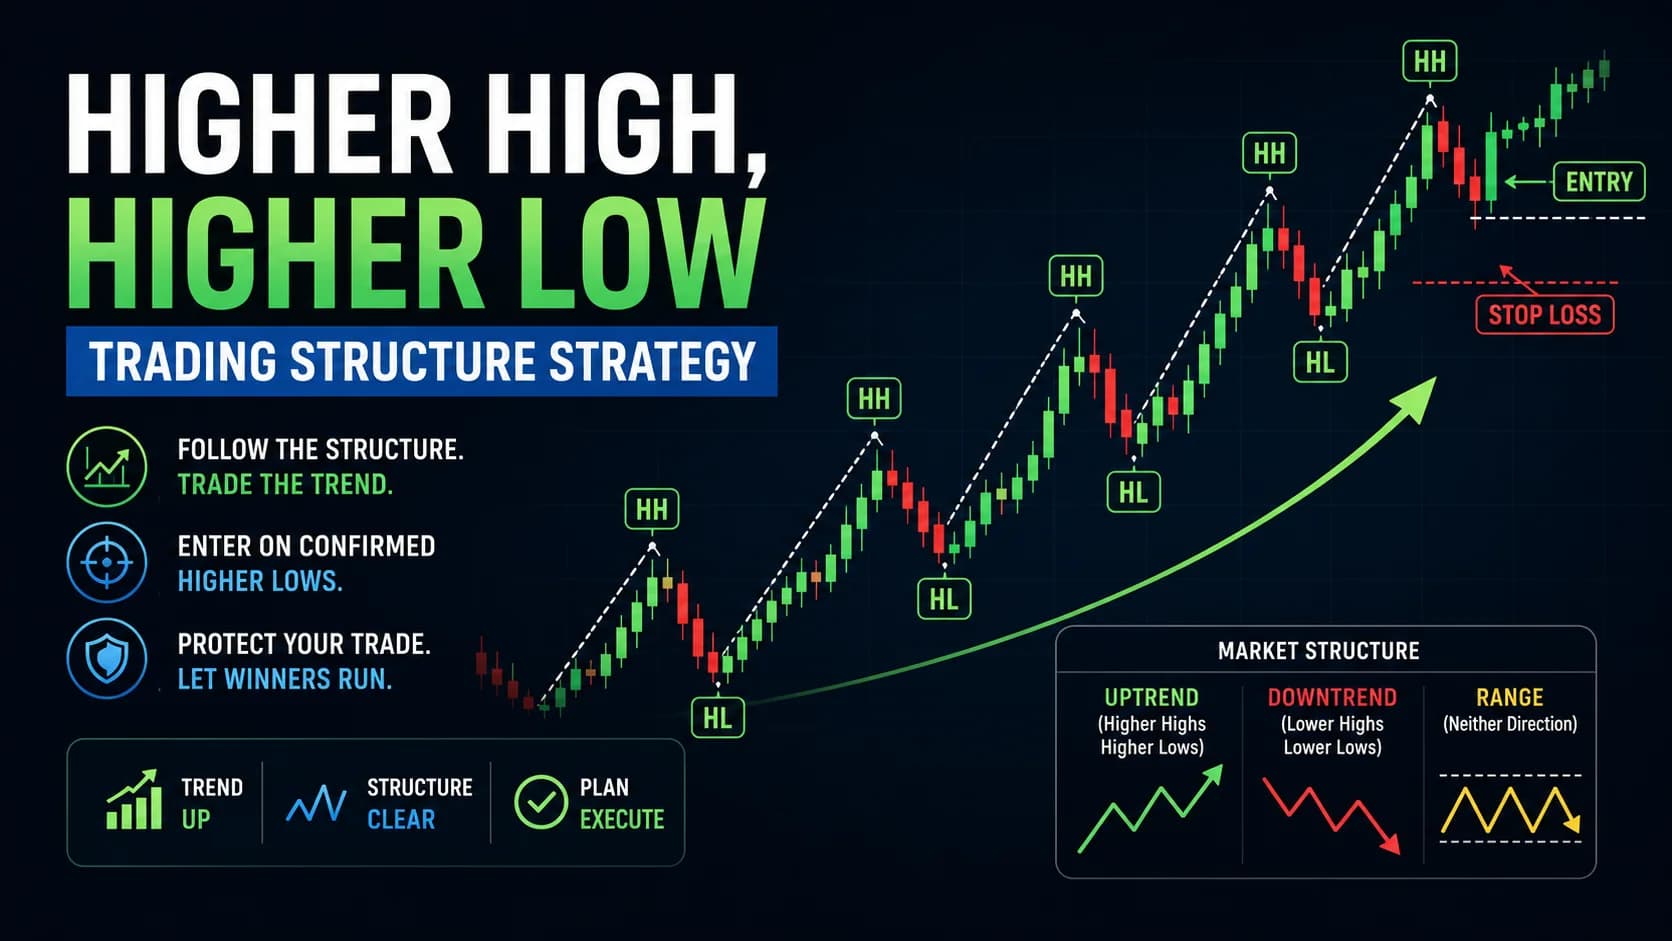
The stochastic oscillator works best as a timing tool layered onto an already-identified trend, rather than as a primary trend-detection method on its own. Traders who first confirm a genuine trend using price structure, such as the higher high, higher low framework, and then use stochastics purely to time entries on pullbacks within that trend tend to see more consistent results than those using stochastics readings in isolation.
FAQ
How is the stochastic oscillator different from RSI?
Because stochastics reacts directly to where price closed within its range, it tends to move faster and generate more frequent signals than RSI, which smooths gains and losses over its lookback period. Traders sometimes use both together, treating agreement between the two as a stronger signal than either indicator alone.
Key Takeaway: Stochastics is generally faster and noisier than RSI, since it measures a different underlying relationship between price and its recent range.
What's the difference between fast, slow, and full stochastics?
Most day traders find fast stochastics too noisy for practical intraday use, generating crossovers too frequently to act on reliably. Slow or full stochastics, with their added smoothing, tend to be the more commonly used versions for actual trade timing, trading some responsiveness for cleaner, more actionable signals.
Key Takeaway: Slow or full stochastics generally work better for practical day trading than the noisier fast version.
Should overbought and oversold stochastic readings always be treated as reversal signals?
Treating every overbought or oversold reading as a reversal cue leads to fighting strong trends, which is one of the more common and costly mistakes traders make with this indicator. The trend context surrounding the reading matters more than the raw overbought or oversold level itself.
Key Takeaway: Context matters more than the raw reading; use overbought and oversold levels as continuation signals within an established trend rather than automatic reversal cues.
What's StochRSI, and how does it relate to the standard stochastic oscillator?
Because StochRSI is a derivative built on top of RSI rather than price directly, it tends to move even more quickly and generate more frequent signals than either standard RSI or standard stochastics alone. It's generally considered a more specialized, noisier tool best suited to traders who specifically want maximum sensitivity and are prepared to filter out the additional false signals that come with it.
Key Takeaway: StochRSI is a faster, noisier derivative of RSI, generally reserved for traders who specifically want maximum short-term sensitivity.
Can stochastic divergence be used the same way as RSI divergence?
Comparing stochastics' peaks and troughs against price works the same way structurally as RSI divergence analysis. Because stochastics moves faster and hits its extremes more often, divergence signals here can appear more frequently but with a somewhat higher false-signal rate than the equivalent pattern on RSI.
Key Takeaway: Stochastic divergence works the same way as RSI divergence but tends to be noisier due to the indicator's faster nature.
What lookback period is standard for the stochastic oscillator?
The 14-period setting reflects the indicator's original design and remains the most widely used starting point across most charting platforms. Shortening the period increases sensitivity and signal frequency at the cost of more noise, a tradeoff traders typically test deliberately rather than adjusting arbitrarily mid-session.
Key Takeaway: 14 periods is the standard default, with shorter periods trading reliability for faster reactivity.
Does the stochastic oscillator work well in range-bound markets?
A clean, well-established trading range with clear top and bottom boundaries is actually one of the better environments for using stochastics as a fade tool, buying oversold near the range bottom and selling overbought near the range top. The distinction matters: a genuine range with defined boundaries behaves differently than disorganized, directionless chop with no clear structure at all.
Key Takeaway: Stochastics can work well in a genuinely defined range, but struggles in disorganized, structureless chop.
Is the stochastic oscillator a good tool for a beginner?
Because stochastics generates signals more frequently than slower oscillators, a beginner using it without first understanding the importance of trend context can end up overtrading on noise. Building that trend-context judgment through simpler tools first tends to make stochastics considerably more useful once it's introduced.
Key Takeaway: Build trend-reading skill with simpler tools first; stochastics rewards that foundation with faster, more actionable signals.
Disclaimer
Article Sources
- StockCharts ChartSchool: Introduction to Technical Indicators and Oscillators - Background on banded oscillators including stochastics and their standard overbought/oversold interpretation.chartschool.stockcharts.com
- StockCharts ChartSchool: Technical Indicators & Overlays - Reference index covering fast, slow, and full stochastics alongside related tools.chartschool.stockcharts.com
- CFA Institute: Technical Analysis for Investment Professionals - Professional context on oscillator-based timing tools within broader technical practice.cfainstitute.org
- FINRA: Day Trading Risk Disclosure - Regulatory guidance on the risks inherent in short-term, indicator-driven trading.finra.org