Bollinger BandsBollinger Bands are three lines plotted around price: a middle moving average and two outer bands set at standard deviations above and below it — they show how stretched or compressed current price action is relative to recent history.Read definition → get most of the attention when traders talk about volatility-based channels, but Keltner Channels solve a specific problem their more famous cousin doesn't: they smooth out the wild width swings that come from a single volatile candle, giving a steadier read on where a trending stock's normal RangeA range (or trading range) is a price zone where a stock oscillates between a defined support floor and resistance ceiling without making meaningful new highs or lows — price is consolidating rather than trending, and the dominant trade is Read definition → actually sits.
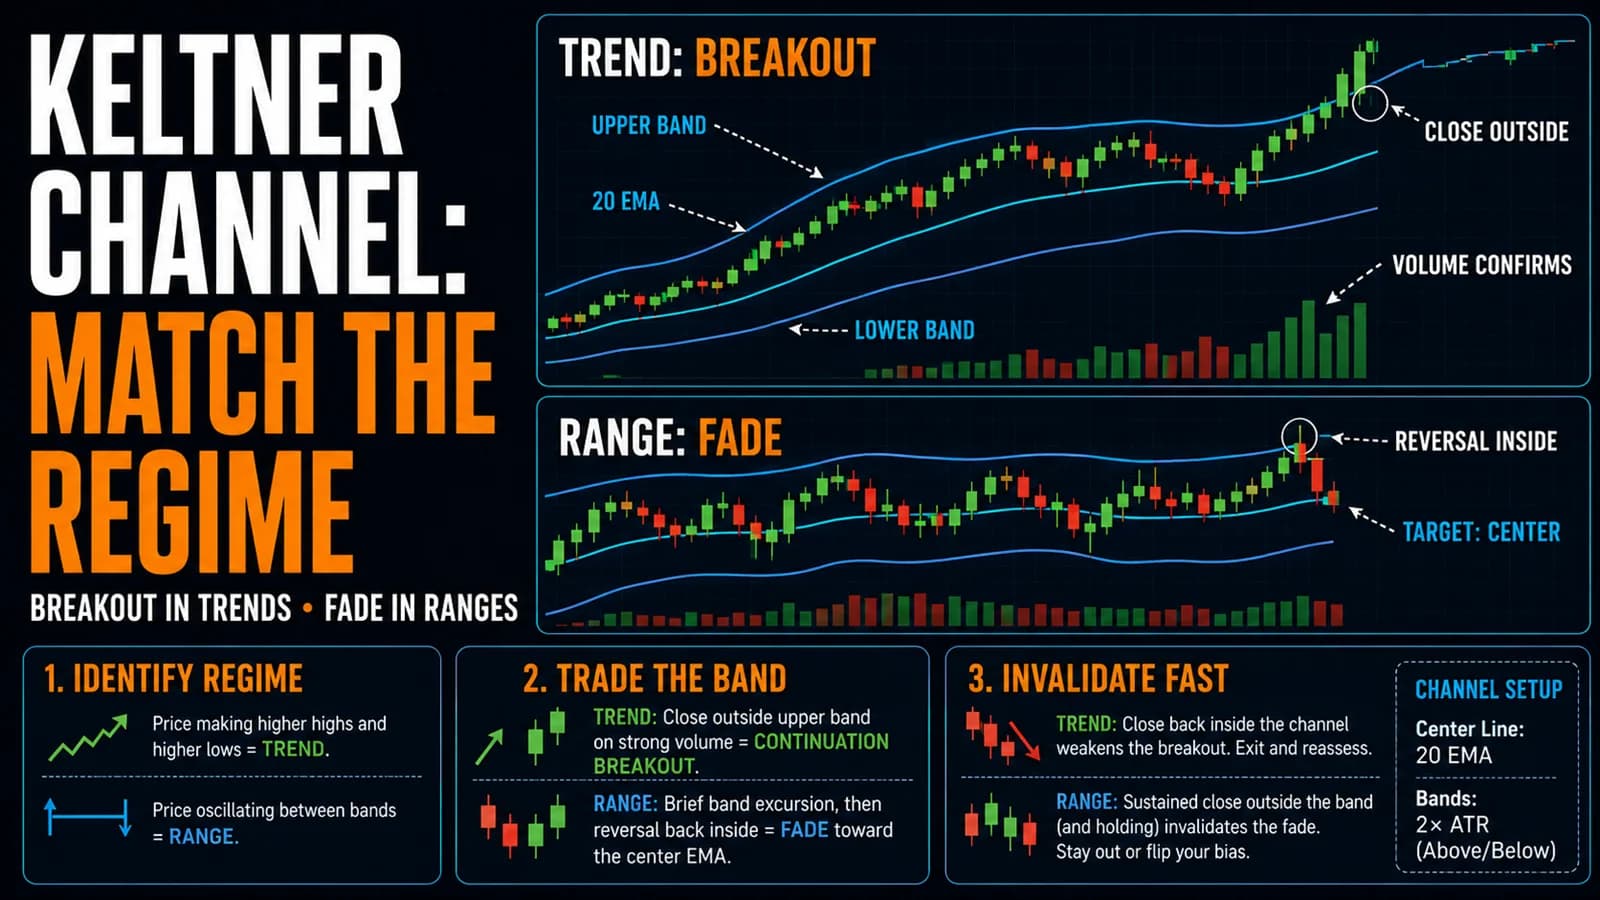
What is the Keltner Channel strategy? The Keltner Channel strategy uses a channel built from an Exponential Moving AverageAn exponential moving average (EMA) is a moving average that weights recent price data more heavily than older data — making it faster to react to new price movement than a simple moving average of the same length.Read definition → with upper and lower bands set a multiple of Average True RangeAverage True Range (ATR) measures how much a stock or market typically moves over a set number of periods — it's a pure volatility reading, not a direction signal.Read definition → away from that average, trading either breakouts beyond the bands during strong trends or bounces off the bands during range-bound conditions, depending on which market regime is currently active.
Why ATR-Based Bands Behave Differently Than Standard Deviation Bands
Keltner Channels center on an exponential moving average, typically 20 periods, with the upper and lower bands set a multiple of Average True Range, commonly 2x, above and below that average. Bollinger Bands, by contrast, use standard deviation to set band width, which reacts more sharply to a single large price swing since standard deviation is heavily influenced by outliers.
ATR is a smoother, more gradual measure of volatility because it averages the true range (accounting for gaps) over a lookback period rather than reacting to squared deviations from the mean. In practice, this means Keltner Channels tend to widen and narrow more gradually than Bollinger Bands, making them somewhat better suited to TrendA trend is a sustained directional movement in price over time — an uptrend is characterized by a sequence of higher highs and higher lows, a downtrend by lower highs and lower lows — and correctly identifying the current trend direction isRead definition →-following approaches where a trader wants price to stay contained within the bands during a strong, sustained move rather than treating every band touch as an extreme.
Two Ways to Trade the Same Channel
Keltner Channels support two genuinely different strategies depending on the underlying market condition, and confusing which one applies is a common and costly mistake. In a strong trend, price frequently rides along the upper (or lower) band for an extended stretch, and a breakout beyond the band can signal accelerating momentum worth following rather than an overextended level to fade. In a range-bound market, the same bands function as boundaries a stock is likely to bounce off of, making mean reversion the more appropriate approach.
Determining which regime is active before choosing a strategy is the single most important judgment call this setup demands. Applying breakout logic in a choppy range, or mean reversion logic in a strong trend, produces the opposite of the intended result in each case.
Setup Specification
- Component
- Market Conditions Required
- Rule
- Trend-following version requires a clearly established directional trend; mean reversion version requires a genuinely range-bound market with defined boundaries
- Component
- Time of Day
- Rule
- Applies throughout the session; most reliable outside the volatile first 10 to 15 minutes when the channel is still stabilizing
- Component
- Stock Selection Criteria
- Rule
- Liquid stocks with average daily volume above 500,000 shares; standard settings use a 20-period EMA with bands at 2x ATR
- Component
- Entry Trigger (trend-following)
- Rule
- Price closes decisively beyond the upper band (for longs) with volume confirming the move, in the direction of an already-established trend
- Component
- Entry Trigger (mean reversion)
- Rule
- Price touches or slightly exceeds the band in a confirmed range-bound market and shows a reversal candle back toward the channel's center
- Component
- Stop Loss
- Rule
- Below the most recent swing low for trend-following longs, or below the band itself for mean reversion entries
- Component
- Initial Profit Target
- Rule
- A measured move projection for trend-following trades, or the channel's opposite band or center line for mean reversion trades
- Component
- Invalidation Criteria
- Rule
- Price failing to hold beyond the band on a trend-following entry, or price continuing well beyond the band on a mean reversion entry without reverting
| Component | Rule |
|---|---|
| Market Conditions Required | Trend-following version requires a clearly established directional trend; mean reversion version requires a genuinely range-bound market with defined boundaries |
| Time of Day | Applies throughout the session; most reliable outside the volatile first 10 to 15 minutes when the channel is still stabilizing |
| Stock Selection Criteria | Liquid stocks with average daily volume above 500,000 shares; standard settings use a 20-period EMA with bands at 2x ATR |
| Entry Trigger (trend-following) | Price closes decisively beyond the upper band (for longs) with volume confirming the move, in the direction of an already-established trend |
| Entry Trigger (mean reversion) | Price touches or slightly exceeds the band in a confirmed range-bound market and shows a reversal candle back toward the channel's center |
| Stop Loss | Below the most recent swing low for trend-following longs, or below the band itself for mean reversion entries |
| Initial Profit Target | A measured move projection for trend-following trades, or the channel's opposite band or center line for mean reversion trades |
| Invalidation Criteria | Price failing to hold beyond the band on a trend-following entry, or price continuing well beyond the band on a mean reversion entry without reverting |
A Narrated Walk-Through
Consider a small-cap industrial stock, call it XYZ, in a strong uptrend, with price riding along the upper Keltner band for the past several candles on the 5 minute chart, the 20 EMA at $22.40 and the upper band at $23.90. At 11:05 AM ET, XYZ breaks above $23.90 to $24.15 on volume 2x the prior average, confirming the breakout beyond the band.
A trader treats this as a trend-following continuation signal, entering at $24.20 with a stop at $23.30, below the most recent swing low. The initial target uses a measured move based on the size of the trend's most recent leg, projecting to roughly $25.60. This walk-through describes a hypothetical archetype rather than a real ticker at current prices, and illustrates the trend-following application specifically, since the mean reversion version would use the opposite logic entirely on a genuinely range-bound stock.
Reading Channel Width as a Volatility Signal
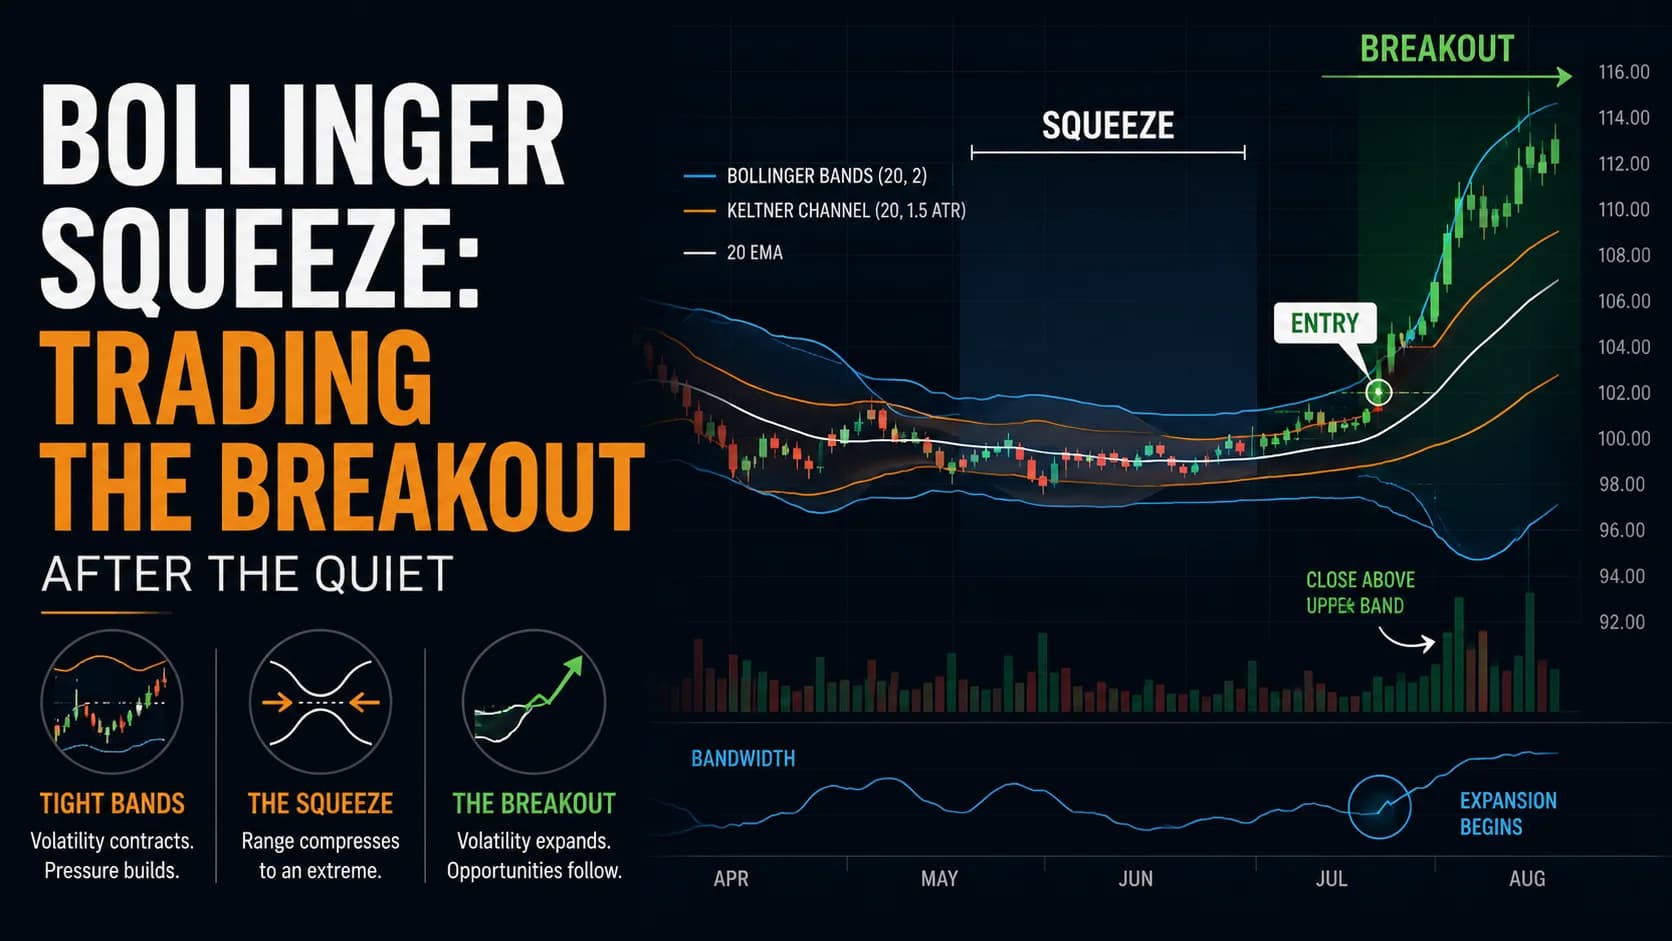
Beyond the two trading approaches above, the width of the channel itself carries useful information. A channel that's been narrowing steadily reflects declining volatility and often precedes an expansion move once the compression resolves, similar in concept to the squeeze pattern traders watch for with Bollinger Bands. A widening channel reflects increasing volatility, which can either confirm a genuine trending move or signal growing uncertainty depending on what price is doing relative to the bands at the same time.
Watching the channel's width alongside price position, rather than looking at either in isolation, gives a more complete picture of what's actually happening in a stock's volatility profile.
Where This Setup Fails
The most common failure mode is applying the wrong version of the strategy to the wrong market condition, using breakout logic on a choppy, range-bound stock that has no real directional conviction, or using mean reversion logic on a stock in a genuinely powerful trend that simply continues riding the band rather than reverting. Correctly identifying the regime before choosing an approach is the single biggest factor separating a well-executed Keltner Channel trade from a poorly executed one.
A second failure mode involves acting on a band touch or break without volume confirmation. A breakout beyond the upper band on thin, unconvincing volume is considerably less reliable than the same break occurring on a clear volume surge, and traders who skip this check often enter breakouts that immediately fail and revert.
A third failure mode occurs around scheduled news events, where a stock can spike beyond either band purely on headline volatility rather than genuine trend or range behavior, and treating that spike as a standard signal ignores the very different dynamics at play during news-driven moves.
Combining Keltner Channels With Other Tools
Some traders use Keltner Channels alongside Bollinger Bands specifically to spot a squeeze setup: when the Bollinger Bands narrow to sit entirely inside the Keltner Channel, it signals unusually low volatility that has compressed even tighter than the smoother ATR-based measure would typically suggest, often preceding a breakout in either direction. This combination gives traders two independently calculated volatility measures pointing toward the same conclusion.
Confirming the underlying trend direction with a moving average, such as checking whether price sits above a rising 20 EMA before treating an upper band break as a genuine trend-following signal, adds another layer of confirmation beyond the channel itself.
Scanning for Keltner Channel Setups
Manually monitoring channel width and band position across a large watchlist is impractical without a scanning tool built for volatility-based filters. A scanner capable of flagging stocks currently breaking beyond their Keltner Channel bands, or those showing a narrowing channel that may be setting up for an expansion move, saves considerable manual review time. Trade Ideas supports customizable technical scans that can incorporate volatility-based conditions like these, helping traders build a focused list of candidates worth watching closely.
Where This Fits a Broader Trading Plan
The Keltner Channel strategy works best when a trader has already built the judgment to distinguish trending from range-bound conditions, since the entire approach depends on applying the correct version of the strategy to the correct regime. Pairing this tool with a broader market regime identification framework helps ensure the trend-following and mean reversion applications get used in the environments where each actually performs well.
FAQ
How is a Keltner Channel different from Bollinger Bands?
Because standard deviation is heavily influenced by outlier price moves, Bollinger Bands can widen sharply after a single large candle, while Keltner Channels widen more gradually since ATR averages true range over a period rather than reacting to squared deviations. Some traders use both together specifically because of this difference, watching for a squeeze pattern where the two disagree on current volatility.
Key Takeaway: Keltner Channels react more smoothly to volatility spikes than Bollinger Bands, which is part of why traders sometimes combine both.
Should Keltner Channels be traded as a breakout tool or a mean reversion tool?
In a genuine trend, price riding along a band and breaking beyond it often signals continuation worth following. In a genuine range, the same band level often marks a boundary likely to produce a reversal back toward the channel's center. Correctly identifying which regime is active is the deciding factor in which approach to use.
Key Takeaway: Determine whether the market is trending or ranging first; that determination decides which Keltner Channel strategy actually applies.
What multiplier is standard for Keltner Channel bands?
A wider multiplier, such as 2.5x or 3x ATR, produces a channel that price breaks beyond less frequently, which some trend traders prefer to filter for only the strongest moves. A narrower multiplier generates more frequent signals with a correspondingly higher noise level, a tradeoff similar to adjusting settings on other volatility-based indicators.
Key Takeaway: 2x ATR around a 20-period EMA is the standard starting point, adjustable based on a trader's preference for signal frequency versus selectivity.
Can Keltner Channels be used to identify a volatility squeeze the same way Bollinger Bands can?
This combination works because the two indicators measure volatility differently, and their agreement on an extreme compression carries more weight than either measure alone. Traders watching for this squeeze often prepare for a breakout in either direction once the compression resolves, similar to the classic Bollinger Band squeeze pattern.
Key Takeaway: A Bollinger Band squeeze inside the Keltner Channel is a well-known combined signal for an impending volatility expansion.
Why does price sometimes ride along the upper Keltner band for an extended period?
A stock in a powerful uptrend can close near or beyond its upper Keltner band for many consecutive candles without ever reverting to the moving average at the channel's center. Traders applying the mean reversion version of this strategy without recognizing this trend-riding behavior often fade a move that simply continues, which is why identifying the regime correctly matters so much.
Key Takeaway: A band ride during a strong trend is expected behavior, not necessarily a signal to fade the move.
How does Keltner Channel width relate to ATR-based stop placement?
A wider channel reflects higher current volatility, which generally corresponds to needing a wider stop to avoid getting shaken out by normal price noise. Traders already using ATR-based position sizing can use the same underlying volatility measure to inform both their channel interpretation and their stop placement.
Key Takeaway: Keltner Channel width and ATR-based stop sizing draw from the same underlying volatility calculation, making them naturally complementary.
Does the Keltner Channel strategy work on lower timeframes for day trading?
Shorter timeframes generally produce more frequent band touches and breaks, some of which reflect meaningful moves and some of which are simply noise. Many day traders find a 5 or 15 minute chart offers a better balance of responsiveness and signal quality for this specific setup than the fastest available timeframes.
Key Takeaway: The 5 or 15 minute chart often provides a better balance for this setup than the noisiest, fastest timeframes.
Is the Keltner Channel strategy beginner-friendly?
A beginner can understand what the channel represents fairly quickly, but applying the correct trading approach for the current market regime is a more advanced skill built through screen time and pattern recognition. Traders new to this concept often benefit from studying basic trend versus range identification before relying heavily on this specific strategy.
Key Takeaway: The concept is simple, but correctly reading the market regime takes practice beyond a beginner's initial exposure to the tool.
Disclaimer
Article Sources
- StockCharts ChartSchool: Technical Indicators & Overlays - Reference covering Keltner Channels alongside related volatility-based overlays.chartschool.stockcharts.com
- StockCharts ChartSchool: Introduction to Technical Indicators and Oscillators - Background on how banded and channel-based indicators are generally interpreted.chartschool.stockcharts.com
- CFA Institute: Technical Analysis for Investment Professionals - Professional context on volatility-based channel indicators within broader technical practice.cfainstitute.org
- FINRA: Day Trading Risk Disclosure - Regulatory guidance on the risks inherent in short-term, indicator-driven trading.finra.org