A $5 stock and a $500 stock can both move "two dollars" in a session, and treating those two moves as equivalent is one of the most common, avoidable mistakes a newer trader makes. Average True RangeAverage True Range (ATR) measures how much a stock or market typically moves over a set number of periods — it's a pure volatility reading, not a direction signal.Read definition → exists specifically to fix this: it measures actual volatility in a stock's own terms, letting a trader set stops, targets, and position sizes that scale correctly regardless of price level.
What is ATR trading? ATR (Average True Range) trading uses the Average True Range indicator, which measures a stock's typical trading RangeA range (or trading range) is a price zone where a stock oscillates between a defined support floor and resistance ceiling without making meaningful new highs or lows — price is consolidating rather than trending, and the dominant trade is Read definition → including gaps over a defined lookback period, to size stops, profit targets, and position sizes proportionally to each stock's actual volatility rather than applying a fixed dollar amount uniformly across different names.
What True Range Actually Captures That a Simple High-Low Range Misses
Developed by J. Welles Wilder, True Range accounts for gaps between sessions, something a simple high-minus-low calculation ignores entirely. True Range is defined as the greatest of three values: the current high minus the current low, the current high minus the previous close, or the current low minus the previous close. This matters enormously for stocks that GapA gap is a price discontinuity on a chart where a stock opens significantly higher or lower than the previous session's close, leaving a visible empty space — gap-ups are driven by overnight buying pressure or positive news; gap-downs by seRead definition → significantly overnight or around news, since a simple high-low range on the gap day would understate the stock's actual volatility by ignoring the overnight jump entirely.
ATR then averages True Range over a chosen lookback period, typically 14 periods, smoothing the daily readings into a single, more stable measure of a stock's typical volatility. This gives traders a genuinely comparable volatility measure across stocks trading at wildly different price points, since ATR expresses volatility in the stock's own actual dollar or point terms rather than a normalized percentage that can obscure real trading conditions.
Why Fixed Dollar Stops Are a Common, Costly Mistake
Many newer traders use the same fixed dollar stop, say 50 cents or a dollar, on every trade regardless of what stock they're trading. This produces two consistent problems: on a low-volatility stock, a 50 cent stop might be far wider than necessary, giving up more risk than the trade actually requires. On a high-volatility stock, the same 50 cent stop might sit well within the stock's normal, random noise, resulting in a stop-out on a completely typical fluctuation that has nothing to do with the trade thesis actually failing.
ATR-based stops solve this by scaling the stop distance to each stock's own typical movement. A common approach places a stop at 1.5x to 2x ATR below an entry for a long position, which automatically produces a wider stop on a genuinely volatile stock and a tighter stop on a calmer one, matching the risk taken to the actual behavior of the specific instrument being traded.
Setup Specification
- Component
- Market Conditions Required
- Rule
- Applies universally as a risk-sizing framework rather than a trend or range-specific entry signal; used alongside any other setup in this hub
- Component
- Time of Day
- Rule
- ATR is typically calculated using daily data for stop sizing, though an intraday ATR variant can be used for very short-term setups
- Component
- Stock Selection Criteria
- Rule
- Works on any liquid stock; ATR simply needs enough price history to calculate meaningfully
- Component
- Entry Trigger
- Rule
- Not a standalone signal; ATR informs stop, target, and position sizing for whatever entry method (breakout, pullback, reversal) is actually being used
- Component
- Stop Loss
- Rule
- Commonly 1.5x to 2x ATR from the entry price, adjusted based on the specific setup's typical risk profile
- Component
- Initial Profit Target
- Rule
- Often set as a multiple of the ATR-based stop distance, such as 2x or 3x the risk taken, to maintain a consistent risk-to-reward ratio across trades regardless of the stock's volatility
- Component
- Trade Management
- Rule
- Position size calculated so that the ATR-based stop distance corresponds to a fixed, small percentage of total account risk per trade
- Component
- Invalidation Criteria
- Rule
- Determined by whatever specific entry setup is in play; ATR itself doesn't generate an invalidation signal but sizes the risk around it
| Component | Rule |
|---|---|
| Market Conditions Required | Applies universally as a risk-sizing framework rather than a trend or range-specific entry signal; used alongside any other setup in this hub |
| Time of Day | ATR is typically calculated using daily data for stop sizing, though an intraday ATR variant can be used for very short-term setups |
| Stock Selection Criteria | Works on any liquid stock; ATR simply needs enough price history to calculate meaningfully |
| Entry Trigger | Not a standalone signal; ATR informs stop, target, and position sizing for whatever entry method (breakout, pullback, reversal) is actually being used |
| Stop Loss | Commonly 1.5x to 2x ATR from the entry price, adjusted based on the specific setup's typical risk profile |
| Initial Profit Target | Often set as a multiple of the ATR-based stop distance, such as 2x or 3x the risk taken, to maintain a consistent risk-to-reward ratio across trades regardless of the stock's volatility |
| Trade Management | Position size calculated so that the ATR-based stop distance corresponds to a fixed, small percentage of total account risk per trade |
| Invalidation Criteria | Determined by whatever specific entry setup is in play; ATR itself doesn't generate an invalidation signal but sizes the risk around it |
A Narrated Walk-Through
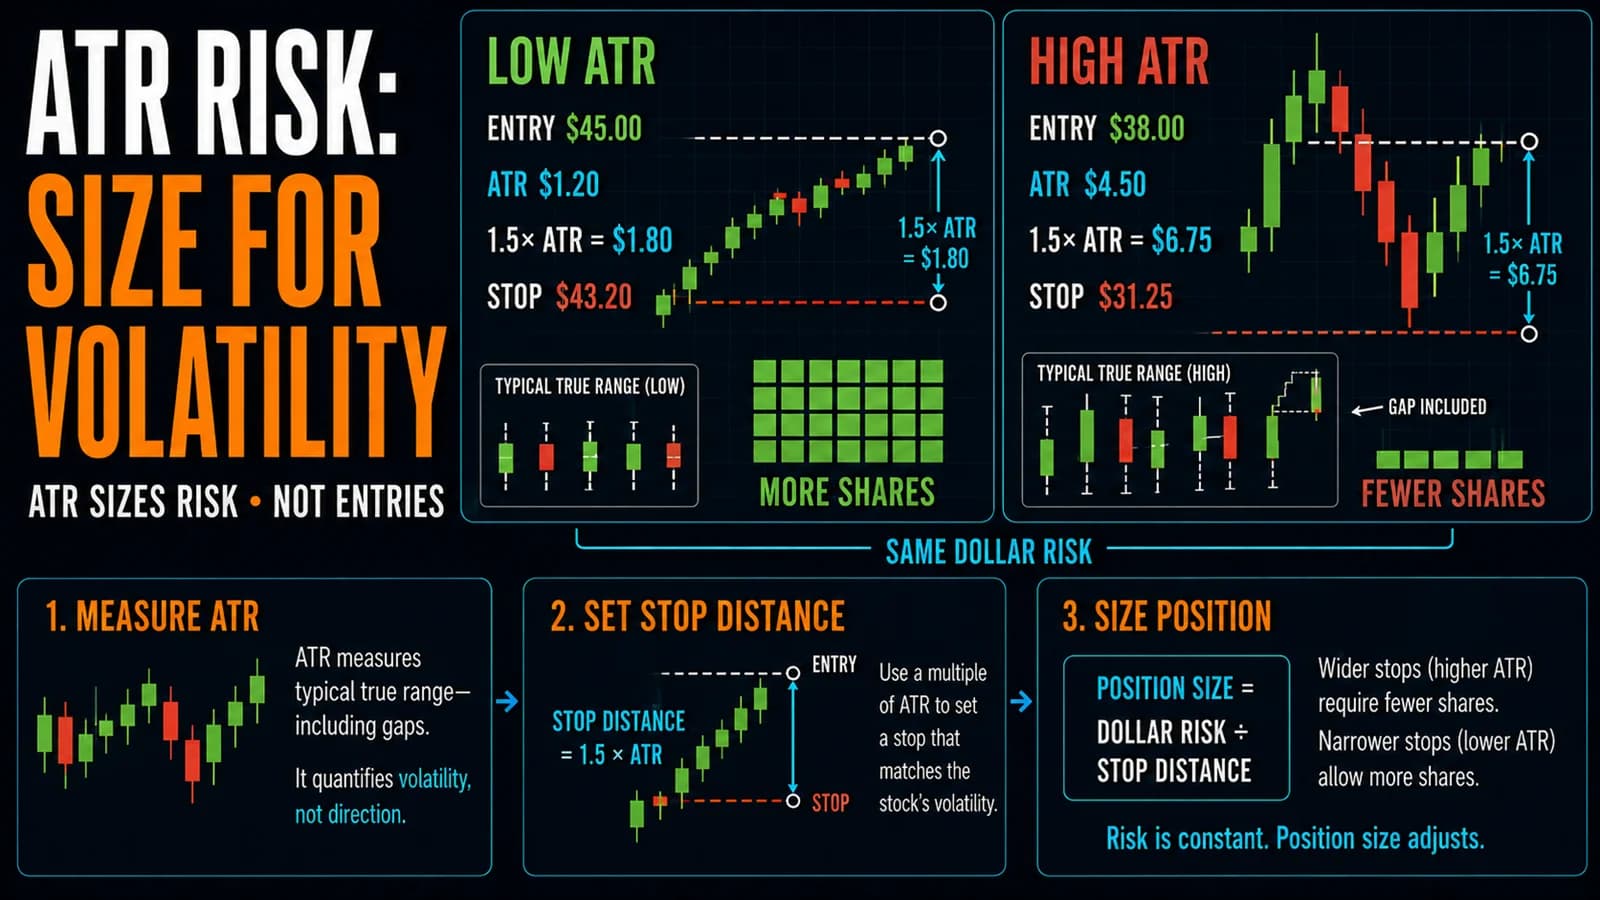
Consider two stocks a trader is evaluating on the same morning. XYZ, a mid-cap industrial name, has a 14-period daily ATR of $1.20 and is trading at $45.00. ABC, a small-cap biotech, has a 14-period daily ATR of $4.50 and is trading at $38.00, reflecting its considerably higher typical volatility despite a lower share price.
For a long entry on XYZ at $45.00, a trader using a 1.5x ATR stop would place the stop at $43.20, $1.80 below entry. For a long entry on ABC at $38.00, the same 1.5x ATR multiple produces a stop at $31.25, $6.75 below entry, a dramatically wider dollar distance reflecting ABC's much higher typical volatility. Position SizePosition size is the number of shares, contracts, or dollar value you deploy in a single trade — determined by the relationship between your account risk percentage, your dollar risk per share (distance to stop), and your account size ratheRead definition → on each trade is then calculated so that the dollar risk to each respective stop represents the same small percentage of the trader's total account, meaning the share count purchased on ABC would be considerably smaller than on XYZ to keep the actual dollar risk consistent. This walk-through describes hypothetical archetypes rather than real tickers at current prices.
Using ATR to Size Positions Consistently Across Different Stocks
The real power of ATR-based risk management shows up when comparing trades across a diverse watchlist. Without a volatility-adjusted framework, a trader sizing every position by share count alone (buying, say, 200 shares of anything) ends up taking wildly different actual dollar risk depending purely on which stock happens to be more volatile that day. An ATR-based approach normalizes this: the trader decides how much total dollar risk they're willing to take per trade, then calculates share count backward from the ATR-based stop distance, ensuring consistent risk exposure regardless of which specific stock is being traded.
This consistency is one of the more overlooked but genuinely important risk management upgrades a trader can make, since it prevents a single volatile name from silently carrying far more portfolio risk than intended simply because its stop needed to be wider in raw dollar terms.
Where ATR-Based Approaches Fail
The most common failure mode is applying a fixed ATR multiplier uniformly across every setup type without adjusting for the specific trade's characteristics. A tight ScalpingScalping is a trading style that targets very small price moves — often just cents or a few ticks — entering and exiting positions within seconds to minutes, with the goal of accumulating many small wins throughout the day while keeping losRead definition → setup might reasonably use a smaller ATR multiple for its stop, while a longer trend-following position might warrant a wider multiple to avoid getting stopped out on normal volatility during a multi-hour hold. Treating every trade with the identical ATR multiplier regardless of the underlying strategy ignores real differences in how much room a given setup actually needs to work.
A second failure mode occurs during sudden volatility regime changes. ATR is a lagging, backward-looking average, and a stock that's been calm for weeks can suddenly become far more volatile around an earnings release or major news event, with ATR only catching up to the new volatility level gradually over subsequent sessions. A stop sized using a pre-event ATR reading can be far too tight for the stock's genuinely new, elevated volatility immediately following such a catalyst.
A third failure mode involves ignoring ATR entirely on the profit-taking side while still using it for stops. Some traders carefully size their stop using ATR but then set an arbitrary, fixed dollar profit target unrelated to the stock's actual volatility, producing an inconsistent risk-to-reward ratio across different trades even though the risk side was carefully calculated.
ATR as a Volatility Filter, Not Just a Sizing Tool
Beyond stop and position sizing, ATR itself can serve as a filter for identifying meaningful moves. A breakout accompanied by a candle range that significantly exceeds the stock's typical ATR suggests genuinely unusual participation, while a breakout on a candle range close to or below average ATR suggests less conviction behind the move. This use of ATR as a volatility confirmation tool complements its more common application as a risk-sizing framework.
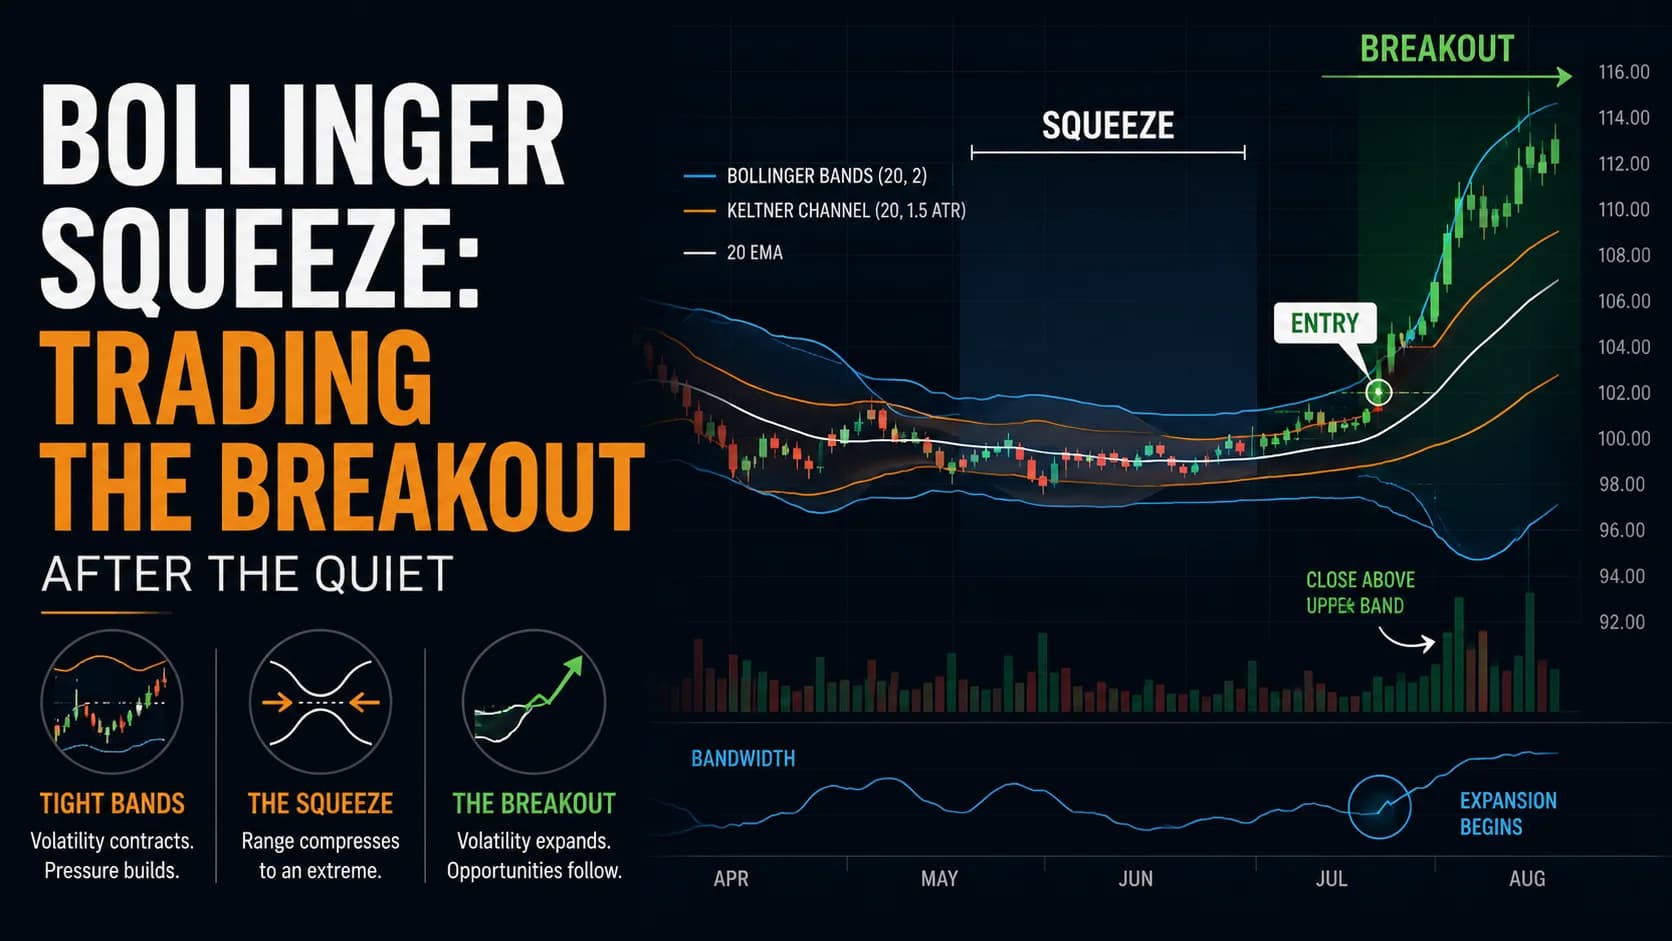
ATR also informs whether a given setup, such as the Bollinger Band squeeze or Keltner Channel strategies covered elsewhere in this hub, is occurring during genuinely compressed or expanded volatility conditions relative to the stock's own history.
Tools for Incorporating ATR Into a Trading Routine
Most charting platforms display ATR as a standard, readily available indicator, but calculating appropriate position sizes across a watchlist in real time benefits from a tool that can automate the math. Some scanning and charting platforms include built-in position sizing calculators that incorporate ATR directly. Trade Ideas offers charting with ATR displayed alongside its broader scanning tools, and some traders use its filters to flag stocks whose current volatility has shifted meaningfully from historical norms, a useful check before relying on an older ATR reading for stop sizing.
Where ATR-Based Risk Management Fits a Broader Plan
ATR-based sizing works as a foundational risk management layer underneath any specific entry strategy in this hub, rather than a standalone trading signal on its own. Traders who build ATR-based stop and position sizing into every trade, regardless of which specific setup they're using that day, tend to maintain more consistent risk exposure across their portfolio than those relying on fixed dollar amounts, an important complement to the specific-strategy risk rules covered in strategy-specific risk management.
FAQ
What ATR multiple is standard for setting a stop loss?
A tighter setup, such as a fast scalp, might reasonably use a smaller multiple like 1x ATR, while a longer trend-following hold might warrant 2x or more to avoid premature stop-outs during normal volatility. There's no single universally correct multiple; traders typically test and adjust based on their specific strategy's historical performance.
Key Takeaway: 1.5x to 2x ATR is a common starting point, adjustable based on the specific setup's typical risk profile.
How does ATR account for overnight gaps that a simple high-low range doesn't?
A stock that gaps up significantly overnight and then trades in a tight range during the session would show a small high-low range for that day, but a much larger True Range once the gap from the previous close is factored in. This distinction matters considerably for stocks prone to overnight gaps around news or earnings.
Key Takeaway: True Range captures overnight gaps that a simple high-low calculation misses, making ATR a more complete volatility measure for gap-prone stocks.
Should ATR-based stops be used on every single trade, regardless of strategy?
While the specific multiplier and application details vary by setup, whether a breakout, a pullback, or a reversal trade, the underlying principle of scaling stop distance to the stock's actual volatility applies broadly. This is one of the more universally applicable risk management concepts covered across this hub's individual strategy articles.
Key Takeaway: ATR-based sizing is broadly applicable across most trading strategies, not limited to any single setup type.
How quickly does ATR adjust to a sudden change in a stock's volatility?
This lag means a stop sized using a pre-event ATR reading can be poorly calibrated for a stock's genuinely new volatility regime immediately after a major catalyst. Traders often manually widen stops or reduce position size following a known volatility-inducing event, rather than relying purely on the ATR reading until it catches up over the following sessions.
Key Takeaway: ATR lags sudden volatility changes; manually adjust risk parameters immediately following a major catalyst rather than waiting for ATR to catch up.
Can ATR be used for setting profit targets as well as stops?
Using ATR consistently on both the stop and target side avoids the inconsistency that comes from carefully calculating a volatility-adjusted stop while setting an arbitrary, unrelated profit target. This approach keeps the risk-to-reward ratio comparable across trades even when the underlying stocks have very different volatility profiles.
Key Takeaway: Apply ATR to both stops and targets for a consistent risk-to-reward ratio across different stocks.
Does ATR work the same way across stocks, futures, and forex?
ATR simply requires high, low, and closing price data, which is available across essentially any liquid, actively traded market. Traders working futures or forex apply the same True Range and averaging logic, adjusting only for the specific point or pip values relevant to that particular instrument.
Key Takeaway: ATR's calculation method is universal across asset classes, with only the specific unit values (dollars, points, or pips) differing.
How does ATR relate to position sizing calculations?
This calculation ensures that regardless of a stock's volatility or price level, the actual dollar amount at risk on any given trade stays consistent with a trader's predetermined risk tolerance. A more volatile stock with a wider ATR-based stop simply results in a smaller share count to keep total dollar risk the same as a calmer stock traded with a larger share count.
Key Takeaway: ATR-based stop distance directly informs position size, keeping dollar risk consistent regardless of a stock's individual volatility.
Is ATR-based risk management appropriate for a beginner trader?
Unlike some of the more visually complex indicators covered elsewhere in this hub, ATR's core concept, scaling risk to a stock's actual typical movement, is intuitive and immediately actionable even for a trader still learning more advanced technical analysis. Building this habit early tends to prevent a specific, common, and costly mistake before it becomes ingrained.
Key Takeaway: ATR-based risk management is an accessible, high-value concept worth adopting early, addressing a common and costly beginner mistake directly.
Disclaimer
Article Sources
- StockCharts ChartSchool: Technical Indicators & Overlays - Reference covering ATR and related volatility measurement tools.chartschool.stockcharts.com
- CFA Institute: Technical Analysis for Investment Professionals - Professional context on volatility measurement and its role in risk-adjusted position sizing.cfainstitute.org
- CME Group Education - Background on volatility measurement as applied across futures and broader markets.cmegroup.com
- FINRA: Day Trading Risk Disclosure - Regulatory guidance on the risks inherent in short-term, active trading strategies.finra.org