
Tape Reading for Day Traders: Reading Time & Sales Like a Pro

In this article10 sections
A stock has been grinding up all morning. Then, at $48.60, the tape suddenly fires: fifteen prints in four seconds, sizes jumping from 200 shares to 2,000, the ask getting hit over and over. On the chart, that whole burst is just one green candle, nothing more. On the tape, it reads as a sudden rush of urgency that arrives all at once and then, just as suddenly, stops. Thirty seconds later, no new high prints. The stock stalls at $48.71 and starts trading back through $48.50.
The chart never shows that stall forming. The tape does, and catching it before price confirms it is the entire case for tape reading. It's also the entire risk of it: the tape rewards a trained eye and punishes a guess dressed up as a read.
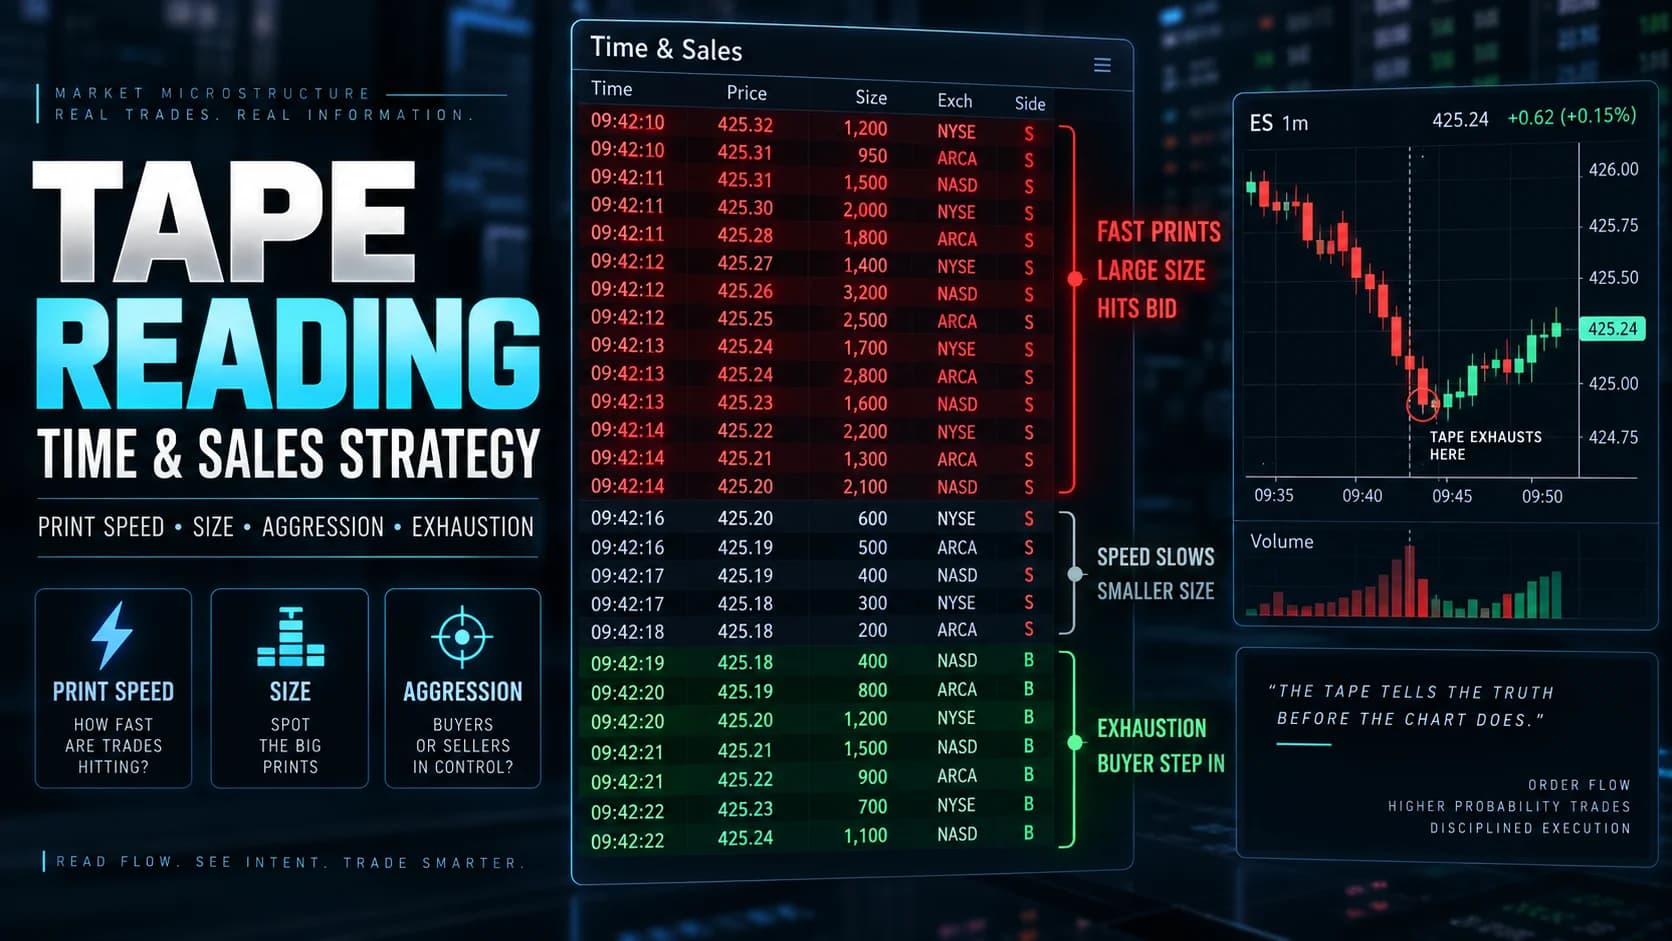
What is tape reading? Tape reading is the practice of watching the live stream of executed trades, known as Time & Sales, to judge the size, speed, and aggression of buying and selling as it happens. Instead of waiting for a candle to close, a tape reader reacts to the trades printing right now, using changes in print size and pace to infer whether real conviction is entering or leaving a stock.
Tape Reading vs. Watching a Chart: What the Tape Actually Adds
A candlestick chart is a summary. Every bar compresses hundreds or thousands of individual trades into four numbers: open, high, low, close. That summary is useful, but it throws away the order in which those trades happened, and order matters. A stock that opens at $48.20, spikes to $48.80 on three huge prints in the first ten seconds, then drifts back to $48.55 for the rest of the minute looks identical on a 1-minute chart to a stock that climbed steadily from $48.20 to $48.55 the whole way. Those are two completely different stories about who was in control, and the chart can't tell them apart.
The tape can. Time & Sales shows every print: price, size, and the exchange or venue it executed on, updating live. Reading it well means tracking three things simultaneously: the size of individual prints relative to that stock's normal size, the pace at which prints are arriving, and whether the price is actually advancing in proportion to that activity or stalling despite it.
This is different from watching Level 2 quotes and the order book, which show resting orders that haven't executed yet. Time & Sales only shows trades that have already happened. The two are complementary. Level 2 tells you what's offered. The tape tells you what actually got done, at what size, and how fast. A trader building real order-flow fluency eventually reads both together, but tape reading as a standalone skill is about the executed trade stream specifically. Market makers and how order flow actually gets filled is worth understanding first if the mechanics of who's on the other side of a print aren't already familiar.
When the Tape Actually Tells You Something Real
Tape reading isn't equally useful everywhere. It works best in stocks with genuine two-sided participation, meaning real buyers and real sellers are actively competing for shares, not a single algorithm quoting both sides of a wide spread because nobody else showed up.
That means liquid names: relative volume at 2x or higher against the stock's own average, share price generally above $5, and average daily volume in the millions rather than the hundreds of thousands. Below that threshold, a handful of market makers can dominate the tape, and what looks like "aggression" is often just one algorithm working a VWAP order in small slices. The read gets unreliable exactly where a beginner most wants a shortcut: thin, choppy, low-information stocks.
Time of day matters as much as the stock. The tape is richest in the first 90 minutes after the open and the final hour before the close, when order flow is heaviest and urgency is real. Midday, from roughly 11:30 AM to 2:00 PM ET, print pace slows and a burst of five or six prints can look dramatic purely because the baseline is so quiet. The same burst at 9:35 AM might be nothing. Context, not just the raw print, is what makes a read valid.
The Exhaustion Print Setup: A Mechanical Tape-Reading Trigger
Tape reading can feel like pure intuition, but the setup that separates a trained read from a guess is mechanical: a sudden, sharp acceleration in print size and pace that fails to produce proportional price progress. This is the exhaustion print, and it's the single most tradeable pattern the tape offers.
- Component
- Market Conditions Required
- Rule
- RVOL at 2.0 or higher; two-sided, liquid tape (not a single-market-maker name)
- Component
- Time of Day
- Rule
- 9:30–11:00 AM ET or 3:00–4:00 PM ET only
- Component
- Stock Selection Criteria
- Rule
- Price above $5, average daily volume above 1 million shares, visible depth on both sides of Level 2
- Component
- Entry Trigger
- Rule
- A burst of 8+ prints in under 10 seconds, with print size at least 3x the stock's trailing average print size, that fails to move price beyond the burst's own opening range
- Component
- Stop Loss
- Rule
- One tick beyond the high (for a short) or low (for a long) of the exhaustion burst itself
- Component
- Initial Profit Target
- Rule
- First scale at the most recent swing level or a 1:1 R-multiple, whichever comes first
- Component
- Trade Management
- Rule
- Trail the remainder using print deceleration: exit more as pace slows toward baseline
- Component
- Invalidation Criteria
- Rule
- A follow-through print burst that exceeds the exhaustion burst's size and clears its price extreme in the same direction
| Component | Rule |
|---|---|
| Market Conditions Required | RVOL at 2.0 or higher; two-sided, liquid tape (not a single-market-maker name) |
| Time of Day | 9:30–11:00 AM ET or 3:00–4:00 PM ET only |
| Stock Selection Criteria | Price above $5, average daily volume above 1 million shares, visible depth on both sides of Level 2 |
| Entry Trigger | A burst of 8+ prints in under 10 seconds, with print size at least 3x the stock's trailing average print size, that fails to move price beyond the burst's own opening range |
| Stop Loss | One tick beyond the high (for a short) or low (for a long) of the exhaustion burst itself |
| Initial Profit Target | First scale at the most recent swing level or a 1:1 R-multiple, whichever comes first |
| Trade Management | Trail the remainder using print deceleration: exit more as pace slows toward baseline |
| Invalidation Criteria | A follow-through print burst that exceeds the exhaustion burst's size and clears its price extreme in the same direction |
Read the trigger closely, because the "failure" is the entire signal. A burst of large, fast prints that pushes price higher along with it is not exhaustion. That's genuine momentum, and fading it is how traders lose money fighting a real trend. Exhaustion is specifically a burst of aggression that does not translate into proportional price movement. The volume shows up. The follow-through doesn't. That mismatch, size without progress, is what tips a trader off that the aggressive side is running out of resting supply or demand to work through, not gathering strength.
Walking Through a Live Tape: A Minute-by-Minute Read
Picture a mid-cap tech stock, call it XYZ, trading at $48.20 with average daily volume around 4 million shares. At 9:41 AM ET, RVOL sits at 2.3. XYZ has been climbing steadily since the open on a stream of routine 100 to 300 share prints, roughly one every two to three seconds.
At 9:41:12, the pace changes. Six prints land in three seconds: 500 shares at $48.55, 800 at $48.58, 1,200 at $48.61, all hitting the ask. Then three more in the next two seconds: 1,500 at $48.65, 2,000 at $48.68, 900 at $48.70. That's eleven prints in five seconds, sizes running four to eight times the prior baseline, and price has jumped $0.50 in the process. So far, this looks like real momentum, not exhaustion, because price is advancing in proportion to the size hitting the tape.
Then the pattern breaks. Over the next eight seconds, six more prints land, similar size to the last burst, 800 to 1,500 shares each, still hitting the ask aggressively. But price doesn't follow. The prints top out at $48.71, dip to $48.69, print again at $48.70, and $48.71 twice more. Twelve prints, comparable size and speed to the move that produced fifty cents of progress, and this batch produces essentially nothing. That's the exhaustion signal: the buying pressure by print-count and size looks just as aggressive, but the market has stopped rewarding it with higher prices.
A trader watching this in real time has their trigger at 9:41:25, the moment the second burst fails to clear $48.71 despite matching or exceeding the first burst's intensity. Entry short at $48.68 on the next available print, stop at $48.72 (one tick above the burst high), initial target at $48.50, the most recent swing low from the move up. Risk is $0.04 per share against a target eighteen cents away, a workable ratio if the read is right.
Managing a Trade Entered Off the Tape
Trade management after a tape-based entry should stay tied to the same data that generated the signal. Watching for print deceleration, meaning fewer prints per second and shrinking average size, on the side that's now working in the trader's favor confirms the read is playing out. In the XYZ example, that would mean watching for shrinking, less frequent prints on the ask as price falls back through $48.60, $48.55, and toward the $48.50 target.
Scale out partial size at the first target level rather than holding for a single exit. Tape-based trades tend to resolve quickly, often within the first one to three minutes, because the imbalance that created the signal either confirms fast or gets overrun by a fresh wave of the opposite side. If price stalls again on the way to target with the same size-without-progress signature, that's a second, smaller confirmation to hold the rest of the position. If instead a fresh burst of large prints appears working against the trade, hitting the bid aggressively in this example while the trader is still short, that's the invalidation signal, not a level to fight.
Where Tape Reading Breaks Down
Tape reading has one honest, structural problem: a meaningful share of today's order flow never looks like Jesse Livermore's tape. Algorithmic execution systems routinely slice large institutional orders into small, evenly paced child orders specifically to avoid the kind of visible burst that tape readers are trained to spot. A 50,000-share order worked by an execution algorithm over twenty minutes can look, print by print, like routine retail flow. There's no burst to read, because the algorithm was built to prevent one.
Reserve and iceberg orders compound the problem. A trader might see a 200-share print at the ask, then another, then another, with no sign of size, while a much larger resting order sits hidden behind the displayed quote and refills every time the visible portion executes. The tape shows a string of small, unremarkable prints. What's actually happening is one large, patient participant working a much bigger position. This setup gets its own full treatment in the iceberg orders and hidden liquidity guide, but the short version for tape reading purposes is: a series of same-size prints refilling at the exact same price level is itself a signal, just a different one than a burst.
Off-exchange and dark pool volume adds a second layer of noise. A significant share of total U.S. equity volume never prints to the visible tape in real time at all; it executes away from the lit exchanges and reports separately, which means the tape a retail trader watches is, by design, an incomplete picture of total trading activity in that name at any given moment. FINRA's own alternative trading system data makes this share visible after the fact, even though it isn't visible live.
Low-float, single-market-maker stocks are the other reliable failure mode. When one or two participants control both sides of the quote, "aggression" on the tape can simply be that participant repositioning, not competing buyers and sellers revealing genuine supply and demand. The exhaustion setup depends on real two-sided competition; without it, the read isn't wrong so much as meaningless.

Adapting Tape Reading Across Different Stocks and Sessions
The exhaustion setup scales, but the thresholds don't stay fixed. A $400 stock with light share volume but heavy dollar volume needs its "large print" threshold measured differently than a $6 stock trading tens of millions of shares a day; comparing raw share size across those two names is comparing unlike things. The fix is to anchor every threshold to that specific stock's own trailing average print size and pace, recalculated each session, rather than using a fixed number like "1,000 shares" as a universal rule.
Index ETFs like SPY and QQQ behave differently again. Their tape is dominated by high-frequency market-making and arbitrage activity tied to the underlying basket and futures, which means raw print bursts are far more common and far less informative than in an individual stock where a burst usually reflects a specific catalyst or a specific large participant. Tape reading on SPY works better as a secondary confirmation tool, layered under a primary level-based or VWAP-based approach, than as the standalone signal it can be on an individual equity.
Session context shifts the read too. The same exhaustion pattern in the opening 90 minutes tends to resolve faster and cleaner, because urgency is real and participants are actively repositioning. The identical pattern in the last hour, especially in the final 15 minutes, can be distorted by closing imbalance orders and index rebalancing flow, which are mechanical and don't carry the same directional information as discretionary aggression earlier in the day.
Software That Makes the Tape Readable at Modern Speeds
Reading raw Time & Sales by eye works, but at real trading speed, most active traders lean on tools that color-code, filter, or aggregate the print stream so the signal is easier to catch. A platform that lets a trader filter prints by minimum size, highlight prints above a custom threshold, and see the exchange or venue per trade turns a wall of numbers into something scannable in real time.
Scanning for the setup itself, meaning finding stocks where RVOL and print pace are already elevated before committing screen time to watching the tape, is a separate problem, and it's where a tool like Trade Ideas fits into a tape-reading workflow: its real-time scanning and alerting can surface which names are seeing unusual print activity right now, so a trader isn't manually scanning the tape on fifty stocks hoping to catch a burst. For traders who want to go further into visualized order flow, aggregated depth, and heatmap-style views of the tape rather than a raw scrolling list, DayTradingToolkit's review of Bookmap covers a tool purpose-built for that kind of visualization.
Where Tape Reading Fits Inside a Complete Trading Plan
Tape reading is a timing tool, not a standalone strategy. It answers one question well: is real aggression entering or leaving this stock right now? It doesn't answer what the stock's larger trend is, what today's catalyst was, or what a reasonable risk-reward target looks like on a multi-minute or multi-hour basis. Those answers come from a trader's broader plan, built around proper position sizing and a defined risk/reward framework, with the tape layered in as a precision entry and exit tool on top of setups already identified through other means, like a level, a VWAP reclaim, or a breakout trigger.
Used that way, tape reading sharpens execution on trades a trader was already planning to take. Used as the sole reason to enter a trade, with no broader thesis behind it, it becomes a fast way to overtrade on noise that briefly looked like signal.
Frequently Asked Questions
How is tape reading different from watching Level 2 quotes?
Tape reading tracks the stream of completed transactions: price, size, and speed of prints as they happen. Level 2 shows the order book, the bids and offers sitting at each price level waiting to be filled. A trader can watch heavy size resting on Level 2 that never actually trades, or watch aggressive prints hit the tape from size that was never visible on the book beforehand because it came from a hidden or iceberg order. The two data streams answer different questions and work best read together.
Key Takeaway: Time & Sales confirms what actually happened; Level 2 shows what's currently being offered, and neither replaces the other.
Why do exhaustion prints sometimes fail to mark a top or bottom?
The exhaustion setup identifies a specific imbalance: aggressive size that stopped producing price progress. It's a read on the immediate supply and demand in that moment, not a guarantee about everything that happens next. A fresh catalyst, a new institutional order arriving seconds later, or a short squeeze building on top of the stall can all override the signal. This is why the setup includes a hard stop one tick beyond the burst's own extreme rather than a wider, hope-based stop.
Key Takeaway: Treat exhaustion as a probability read with a tight, defined invalidation level, never a certainty.
Can tape reading still work now that most retail volume is executed by algorithms?
Execution algorithms are specifically designed to avoid producing visible bursts, which actually makes a real, sudden acceleration in size and pace more meaningful when it does appear, since it stands out against a baseline of smooth, sliced flow. The tape is noisier than it was decades ago, but a genuine imbalance is arguably more informative, not less, because it's rarer.
Key Takeaway: Algorithmic flow raises the bar for what counts as a real signal; it doesn't erase the signal entirely.
What print size actually counts as "large" on a $20 stock versus a $200 stock?
A 1,000-share print might be routine on a heavily traded $20 stock and extraordinary on a lightly traded $200 name. The exhaustion setup's threshold, 3x the trailing average print size, is deliberately relative rather than absolute so it adapts across price and liquidity tiers without a trader needing a separate rulebook for every stock.
Key Takeaway: Anchor every size threshold to the specific stock's own recent average, recalculated each session.
How do dark pool prints and off-exchange trades distort what appears on the tape?
That means the print stream a trader watches live is, by construction, an incomplete record of all trading activity happening in that name at that moment. It doesn't make tape reading useless, since the visible, lit-market flow is still real and still tradeable, but it does mean a trader should treat the tape as one data source among several rather than a complete picture. FINRA's alternative trading system data shows this off-exchange share after the fact.
Key Takeaway: The live tape shows lit-market activity only; pair it with awareness that off-exchange flow exists but isn't visible in real time.
Does tape reading work on ETFs like SPY and QQQ the same way it works on individual stocks?
Print bursts on SPY or QQQ are far more common and often reflect mechanical arbitrage between the ETF, its futures, and the underlying index rather than discretionary buying or selling conviction. That doesn't make the tape worthless on these products, but it works better as a secondary confirmation layered under a level-based or VWAP-based plan than as a primary signal the way it can be on an individual equity.
Key Takeaway: Treat ETF tape reads as confirmation, not a primary trigger, given how much of that flow is mechanical arbitrage.
What's the difference between reading raw Time & Sales versus a footprint chart built from the same prints?
Footprint charts trade some of the tape's real-time immediacy for structure, making it easier to see where volume clustered at a given price after the fact. Raw tape reading rewards fast pattern recognition in the moment; footprint analysis rewards structured, after-the-fact or slightly-delayed review of where volume built up. The footprint chart strategy guide covers that approach in depth.
Key Takeaway: Tape reading is live and linear; footprint charts are structured and price-organized, and many traders use both.
How many prints per second should make a trader suspicious of algorithmic order slicing rather than genuine urgency?
Genuine urgency tends to show variable size and irregular timing, aggressive participants don't neatly space their orders. Algorithmic slicing tends to show remarkably uniform size and pace, because that's exactly what the execution algorithm was built to produce, in order to minimize market impact. The variability, or lack of it, matters more than the raw speed.
Key Takeaway: Uniform size and uniform timing signal a sliced algorithmic order; irregular size and irregular timing signal genuine discretionary urgency.
Can tape reading be automated, or does it require a human watching the screen?
Scanning software can flag when print size and pace exceed a defined multiple of trailing averages, which solves the discovery problem of finding candidates worth watching. But distinguishing a genuine exhaustion stall from a brief pause before continuation still leans on pattern recognition that's hard to fully codify, which is why most traders use automation to surface candidates and a manual read to pull the trigger.
Key Takeaway: Automation is well suited to alerting on the setup's conditions; the final entry decision still benefits from a trained, manual read.
Why does tape reading tend to break down in low-float, single-market-maker stocks?
When one or two participants effectively control both sides of the quote, prints can reflect a single entity repositioning rather than a real imbalance between competing sides. The read isn't necessarily wrong in a technical sense, but it's answering a different, less useful question than it would in a genuinely liquid, competitive name.
Key Takeaway: Reserve tape-based setups for names with real depth and multiple active participants, not thinly traded, single-market-maker stocks.
Disclaimer
Article Sources
- SEC: Types of Orders (Investor.gov) - official explainer on how different order types interact with the market and the visible trade record.
- SEC Rule 606 FAQ - staff guidance on order routing and execution disclosure requirements for broker-dealers.
- SEC Press Release 2012-197: Hold Brothers Layering Case - documented enforcement action showing how fabricated orders can be used to distort visible market activity.
- FINRA ATS Quarterly Statistics - official data on off-exchange trading volume that doesn't appear on the live tape.
- StockCharts ChartSchool: Volume - foundational reference on how volume and participation are analyzed in market data.
Was this helpful?
Be the first to weigh in

Written by
Kazi Mezanur RahmanFounder, independent researcher, and editor of DayTradingToolkit. A one-person publication focused on risk-first trading education and documented tool research. He trades his own capital as a retail trader and combines personal market experience with systematic primary-source research.
Keep Reading
Strategies
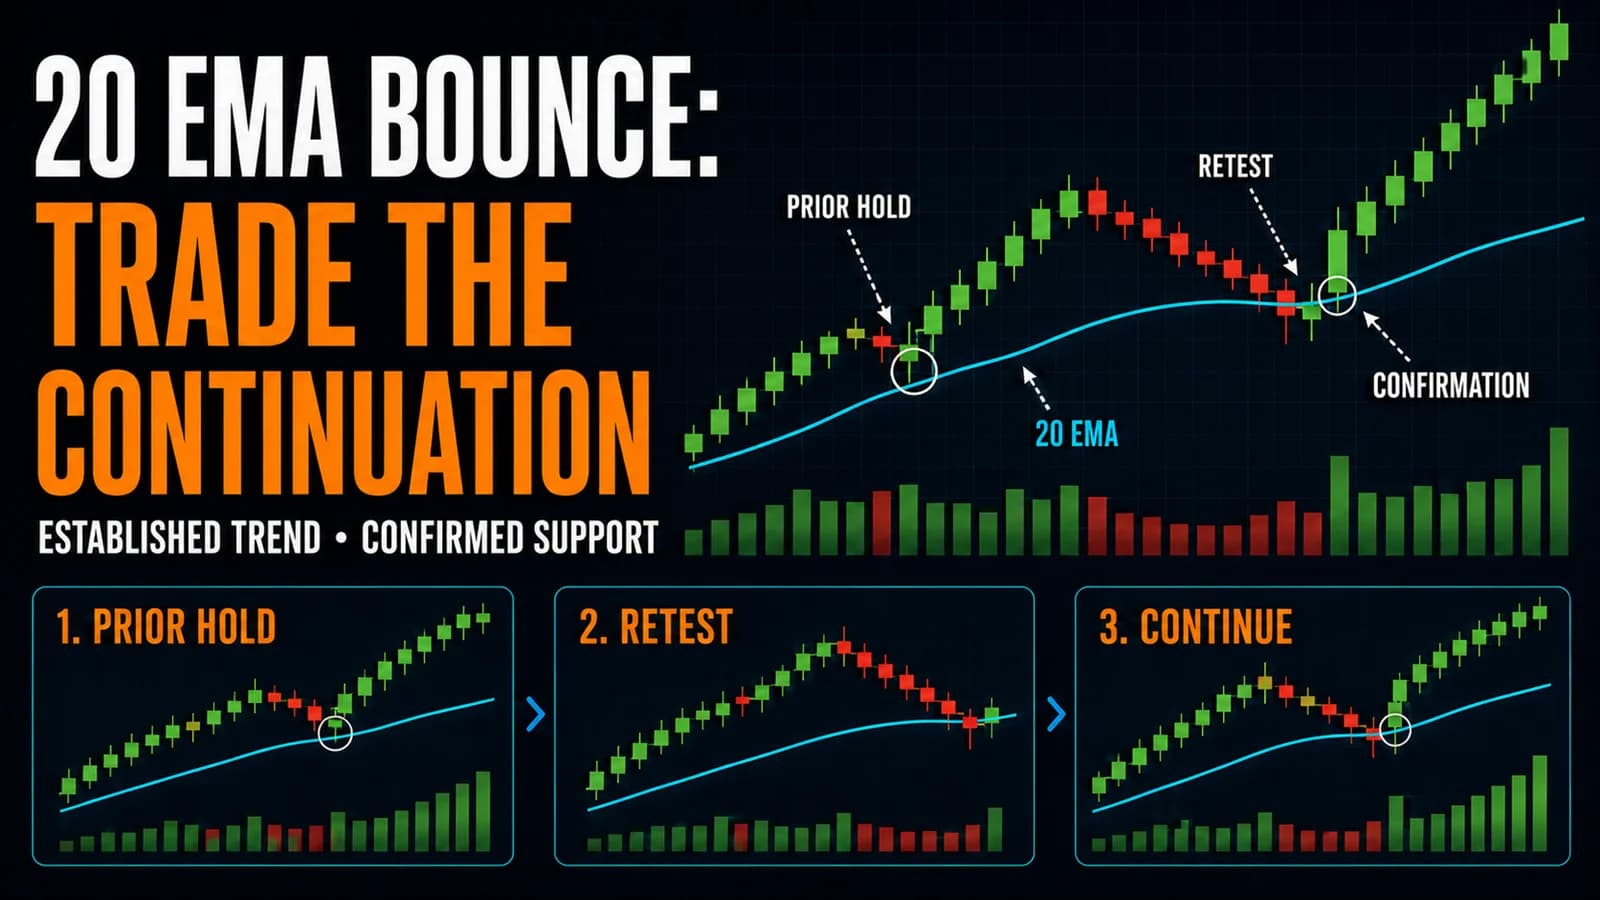
The 20 EMA Bounce Strategy: A Trend Continuation Classic
The 20 EMA bounce strategy explained: how to trade established trend pullbacks, set stops using volatility, and avoid trading unproven trends.
Strategies
The 1-Minute Scalp Strategy for Active Day Traders
On a 1-minute chart, some of what looks like real price action is just mechanical noise. This guide covers the setup, and how to tell the difference well.
Strategies
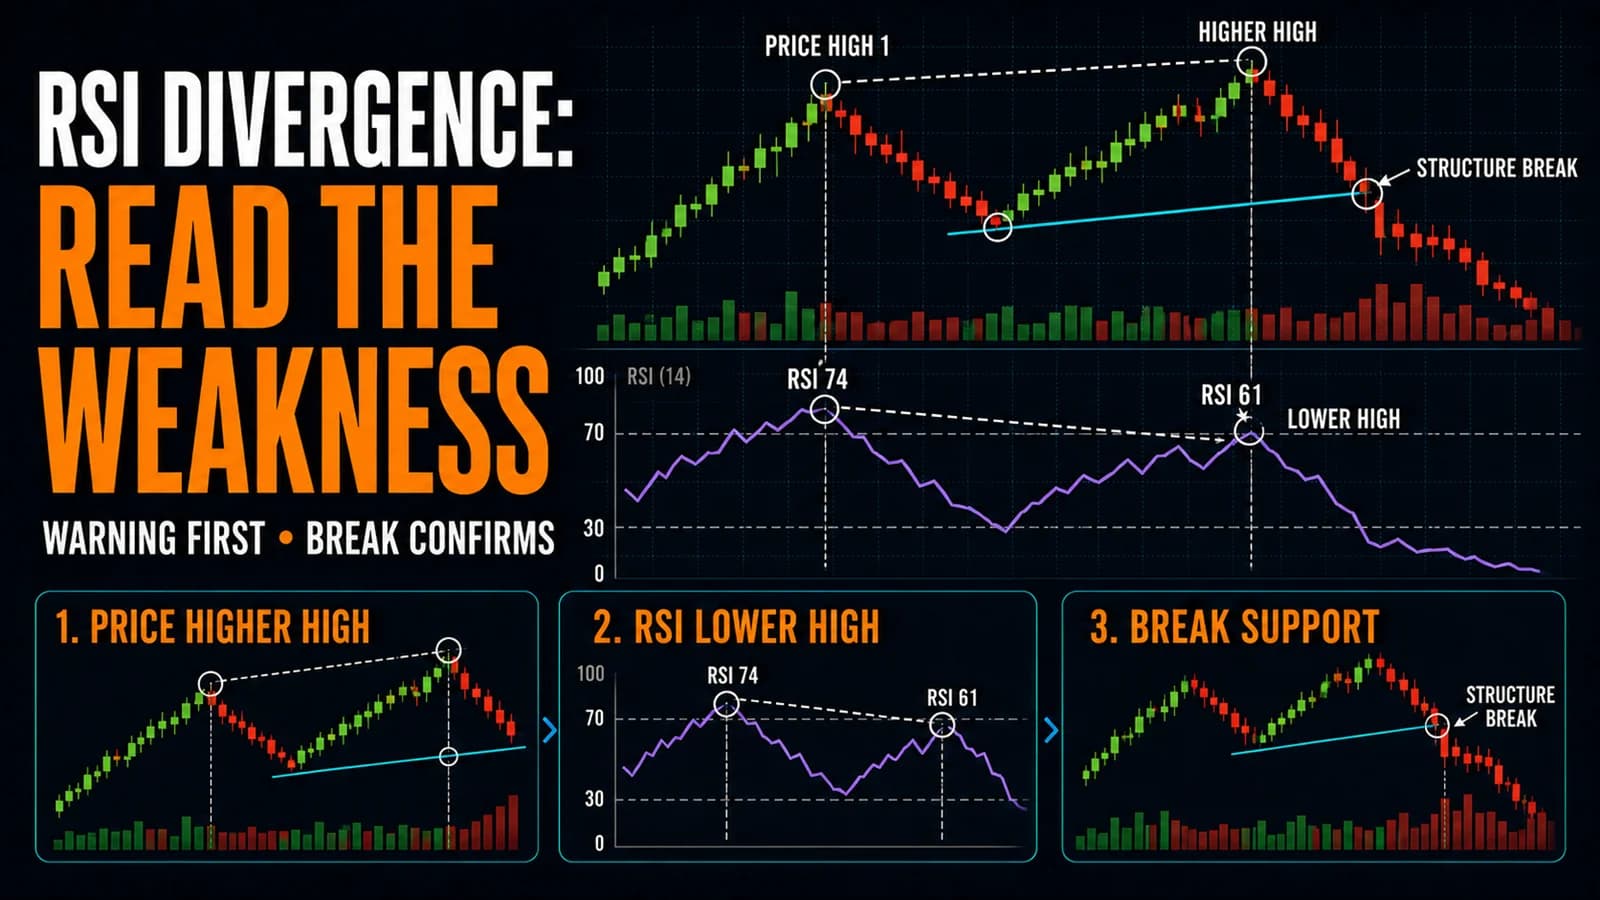
The RSI Divergence Trading Strategy for Day Traders
Trade RSI divergence with confidence: the difference between regular and hidden divergence, and why structural confirmation matters before entering.
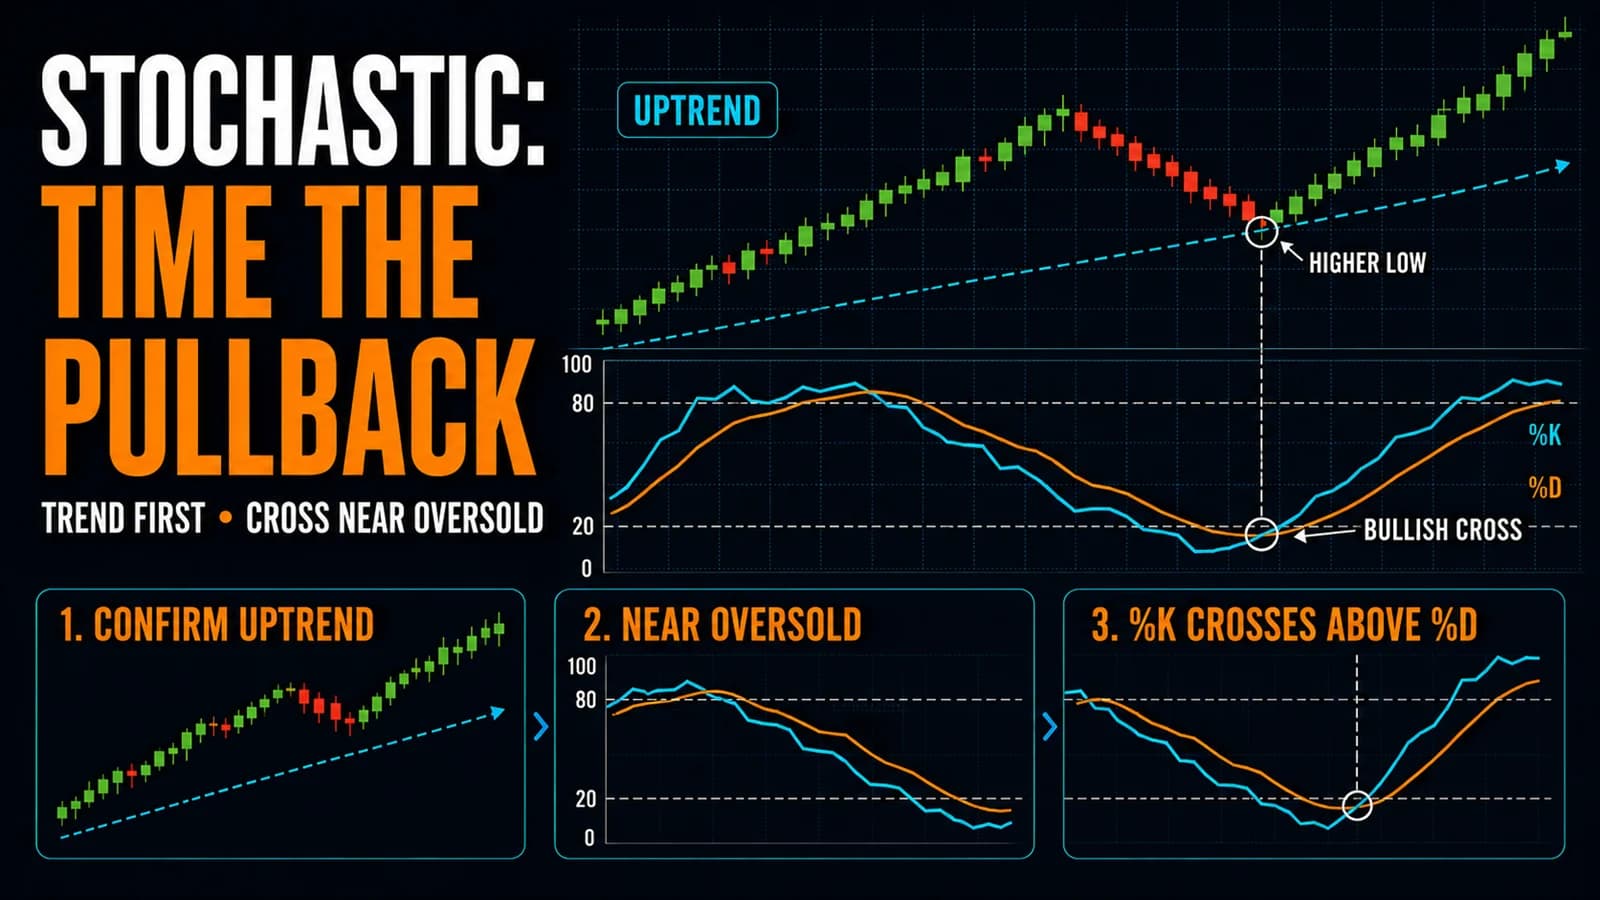
Strategies
The Stochastic Oscillator Day Trading Strategy
Trade the stochastic oscillator correctly: how %K/%D crossovers work, why context beats raw overbought readings, and common failure modes.
Comments
No comments yet. Be the first to share your thoughts.